The main category of All News Articles.
You can use the search box below to find what you need.
[wd_asp id=1]
The main category of All News Articles.
You can use the search box below to find what you need.
[wd_asp id=1]
XRP is showing renewed momentum toward the $2 level, with its price closely watched as multi-year structural patterns and concentrated liquidity zones may influence short-term gains.
Market participants are monitoring XRP’s performance alongside ongoing developments in Ripple’s regulatory landscape. While the short-term outlook appears cautiously bullish, broader market conditions and trading volume will play a key role in determining whether this momentum can be sustained.
XRP has formed a multi-year ascending triangle on its monthly chart, a pattern that historically has resolved in favor of upward moves more often than not. However, analysts caution that historical tendencies, often cited at 68–77% bullish resolution, vary depending on trading volume, liquidity, and macroeconomic factors.
XRP’s multi-year macro triangle forms a strategic roadmap, signaling potential breakout opportunities over the next two months. Source: @egragcrypto via X
“The triangle isn’t noise; it’s a roadmap,” noted crypto analyst EGRAG CRYPTO. “Near the apex, XRP could test gains above $2, particularly if regulatory clarity continues to improve.”
While visually interesting, symbolic interpretations, such as references to Greek mythology, should be seen as illustrative rather than predictive. The macro triangle primarily signals a compression phase, suggesting that a decisive breakout will not be confirmed until price decisively moves above long-term resistance levels with accompanying volume.
Market data shows dense liquidity clusters just above XRP’s current trading range of $1.87, particularly between $1.90 and $2.03. Such levels often attract short-term reactive buying, though outcomes are not guaranteed. Spot volume, funding rates, and derivative positioning should also be considered when evaluating these zones.

XRP faces significant liquidity above its current price, suggesting a potential short-term rebound toward $2. Source: @ChartNerdTA via X
ChartNerdTA noted, “$XRP has tonnes of liquidity stacked above its current price. A move back up to $2 is plausible in the short term.” Candlestick patterns over the past week indicate that XRP found support near $1.85, signaling that the lower end of this range may provide temporary stability.
Short-term H4 analysis of XRP/USDT suggests improving momentum: the descending trendline has been broken, and the price is pushing into the Ichimoku cloud. This indicates the possibility of a tactical bounce, though it does not confirm a sustained trend reversal.

XRP/USDT shows a bullish H4 reversal with support at $1.85–$1.90, targeting $2.10 and $2.50, while a close below $1.80 would invalidate the setup. Source: RSI_Trading_point on TradingView
A suggested buy zone lies between $1.85 and $1.90, with targets at $2.10 and $2.50. A sustained close below $1.80 would invalidate the bullish scenario. Analysts emphasize that the near-term move is reactive and conditional, and a confirmed breakout would require acceptance above $2.03, accompanied by rising volume.
XRP’s price action is supported by a combination of macro structure and near-term liquidity considerations, suggesting conditional bullish potential toward $2. Traders should remain mindful of key support at $1.85 and resistance around $2.03, alongside Ripple’s ongoing regulatory updates.

XRP was trading at around 1.87, up 0.71% in the last 24 hours at press time. Source: XRP price via Brave New Coin
By separating tactical short-term scenarios from unconfirmed macro breakout signals, this analysis offers a measured perspective, emphasizing scenario-based outcomes rather than deterministic predictions. Monitoring trading volume and broader market conditions remains essential for gauging XRP’s next moves.
Despite new record highs, a slowdown in momentum is indicated by the three narrow range days at the top of the trend. Friday’s advance broke above a 127.2% extension target at $4,516. That was a potential resistance zone, but it only stalled the ascent by a couple of days. A 161.8% measured move projection (AB = 161.8% of price change in initial AB leg) is next in line at $4,578 as a possible upside target. However, given a breakout above the 127.2% extension, the 161.8% extension of the October bearish correction becomes a potential target at $4,687. That level is bounded by a 350% measured move projection at $4,664 below, and a 423.6% extension at $4,713, which is from the long-term correction that followed the 2011 peak of $1,921.
This $4,664 to $4,713 price range is highlighted since the range includes two long-term indicators and the three price levels are relatively close together. It is the confluence of indicators pointing to a similar price zone that seems to sometimes act like a magnet for price. Strength indicated by this week’s new high breakout will confirm with a strong weekly close today. Moreover, the price of gold is following through to new highs on the second breakout above a rising trend channel. The channel shows symmetry in the uptrend. A sustained advance above the top of the channel shows a new leg higher at elevated momentum. If sustained, it could be the early part of a possible blow of phase where momentum could spike.
Nevertheless, the bullish indications are sure to be noticed by investors and draw attention to pullbacks that can be watched for setups to enter the trend. The recent new high breakout level at $4,381 and the 10-day average, also at $4,381 but rising, present the first more significant potential decision zone.
For a look at all of today’s economic events, check out our economic calendar.
Image: https://www.abnewswire.com/upload/2025/12/2fee3b7977733613714b146305a1f72e.jpg
Energy B us offers easy, healthy meal replacements for the contemporary lifestyle, rooted in our philosophy of “making nature’s little grains into our huge energy.” The latest offering comes in single-serving powder sticks and includes customer-preferred grains with improved nutritional balance, satisfying both convenience and dietary requirements.
The feature product “Charm Protein Grain Powder” contains 19 types of grains that have been steamed, roasted, and ground to bring out the smooth taste of subtle flavors, and it is complete with proteins, minerals, and probiotics to meet the nutritional needs of a full meal. Four types of fermented beans in “Charm Protein Fermented Grain Powder” make it easy to digest, with more protein and a nutty, umami taste.
Image: https://www.abnewswire.com/upload/2025/12/0e0e4dc90c579446b8159a2769be53e8.jpg
The protein supplements lineup also received a boost. The “Classic Cacao” combines animal and plant proteins in a 6:4 ratio with Dutch cocoa to create a balance of taste and nutrition. The “Classic Black Bean” boasts the unique flavor of Korean black beans, along with vitamins, minerals, and probiotics, making a complete, balanced meal. The new products are available on Energy B us’s official online store.
Taeseong Food’s official said that they “use carefully selected ingredients and balance nutritional design to capture the true energy of each little grain” and added that they “will continue to offer new products that would help consumers make healthier choices in their daily lives.”
Media Contact
Company Name: Taeseong Food
Contact Person: Haegu, Chang
Email:Send Email [https://www.abnewswire.com/email_contact_us.php?pr=energy-b-us-launching-meal-supplements-with-growninkorea-grainbased-protein-and-vitamins]
City: Seoul
Country: South Korea
Website: https://www.coupang.com/vp/products/9254601785?itemId=27376108723&vendorItemId=94342000015&q=%EC%B0%B8%EB%8B%A8%EB%B0%B1%ED%95%9C%EC%84%A0%EC%8B%9D&searchId=929192b0890971&sourceType=search&itemsCount=36&searchRank=1&rank=1&traceId=mjlgquh1
Legal Disclaimer: Information contained on this page is provided by an independent third-party content provider. ABNewswire makes no warranties or responsibility or liability for the accuracy, content, images, videos, licenses, completeness, legality, or reliability of the information contained in this article. If you are affiliated with this article or have any complaints or copyright issues related to this article and would like it to be removed, please contact retract@swscontact.com
This release was published on openPR.
The PEPE that Pepeto maintains, and adds “Technology” and “Optimization” to the identity recognized by traders. The ecosystem comprises the zero-fee swap platform, PepetoSwap, the cross-chain liquidity bridge, Pepeto Bridge, and verified meme trading, Pepeto Exchange. Every swap, trade, and listing passes through the $PEPETO token and provides in-built demand, which scales based on ecosystem usages.
The listings were formally celebrated with a bell-ringing ceremony at market close on the B3 Exchange in
DeFi Technologies’ BDRs and Valour’s ETPs now trading on B3 are:
The products provide Brazilian investors with BRL-denominated, locally listed exposure to both DeFi Technologies’ equity and leading digital assets via the same brokerage and custody infrastructure used for equities and ETFs.
Strategic Entry Into a Key Global Market
As
For Valour, which already offers more than 100 digital asset ETPs listed across major European exchanges, the B3 listings represent its first move outside
Management Commentary
“Ringing the bell at B3 to celebrate the launch of DEFT31 and Valour’s ETPs was an important milestone for our entire organization,” said Johan Wattenström, Chief Executive Officer and Executive Chairman of DeFi Technologies and Co Founder of Valour. “
“This launch is our first step outside
“We would like to thank B3 Exchange, Cepeda Advogados and BTG Pactual for their partnership and support in bringing this initiative to market, as well as the teams across DeFi Technologies and Valour whose commitment and hard work made this launch a reality,” added Mr. Forson.
About B3 Exchange
B3 S.A. – Brasil, Bolsa, Balcão (“B3” or the “B3 Exchange”) is the Brazilian stock exchange and one of the main financial market infrastructure companies in the world. Headquartered in São Paulo and listed on its Novo Mercado premium segment under the ticker B3SA3, B3 organizes and enables trading, clearing, settlement, registration and depository services across equities, derivatives and over-the-counter markets, as well as data and technology services. For more information please visit https://www.b3.com.br/en_us/
About DeFi Technologies
DeFi Technologies Inc. (Nasdaq: DEFT) (CBOE CA: DEFI) (GR: R9B) is a financial technology company bridging the gap between traditional capital markets and decentralized finance (“DeFi“). As the first Nasdaq-listed digital asset manager of its kind, DeFi Technologies offers equity investors diversified exposure to the broader decentralized economy through its integrated and scalable business model. This includes Valour, which offers access to one hundred of the world’s most innovative digital assets via regulated ETPs; Stillman Digital, a digital asset prime brokerage focused on institutional-grade execution and custody; Reflexivity Research, which provides leading research into the digital asset space; Neuronomics, which develops quantitative trading strategies and infrastructure; and DeFi Alpha, the Company’s internal arbitrage and trading business line. With deep expertise across capital markets and emerging technologies, DeFi Technologies is building the institutional gateway to the future of finance. Follow DeFi Technologies on LinkedIn and X/Twitter, and for more details, visit https://defi.tech/
DeFi Technologies Subsidiaries
About Valour
Valour Inc. and Valour Digital Securities Limited (together, “Valour“) issues exchange traded products (“ETPs”) that enable retail and institutional investors to access digital assets in a simple and secure way via their traditional bank account. Valour is part of the asset management business line of DeFi Technologies. For more information about Valour, to subscribe, or to receive updates, visit https://valour.com.
About Stillman Digital
Stillman Digital is a leading digital asset liquidity provider that offers limitless liquidity solutions for businesses, focusing on industry-leading trade execution, settlement, and technology. For more information, please visit https://www.stillmandigital.com
About Reflexivity Research
Reflexivity Research LLC is a leading research firm specializing in the creation of high-quality, in-depth research reports for the bitcoin and digital asset industry, empowering investors with valuable insights. For more information please visit https://www.reflexivityresearch.com/
Cautionary note regarding forward-looking information:
This press release contains “forward-looking information” within the meaning of applicable Canadian securities legislation. Forward-looking information includes, but is not limited to the listing of Valour’s ETPs and DeFi Technologies’ BDRs on B3; future expansion plans into
THE CBOE
")
![]() View original content to download multimedia:https://www.prnewswire.com/news-releases/defi-technologies-and-valour-mark-strategic-entry-into-brazil-with-bell-ringing-ceremony-at-b3-exchange-302648579.html
View original content to download multimedia:https://www.prnewswire.com/news-releases/defi-technologies-and-valour-mark-strategic-entry-into-brazil-with-bell-ringing-ceremony-at-b3-exchange-302648579.html
SOURCE DeFi Technologies Inc.
Since bottoming at $48.64 on November 21, XAGUSD has rallied more than $28.67. Given the current fire power, it looks as if speculators want to challenge the 2026 target of $100 or better, well ahead of schedule.
Other interesting facts to note, since that November 21 bottom, the market has had only five losing sessions out 24. The nearest support is the swing chart 50% level at $69.50. And the market is currently $21.96 above the 50-day moving average at $55.35.
This is real price action, not amateur RSI data that has been flashing overbought for days, perhaps spooking weak shorts out of the market and putting enough fear into new buyers to keep them on the sidelines.
We’ve heard for months that traders are coming in on the “dips”, this hasn’t been the case since December 12, when the market pulled back $3.87. That was a one-day swing too. Today’s price action suggests we’re seeking this level of volatility on an hourly basis now.
Traders are saying the anticipation of more rate cuts by the Fed in 2026 and geopolitical risks are driving the current volatility. That’s fine for the short-run. Long-term, it’s the anticipation of a supply deficit and the listing of silver on the government’s list of critical minerals that’s going the major lifting.
But can it last? I think so. This rally is a lot different than the one I witnessed in the late 70’s. That was fueled by the Hunt Brothers trying to corner the market. It came to a screeching halt when COMEX ordered fully-priced margins. This rally is more structured and there are more players, who can afford the volatile price swings.
Many of us have made our list of resolutions for the New Year, and some of those resolutions involve health and fitness. We’ve decided to get healthy and believe that the answers lie in exercise, diet, social interaction for mental health — and vitamin supplements.
Of those, the one that puts up red flags is the vitamin supplements. If we don’t know what we’re doing, however, we can cause problems because what we take might be unsafe.
National Institutes of Health has explored the topic — https://tinyurl.com/Supplements-for-Older-Adults — and the site is full of caveats and warnings.
To be considered:
• If you’re hunting for supplement information on the internet or by watching TV ads, be wary about who is behind it. Do they have a reason — such as profit — for promoting a certain supplement?
• Remember that more is not necessarily better. Too much “more” of any supplement might be harmful to you.
Check the NIH dietary supplement database at dsld.od.nih.gov. They have over 200,000 supplements listed, and you can search by product, brand or ingredient.
Before you start taking supplements, talk to your doctor. You might be advised to make some adjustments to your diet instead, or they might know of a reason in your medical profile that indicates a certain supplement could cause problems for you.
The NIH also recommends looking at the Dietary Guidelines for Americans, 2020-2025, a free publication online at https://tinyurl.com/Make-Every-Bite-Count. There is a whole section for older adults.
When it comes to our prescription drugs, we need to be aware there, as well. To check for any interactions with drugs you are taking, go to drugs.com, click “Drugs Interaction Checker” and enter the drug name. You’ll get a result that shows any interactions, as well as warnings, side effects and uses of the drug.
Here’s to a healthy 2026 — with or without vitamin supplements!
Join Our Telegram channel to stay up to date on breaking news coverage
The Ethereum price prediction reveals that ETH remains one of the most influential assets in the crypto market, serving as the foundation for decentralized finance, NFTs, and smart contract innovation.
Being an early adopter of transformative crypto projects has often proven to be one of the biggest advantages for long-term investors, and Ethereum is a textbook example of this principle in action. From its all-time low recorded in October 2015, ETH has surged by an extraordinary +706,595.55%, highlighting how early exposure to strong fundamentals and real utility can deliver outsized returns over time. Even today, despite short-term price fluctuations between roughly $2,891 and $2,991 in the past 24 hours and trading nearly 40% below its all-time high of $4,953.73, Ethereum continues to demonstrate why early conviction matters. As the backbone of smart contracts, DeFi, NFTs, and countless blockchain innovations, ETH shows that identifying high-potential projects early, before mainstream adoption, can be far more impactful than trying to time perfect entries later in the cycle.
Key Levels:
Resistance levels: $3,600, $3,800, $4,000
Support levels: $2,300, $2,100, $1,900

At the time of analysis, ETH/USD is trading around $2,976, following a mild rebound from the lower boundary of its descending channel on the daily chart. This recovery suggests that buyers are beginning to show interest near key demand levels, although the broader trend still reflects consolidation after a prolonged corrective phase. Price action remains compressed between dynamic trendlines, indicating that a decisive breakout or breakdown may be approaching.
From a technical standpoint, Ethereum is hovering just below the 21-day moving average while the 9-day moving average is attempting to flatten, signaling slowing bearish momentum. The inability to reclaim and hold above these short-term moving averages keeps ETH vulnerable to renewed selling pressure. However, a sustained close above the 21-day MA would strengthen bullish conviction and could open the door for a push toward the descending channel’s upper boundary.
Be Ready For This ETH Move
Looking upward, the first major hurdle for bulls sits at $3,600, which aligns with prior resistance and the upper structure of the channel. A clean breakout above this level could trigger accelerated upside toward $3,800 and potentially $4,000, where stronger supply is expected. Such a move would likely require a noticeable expansion in volume to confirm that buyers have regained control of the trend. On the downside, failure to maintain current levels may expose Ethereum to renewed weakness. A decisive drop below the lower channel support could send ETH/USD toward the $2,300 support zone, with additional downside risk extending to $2,100 and $1,900 if bearish momentum intensifies. For now, Ethereum (ETH) sits at a critical inflection point, where holding above structural support keeps recovery hopes alive, while rejection from moving averages may prolong consolidation or trigger another leg lower.
On the daily chart, ETH/BTC is currently trading around 0.0335 BTC (≈ 3,351 SAT), consolidating within a well-defined descending channel that has guided price action since the September peak. The pair recently rebounded from the lower boundary of this channel near 0.0310 BTC (≈ 3,100 SAT), signaling that buyers are actively defending this support zone. However, price remains capped below the 21-day moving average, while the 9-day moving average continues to act as short-term resistance, suggesting that bullish momentum is still tentative and the broader structure remains corrective rather than impulsive.
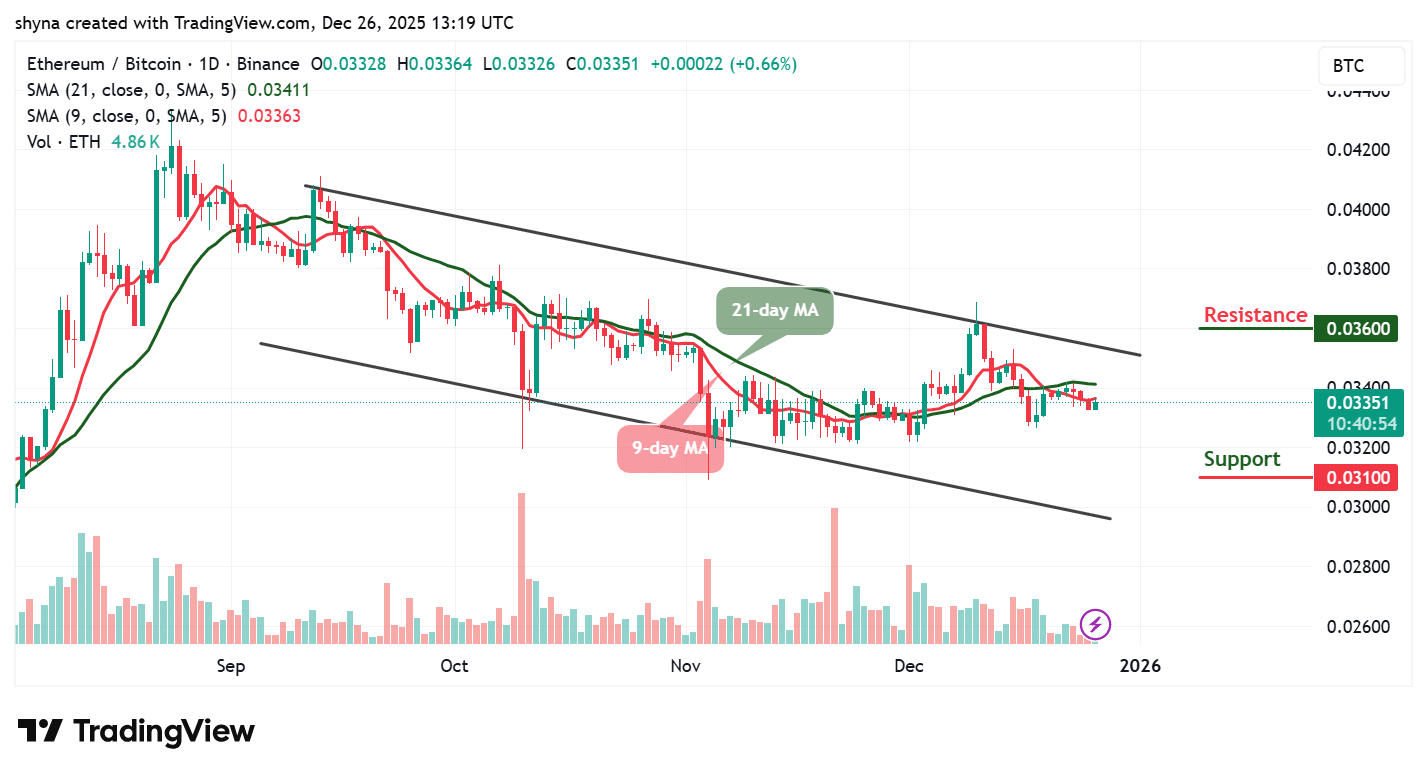
Technically, the next directional move will depend on how ETH/BTC reacts around the mid-channel and moving average cluster. A sustained daily close above the 21-day MA would improve the bullish outlook and could allow price to grind higher toward the key resistance at 0.0360 BTC (≈ 3,600 SAT), where sellers previously stepped in aggressively. A breakout above this level would signal relative strength for Ethereum against Bitcoin and potentially mark the beginning of a trend shift. Conversely, failure to hold above 3,300 SAT may invite renewed downside pressure, exposing ETH/BTC to another test of the 3,100 SAT support, with a breakdown likely extending losses toward the lower channel boundary.
Moreover, @0xPepesso, who has over 156k followers on X (formerly Twitter), shared a bullish outlook on $ETH, noting that the price appears to be on the verge of a breakout after tightening within a falling channel around a major demand zone. According to the analysis, selling pressure is clearly weakening, suggesting that momentum may be shifting in favor of the bulls, with a potential move opening up toward the $5,000 level, adding a confident reminder that the signal shouldn’t be ignored.
$ETH IS MOMENTS AWAY FROM A BREAKOUT
Price is compressed inside a falling channel at a key demand zone
Selling pressure is fading
Next target: $5,000
Don’t say, I didn’t warn you! pic.twitter.com/j2ohb2JQ1p
— Pepesso (@0xPepesso) December 26, 2025
Nevertheless, Ethereum’s current price action reflects a market under pressure but quietly building energy for a decisive move. The crypto analyst above, @0xPepesso, highlights fading selling pressure and a potential breakout from a compressed structure at a key demand zone, which closely aligns with the broader chart analysis showing a rebound from channel support and tightening price action. While the technical outlook remains cautious, with price still constrained by moving average resistance and a descending channel, the flattening short-term averages suggest bearish momentum is weakening. Overall, both perspectives point to Ethereum approaching a critical inflection point, where sustained buying interest could trigger an upside breakout, while rejection at key technical barriers may prolong consolidation before the next major move.
Best Wallet – Diversify Your Crypto Portfolio

Join Our Telegram channel to stay up to date on breaking news coverage
Updated: 26.12.2025 | 10:14 a.m. EST
U.S. natural gas is ending the week with a familiar winter push-and-pull: colder early‑January forecasts and strong LNG demand on one side, near‑record production and still‑healthy storage on the other.
In holiday-thinned trade on Friday morning, NYMEX Henry Hub natural gas (January 2026) hovered around the mid‑$4.30s per MMBtu, extending a rebound that traders are tying to colder model runs and steady export pulls. Barchart showed NGF26 near $4.342/MMBtu mid‑morning, while market reporting also pegged the contract around $4.29/MMBtu earlier in the session. [1]
Below is what’s moving natural gas today (26.12.2025) across news, forecasts, and market analysis, including the next big catalysts traders are watching into year-end.
With many participants out for the holidays, liquidity is thinner than usual—and that can exaggerate moves in either direction.
This is also a notable moment on the calendar: Barchart lists expiration timing for NGF26 approaching at the end of December, which tends to accelerate position‑rolling and can add noise to day-to-day price action. [4]
Bottom line: Friday’s tape is being shaped not only by fundamentals, but also by holiday liquidity and the late‑month contract transition—a mix that often increases volatility.
The central driver in U.S. winter gas is still the same metric traders watch every day: heating demand.
Market reporting on Friday tied the bounce to forecasts pointing to colder conditions and higher demand into early January, particularly across the eastern half of the U.S. [5]
One way to translate that into market language is with Heating Degree Days (HDDs), a key proxy for heating demand:
This nuance matters. Natural gas can rally sharply on model runs that “turn colder,” but if temperatures remain below-normal vs. normal on the HDD scale, upside can be capped—especially with production running hot.
If weather is the spark, production is the wet blanket.
Friday’s reporting cited Lower 48 output at a record-high pace in December, around 109.8 bcfd, topping November’s record. [7] That level of supply matters because it reduces how quickly cold weather can tighten the market—unless demand spikes hard.
EIA’s latest Short‑Term Energy Outlook (released December 9) also frames the same story for 2026: rising production is expected to help moderate prices after winter, with U.S. dry gas output forecast around 109 Bcf/d in 2026. [8]
Translation: Even if early January turns colder, the market’s immediate question becomes: Is it cold enough to overwhelm record supply and strong LNG pulls?
LNG is a structural pillar under U.S. natural gas demand—and it has been especially important this year.
Friday market reporting said gas flows to the eight large U.S. LNG export plants averaged about 18.4 bcfd so far this month, near record territory. [9]
There’s also a plant‑specific note that traders watch because it can swing feedgas quickly:
From a macro perspective, EIA’s December STEO points to LNG exports staying elevated longer-term, projecting U.S. LNG exports at 14.9 Bcf/d in 2025 and 16.3 Bcf/d in 2026. [11]
And while U.S. LNG remains globally significant, Reuters data-driven analysis notes that Asia’s LNG imports from the U.S. fell in 2025 versus 2024, highlighting how trade policy and shifting demand patterns can influence where U.S. cargoes ultimately land. [12]
For U.S. natural gas, weekly storage is the scoreboard—and the schedule matters this week.
EIA’s official schedule shows the Weekly Natural Gas Storage Report was shifted to Monday, December 29, 2025 at 12:00 p.m. ET due to the Christmas holiday, with another holiday adjustment set for Wednesday, December 31 at 12:00 p.m. ET. [13]
Barchart also referenced the same holiday shift, underscoring how widely traders are focused on the Monday release. [14]
EIA’s Natural Gas Weekly Update (release date December 18, covering the week ending December 17) reported:
In the December STEO, EIA outlined why its winter price forecast moved higher: it assumed December would be colder than previously modeled and projected heavier withdrawals—expecting 580 Bcf of inventory withdrawals in December, notably above the five‑year average for the month. [16]
Why this matters for Monday: If the next storage figure shows a draw that surprises to the upside (bigger withdrawal), it can validate the “colder + tight balance” narrative. A softer draw would strengthen the argument that record production and comfortable inventories can absorb winter demand.
Supply isn’t only a function of the weather—it’s also a function of how aggressively producers drill.
The most recent Baker Hughes data (reported by Reuters) showed:
That headline number alone doesn’t guarantee higher output (productivity and associated gas matter), but it supports the broader theme seen across multiple sources: the U.S. system has been producing at exceptionally high levels—even as the market tries to price winter risk.
EIA’s STEO also noted that updated assumptions about gas-to-oil ratios (GORs), especially in the Permian, contributed to a higher production outlook. [18]
U.S. natural gas is increasingly tied to global gas pricing—because global prices help determine how “sticky” U.S. LNG demand will be.
A Reuters global LNG market update (published Dec 24) put February-delivery LNG into Northeast Asia around $9.60/mmBtu, slightly higher on the week—but still reflecting a generally soft market, with prices down significantly year-to-date. [19]
That same reporting highlighted:
Europe remains the “balancing market” when LNG is abundant. An Investing.com market analysis (published Dec 25) cited Europe’s gas storage level around 66.1% as of Dec 24, below average and below last year. [21]
Meanwhile, the Reuters LNG market update noted that European gas prices ticked up in thin trade on cold-spell forecasts, and also described firm buying interest into early Q1 2026 in parts of Central and Eastern Europe, tied to concerns about pipeline flows and regional supply needs. [22]
Two Russia-linked developments are shaping longer-term supply expectations:
These shifts don’t directly set Henry Hub on any given day, but they do influence global LNG supply/demand expectations—which can feed back into U.S. LNG economics and, ultimately, U.S. gas balances.
A widely read Reuters Breakingviews column published today adds a longer-horizon angle: as major producers plan aggressive LNG capacity growth into 2030, the rapid cost declines and fast deployment of renewables (plus grid storage) could undercut future LNG demand growth—raising the risk of an oversupply cycle later in the decade. [25]
That matters even for today’s market because long-dated gas pricing and LNG contracting influence investment decisions, forward curves, and producer behavior—all of which shape how tight (or loose) the market can become in future winters.
Here are the near-term catalysts most likely to move U.S. natural gas into year-end:
EIA’s December STEO provides the clearest “official” baseline:
That forecast lines up with what Friday’s market is pricing in: winter risk still matters, but the ceiling is debated because supply is robust and the system entered winter with above-average inventories. [33]
Natural gas is trading like a winter market again—weather-led, headline-sensitive, and increasingly tied to LNG flows. The next test is whether the colder outlook translates into a storage draw strong enough to overcome the market’s most stubborn counterweight: record U.S. production. [34]
1. www.barchart.com, 2. www.barchart.com, 3. www.worldenergynews.com, 4. www.barchart.com, 5. www.worldenergynews.com, 6. www.worldenergynews.com, 7. www.worldenergynews.com, 8. www.eia.gov, 9. www.worldenergynews.com, 10. www.worldenergynews.com, 11. www.eia.gov, 12. www.reuters.com, 13. ir.eia.gov, 14. www.barchart.com, 15. www.eia.gov, 16. www.eia.gov, 17. www.reuters.com, 18. www.eia.gov, 19. www.brecorder.com, 20. www.brecorder.com, 21. www.investing.com, 22. www.brecorder.com, 23. www.reuters.com, 24. www.reuters.com, 25. www.reuters.com, 26. ir.eia.gov, 27. www.worldenergynews.com, 28. www.worldenergynews.com, 29. www.worldenergynews.com, 30. www.brecorder.com, 31. www.eia.gov, 32. www.eia.gov, 33. www.eia.gov, 34. www.worldenergynews.com
NEW DELHI-India’s food safety regulator has tightened the rules on what can be officially called “tea”, making it clear that only products made from the plant Camellia sinensis can use the word on their labels.
In a directive, the Food Safety and Standards Authority of India (FSSAI) said that many food business operators are wrongly using the term “tea” for herbal infusions and plant-based drinks that are not made from Camellia sinensis. According to the regulator, this practice is misleading consumers and amounts to misbranding.
The FSSAI said it found several products in the market being sold as “Rooibos tea”, “herbal tea” and “flower tea”, even though these beverages are not derived from the tea plant. The authority clarified that such products do not meet the legal definition of tea and therefore cannot be marketed using that name.
As per existing regulations, only infusions made from Camellia sinensis qualify as tea. This includes well-known varieties such as green tea, Kangra tea and instant tea. Any drink made from other plants, herbs or flowers does not fall under this category.
The regulator has warned all food business operators, to stop using the word “tea” directly or indirectly for products that are not derived from Camellia sinensis. Failure to comply, it said, will be treated as a violation of food safety laws. (IANS)
 Price Forecast: Rally Extends to Fresh Highs as Buyers Maintain Control")


 Forecast: Silver Rally Accelerates as Silver News Fuels Bullish Price Prediction")
:quality(70)/cloudfront-us-east-1.images.arcpublishing.com/shawmedia/IGFGVSGM5ZFVJN32ZXRN654A2Y.jpg "Do we need vitamin supplements? – AgriNews")

