The main category of All News Articles.
You can use the search box below to find what you need.
[wd_asp id=1]
The main category of All News Articles.
You can use the search box below to find what you need.
[wd_asp id=1]
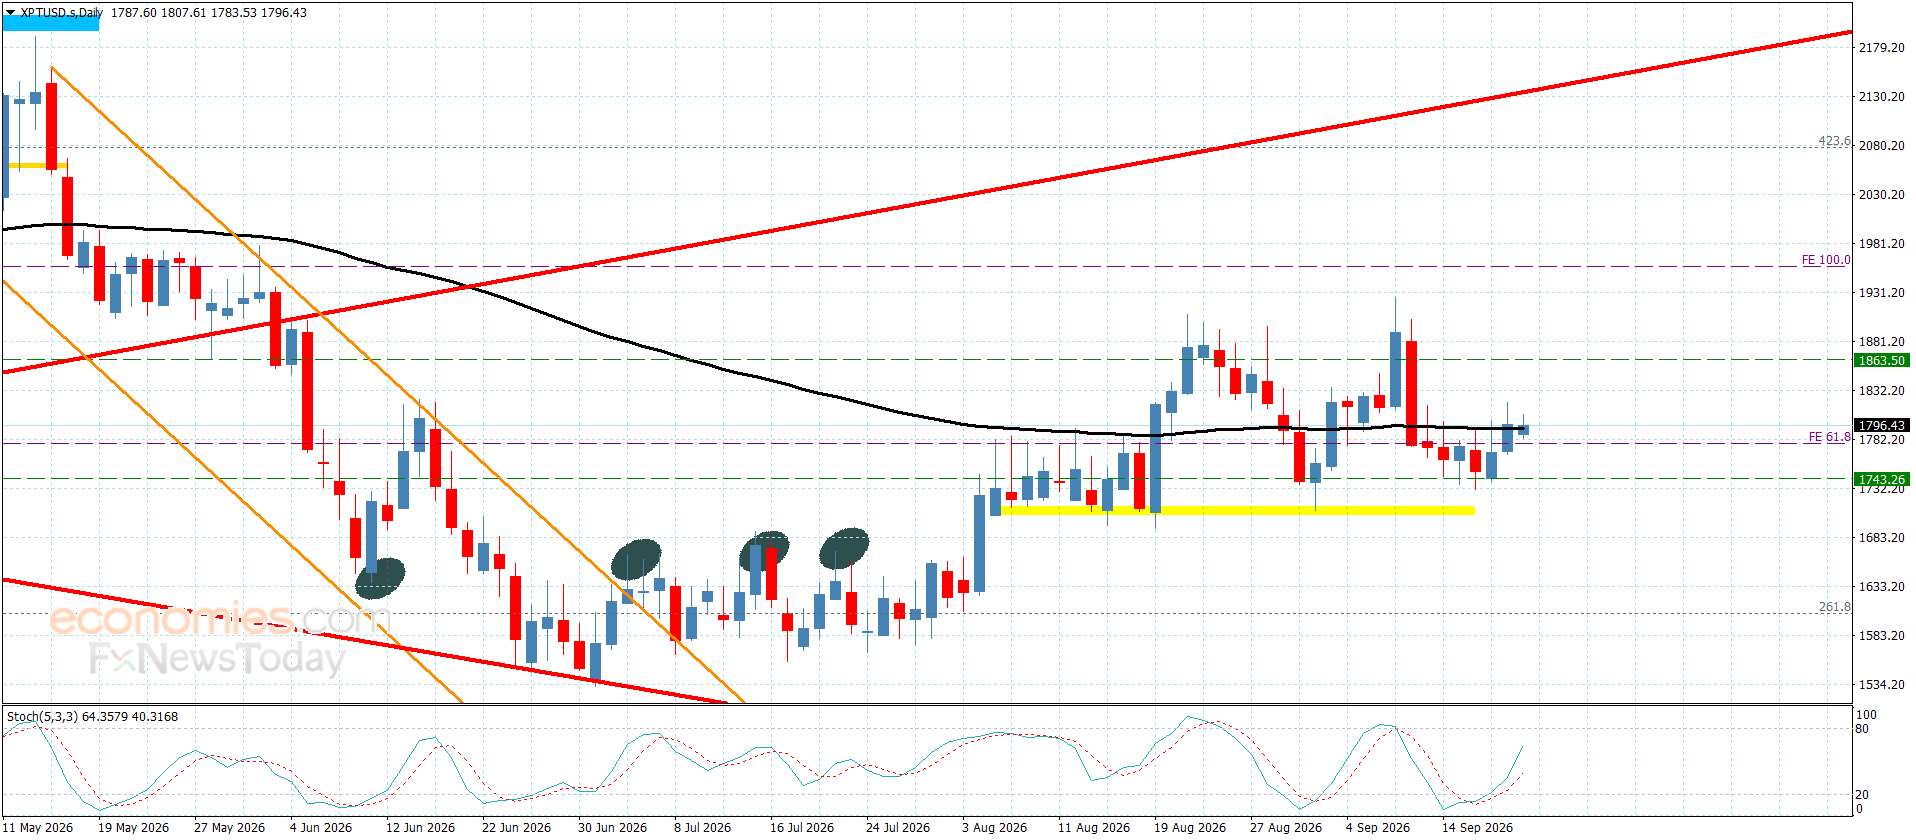
Platinum price remained unchanged up to this moment due to its repeated positioning below the resistance at $1,840.00. The price continues to fluctuate near the 55-period moving average. We note that the bullish scenario remains valid as long as the support level at $1,705.00 holds, which keeps us waiting for the required breakout before the price begins recording further gains, initially targeting $1,880.00 and then attempting to reach the next main target near $1,960.00.
On the other hand, a decline below the support level at $1,705.00 and sustained trading beneath it would confirm a shift into a bearish path, with the price expected to incur significant losses, initially moving toward $1,645.00.
The expected trading range for today is between $1760.00 and $1880.00
Trend forecast: Bullish
Key Points
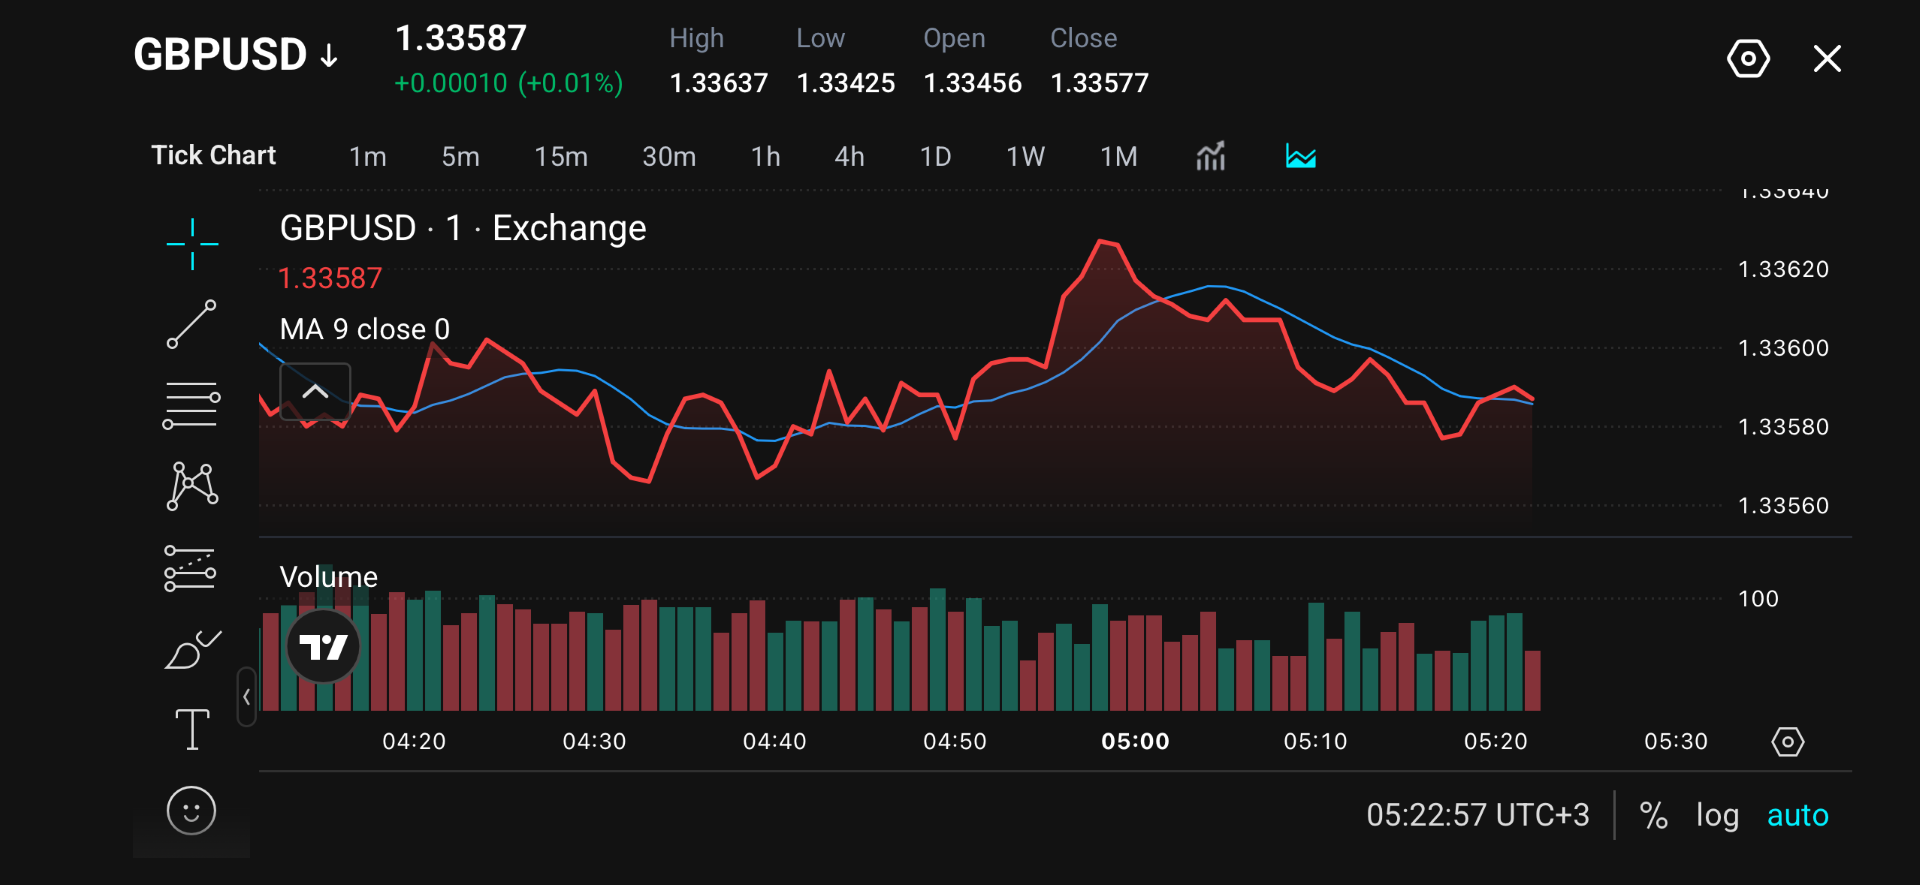
GBP/USD is trading around 1.3358 after recovering slightly from recent losses.
The pair has struggled to maintain momentum above the 1.3360–1.3365 region, where previous rebounds have faced resistance.
A recovery above key resistance levels would be needed to improve the short-term outlook.
With the Federal Reserve and Bank of England policy meetings now concluded, traders are shifting focus towards incoming economic data for clues on growth performance and future market direction.
The upcoming UK and US Flash Purchasing Managers Index (PMI) releases will provide signals on business and economic activity, which could influence expectations for future monetary policy decisions.
Stronger UK data may offer support for sterling, while renewed strength in US economic indicators could favour the dollar.
| Level | Price Area | Significance |
| Resistance 1 | 1.3365 | Immediate intraday resistance |
| Resistance 2 | 1.341 | Key recovery level |
| Resistance 3 | 1.3474 | Major resistance zone |
| Support 1 | 1.3345 | Current support area |
| Support 2 | 1.3255 | Next downside target |
| Support 3 | 1.3194 | Key Fibonacci support zone |
GBP/USD is currently testing the 1.3345 support zone, which acts as the immediate decision point for the next move. A successful defence of this level could allow buyers to target 1.3410 and 1.3474.
However, a break below support may confirm renewed selling pressure and expose the pair to 1.3255 and 1.3194.
| Scenario | Condition | Key Levels | Potential Move |
| Bullish Setup | Buyers defend support and push price above resistance | Hold above 1.3345; break above 1.3365 | Recovery towards 1.3410, followed by 1.3474 if momentum strengthens |
| Bearish Setup | Sellers regain control after support breakdown | Break below 1.3345 | Further downside towards 1.3255, with 1.3194 as the next major support |
For a bullish scenario, GBP/USD could attempt a recovery if buyers defend the 1.3345 support zone and push price back above 1.3365. Momentum indicators would need to confirm improving buying pressure for the rebound to extend.
For a bearish scenario, a break below 1.3345 could signal that sellers remain in control, increasing the risk of a move towards 1.3255. Further weakness below this level may extend the broader September correction.
Disclaimer
The price levels and market scenarios above reflect the author’s assessment at the time of writing. They do not represent financial advice or an official recommendation from VT Markets. Traders should conduct their own analysis and manage risk carefully.
GBP/USD remains at a critical point after its recent decline, with the next direction likely dependent on whether buyers can defend current support levels.
Flash Manufacturing and Services PMI figures are due from both the UK and U.S. on the 23rd, offering crucial clues on economic performance on both the pound and dollar.
If the UK’s PMI report is weak, it suggests a slowing economy, which can lead to a decline in the pound against the US dollar. Conversely, a strong PMI reading indicates a sturdy economy, which could strengthen the pound.
The US PMI data influences the dollar similarly, affecting the GBP/USD exchange rate.
Trade GBP/USD with competitive spreads, flexible leverage options and advanced trading platforms designed for forex markets.
Access GBP/USD opportunities through MetaTrader 4, MetaTrader 5 and the VT Markets App.
Start a live account with VT Markets today.
GBP/USD has declined after failing to break higher resistance levels, with sellers gaining control during September. The pair is now testing important technical support zones.
Key levels include 1.3410 and 1.3474 on the upside, while 1.3345, 1.3255 and 1.3194 are important downside levels.
Upcoming UK and US PMI data may influence expectations for economic growth and affect the relative strength of the British pound and US dollar.
GBP/USD is showing short-term bearish pressure while trading below recent resistance levels. A move above key resistance would be needed to improve the near-term outlook.
Start trading now — click here to create your real VT Markets account.
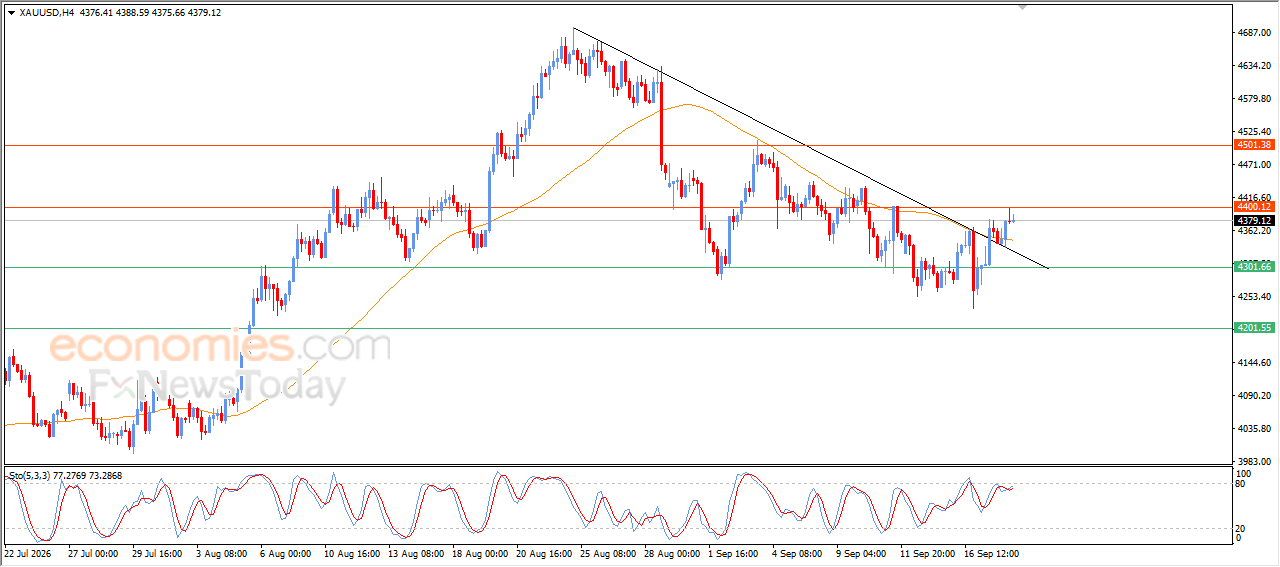
Gold is holding higher during its recent intraday trading, reaching $4,400 resistance level, which was our morning target, supported by the price continuing to trade above EMA50, giving it renewed momentum that strengthens the chances of extending these gains in the near term, particularly if it breaks above this resistance. The price is also benefiting from breaking above a short-term bearish corrective trendline, alongside positive signals from the relative strength indicators.
The Euro to US Dollar exchange rate (EUR/USD) finished Friday near 1.1486, almost 1% lower over the week, with ING warning of a possible test of 1.1400.
Euro to Dollar (EUR/USD): 1.148572 (+0.09%)
Dollar to Yen (USD/JPY): 156.88243 (+0.46%)
Crédit Agricole’s December forecast is lower at 1.13, extending to March 2027 before a gradual recovery later that year.
Wednesday’s Fed-driven fall below 1.15 accounted for much of the weekly decline.
The Federal Reserve raised rates by 25 basis points to 3.75%-4.00%, while its 4.1% median projection for end-2026 implies another quarter-point increase.

ING sees scope for higher short-term US yields to support the Dollar, particularly if incoming data and energy prices encourage markets to price an October hike.
However, it also highlights hawkish ECB commentary as a reason for caution:
“This is one reason not to chase EUR/USD lower too aggressively from current levels.”
Its 1.1400 view is a near-term downside risk, with Friday’s assessment also allowing for stabilisation.
Crédit Agricole shares that qualified bearish stance:
“We are moderately bearish on EUR/USD from current levels because we expect additional ECB tightening to limit the downside risks to a degree in the coming months.”
The bank argues that expensive energy, weaker international competitiveness and renewed sovereign credit concerns weigh on European assets, even with the economy proving resilient.
It forecasts 1.14 in June 2027, 1.16 in September and 1.17 in December, following its December 2026 and March 2027 forecasts of 1.13.
The immediate test is whether cheaper oil can loosen the Dollar’s grip before those longer-term recovery forecasts come into view.
ING noted on Friday that cheaper oil had slowed the Dollar’s post-Fed advance, but doubted that prospective talks between President Trump and Gulf leaders would deliver sufficient relief:
“Even so, we do not see these developments as enough to take Brent back below $100/bbl at this stage.”
Our currency coverage draws on live market data, official economic releases and published bank research.
Rabobank’s three-month FX forecast puts the US Dollar to Yen exchange rate (USD/JPY) at 154.00, below Friday’s close near 156.88 after a week of solid US Dollar gains.
Dollar to Yen (USD/JPY): 156.88243 (+0.46%)
Pound to Dollar (GBP/USD): 1.339468 (+0.29%)
The forecast was set before Friday’s Bank of Japan decision, when the bank warned that an expected hike might fail to satisfy Yen buyers.
“While profit-taking on fresh long JPY positions cannot be ruled out following the BoJ meeting tomorrow, we are optimistic that the economic reforms in Japan can help sustain USD/JPY around current levels in the coming months. Our 3-month USD/JPY forecast is 154.00.”
The subsequent move has made that target more demanding: the pair rose 0.46% on Friday and 2.19% over the week, leaving 154 around 1.8% below its close.
Japan’s central bank voted 7-2 to raise its policy rate to 1.25%, effective from 24 September.
Governor Kazuo Ueda nevertheless said: “We don’t assume a specific pace for further interest rate hikes.”
That caution matched the vulnerability Rabobank had identified, while the Federal Reserve’s rate increase added a competing source of support for the Dollar.

Rabobank argues that Japan’s recovery has become strong enough to support tightening without requiring an immediate acceleration in rate rises.
“Greater evidence of domestically generated inflation stemming from real wage data, a resilient economy aided by corporate Japan’s involvement in the semi-conductor supply chain and stock market reforms are all JPY supportive factors.”
The bank highlighted July’s 2.4% annual increase in real cash earnings as evidence that stronger pay is supporting Japan’s escape from decades of weak inflation.
For the 154 forecast to work, that domestic improvement must translate into renewed demand for the Yen despite higher US rates.
Friday’s reaction illustrates the risk: delivering a widely expected hike offers limited currency support when investors want reassurance about the next one.
Our currency coverage draws on live market data, official economic releases and published bank research.
Therefore, the rise in nominal yields reflects high real returns and persistent inflation concerns. These yields attract capital to the United States. They also raise borrowing costs elsewhere and reduce the appeal of expensive equity valuations.
Other central banks of the developed nations also face inflation pressure. The ECB raised the deposit rate to 2.50% and the refinancing rate to 2.65%. It expects inflation of 3.0% in 2026 but growth of only 0.9%. The BoE took a different approach. It held the interest rate at 3.75% by 6-3 vote. The three dissenters wanted an increase to 4.00%.
UK inflation was 3.1% in August and the bank warned that another energy shock could push the inflation above 4% in early 2027. These figures explain why both banks are cautious despite the weaker growth.
Asia presents more divided picture. The Bank of Japan raised the overnight rate to 1.25% on September 18 as energy prices, wages and yen weakness increased the risk of inflation. Australia has held the rate at 4.35% after several increases in 2026.
China has kept the one-year loan prime rate at 3.00% while consumer inflation was only 0.8% in August. This is selective global tightening phase rather than synchronized hiking cycle. A stronger dollar will limit how quickly many countries can cut rates because weaker currencies raise the costs of imports and energy.
– Written by
Frank Davies
STORY LINK Pound-to-Dollar Forecast: Fed Rate Hike Pushes GBP/USD to 7-Week Lows
The Pound to Dollar exchange rate (GBP/USD) fell to seven-week lows around 1.3365 after contrasting Federal Reserve and Bank of England decisions strengthened the Dollar’s interest-rate advantage.
The Fed raised rates and signalled that further tightening remains likely, while the BoE held at 3.75%, leaving Sterling under pressure despite stronger-than-expected UK retail sales.
The Pound to Dollar (GBP/USD) exchange rate remained under pressure at the end of the week after contrasting policy signals from the Federal Reserve and Bank of England.
GBP/USD slumped to seven-week lows around 1.3365 before recovering modestly towards 1.3370 on Friday.
The Federal Reserve raised interest rates and signalled that further tightening is likely, while the Bank of England held rates at 3.75% despite growing inflation risks.
The contrasting policy stance helped strengthen the Dollar and left Sterling struggling to recover.
Get better rates and lower fees on your next international money transfer.
Compare TorFX with top UK banks in seconds and see how much you could save.
UoB commented; “We will maintain our negative view as long as GBP holds below the ‘strong resistance’ at 1.3460.”
Scotiabank noted immediate support around 1.3350 and added; “We see additional support in the 1.3300/1.3320 area.”
The Federal Reserve increased benchmark interest rates by 25 basis points to 3.75%-4.00% on Wednesday, in line with market expectations.
The decision was unanimous, while the updated dot plot showed that 16 of 18 policymakers expect at least one further rate increase before the end of 2026.
Fed Chair Kevin Warsh also struck a broadly hawkish tone, stressing that the economy remains close to full employment and allowing policymakers to focus more heavily on persistent inflation pressures.
He avoided explicit forward guidance, but the updated projections reinforced expectations that further tightening remains likely.

ING is less convinced that the Fed will deliver a sustained series of hikes; “Ordinarily the assumption is that if the Fed hikes, they don’t move just once, and indeed their forecast table does have a further hike pencilled in. However, this time around we think it may end up being a one-off.”
The bank added; “We think risks are more balanced for USD now that the monetary policy boost has been absorbed, but they remain tilted to the upside in the near term.”
ING expects markets to continue pricing the possibility of another hike, with high oil prices and reduced concerns over Dollar debasement providing additional support.
MUFG also expects one further Fed hike, but sees limits to Dollar upside; “The US dollar gains ahead should also be curtailed by the fact that other central banks are set to turn more active in hiking rates as well.”
The Bank of England kept rates unchanged at 3.75% on Thursday, in line with expectations.
The Monetary Policy Committee again voted 6-3 to hold, with Catherine Mann, Megan Greene and Huw Pill supporting an immediate increase to 4.0%.
Governor Andrew Bailey warned that rates could still need to rise if elevated energy prices persist and evidence emerges of stronger second-round inflation effects.
The Bank also said inflation could rise above 4% early next year if energy pressures remain intense.
Markets continue to see a meaningful chance of a November hike, but expectations for a more aggressive tightening cycle eased following the meeting.
Friday’s stronger UK retail sales provided Sterling with some support, with volumes rising 0.5% in August compared with expectations for a 0.2% decline.
The data reinforced signs that the UK economy remains relatively resilient and increased pressure on the BoE to retain a tightening bias.
Markets now price roughly a 65% chance of a November rate increase.
For GBP/USD, the 1.3350 area remains the immediate support level.
A sustained break below this region would expose 1.3300-1.3320, while Sterling would need to recover above 1.3460 to materially improve the short-term technical outlook.
International Money Transfer? Ask our resident FX expert a money transfer question or try John’s new, free, no-obligation personal service! ,where he helps every step of the way,
ensuring you get the best exchange rates on your currency requirements.
TAGS: Pound Dollar Forecasts
Domestic coffee prices
Today (September 20), the coffee market ended the price reduction week, currently the purchase price fluctuates in the range of 93,000 – 93,800 VND/kg, down from 1,500-1,700 VND/kg compared to the price range of the previous week. The average purchase price of coffee in the Central Highlands provinces today is 93,700 VND/kg, down 1,500 VND/kg.
The old Dak Nong area is still the province with the highest coffee purchasing price in the Central Highlands region, the difference with the average price is about 100 VND/kg. Compared to the closing price last weekend, the coffee price in this area decreased by 1,200 VND/kg, launched to the market at a price of 93,800 VND/kg.
In Dak Lak and Gia Lai, coffee prices both decreased by 1,100 VND/kg, down to 93,600 VND/kg.
Similarly, Lam Dong also decreased by 1,600 VND/kg, currently trading at a price of 93,000 VND/kg.
World coffee prices
On the London and New York exchanges, the coffee market had a week of price slippage on all terms.
On the online trading floor Robusta, the September 2026 futures contract on the London exchange was traded at 3,361 USD/ton, down 134 USD/ton compared to the previous closing session. The November 2026 contract decreased by 134 USD/ton, to 3,391 USD/ton.
On the New York Stock Exchange, Arabica coffee futures for March 2027 delivery were listed at 268.55 US cents/lb. December 2026 delivery contracts fell 11 cents/lb, reaching 276.5 US cents/lb.
Market outlook
According to the Vietnam Coffee – Cocoa Association (Vicofa), coffee exports in the last months of 2026 are expected to continue to maintain positive momentum. Production for the whole year 2026 is estimated to increase by about 8 – 10% compared to 2025, thanks to additional supply from the new crop year harvested in November.
In order to cope with price reduction pressure as global supply increases, the industry is shifting to focusing on increasing value instead of chasing output.
The coffee market is still under pressure due to increased Arabica inventories on the ICE exchange, Brazil’s exports being boosted and favorable weather conditions in Brazil as well as Vietnam.
At 8 a.m. Eastern Time today, oil was priced at $104.33 per barrel with Brent serving as the benchmark (we’ll explain different benchmarks later in this article). That’s a gain of 35 cents compared with yesterday morning and around $37 higher than the price one year ago.
It’s impossible to forecast oil prices with detailed precision. Many different elements affect the market, but ultimately it boils down to supply and demand. When worries about economic recession, war, and other large-scale disruptions increase, oil’s path can shift fast.
Gas prices at the pump don’t only track crude oil. They also include what it takes to refine and move that fuel, the taxes layered on top, and the extra markup your local station adds to stay in business.
Since crude oil generally makes up a majority of the per-gallon cost, changes in its price have an outsized impact. When oil surges, gas prices typically rise in tandem. But when oil retreats, gas prices often lag on the way down, a trend sometimes described as “rockets and feathers.”
In case of emergency, the U.S. has a store of crude oil known as the Strategic Petroleum Reserve. Its primary purpose is energy security in case of disaster (think sanctions, severe storm damage, even war). But it can also go a long way toward softening crippling price hikes during supply shocks.
It’s not a long-term answer and is more meant to provide temporary relief, assisting consumers and keeping critical parts of the economy running, like key industries, emergency services, public transportation, etc.
Both oil and natural gas are key sources of the energy we use every day. Because of this, a big change in oil prices can affect natural gas. For example, if oil prices increase, some industries may swap natural gas for some segments of their operations where possible, which increases demand for natural gas.
To gauge oil’s performance, we often turn to two benchmarks:
Between these two, Brent better represents global oil performance because it prices much of the world’s traded crude. And, it’s often the best way to track historical oil performance. In fact, even the U.S. Energy Information Administration now uses Brent as its primary reference in its Annual Energy Outlook.
Looking at the Brent benchmark across several decades, oil has been anything but steady. It’s seen spikes due to factors such as wars and supply cuts, and it’s also seen crashes from global recessions and an oversupply (called a “glut”). For example:
All to say, oil’s historical performance has been anything but smooth. Again, it’s hugely affected by wars, recessions, OPEC whims, evolving energy initiatives and policies, and much more.
Looking to stay up-to-date regarding the latest energy developments? Check out our recent coverage:
The current price of oil per barrel depends largely on supply and demand, including news about potential future supply and demand (geopolitics, decisions made by OPEC+, etc.). In the U.S., prices also move based on how friendly an administration is to drilling, as it can affect future supply. For example, 2025 saw the Trump administration move to reopen more than 1.5 million acres in the Coastal Plain of the Arctic National Wildlife Refuge for oil and gas leasing, reversing the Biden administration’s policy of limiting oil drilling in the Arctic.
The price of oil updates constantly when the “futures” markets are open. A futures market is effectively an auction where people agree to buy or sell oil in the future. As long as people and companies are trading contracts, the oil price is changing.
In short, shale is rock that contains oil and natural gas. Think of shale as energy yet to be tapped. The more shale the U.S. accesses, the more energy we’ll have—and the more easily oil prices can keep from spiking as much thanks to a greater supply.
When oil is expensive, it tends to make everyday items cost more. This can be related to energy (your heating, gas utilities, etc.), but it’s also due to the logistics involved with making those items accessible to you. Shipping, for example, can affect the price of things at the grocery store, as it’s more expensive to get those products from warehouses and farms onto the shelf.
The article covers the following subjects:
Consider long positions from corrections above 90.60 with a target of 115.50–125.50.
Breakout and consolidation below 90.60 will allow the asset to continue declining to the levels of 79.30–67.00.
On the weekly chart, a descending correction has likely finished developing as the second wave of larger degree (2) and an ascending third wave (3) is forming. On the daily chart, apparently, the first wave of smaller degree 1 of (3) has formed, a local correction has been completed as wave 2 of (3), and the third wave 3 of (3) is unfolding. Wave i of 3 is developing on the H4 chart; within it, wave (iii) of i is still unfolding. If the presumption is correct, WTI will continue to rise to 115.50–125.50. The level of 90.60 is critical in this scenario as a breakout below it will enable the asset to continue declining to the levels of 79.30–67.00.
This forecast is based on the Elliott Wave Theory. When developing trading strategies, it is essential to consider fundamental factors, as the market situation can change at any time.
The content of this article reflects the author’s opinion and does not necessarily reflect the official position of LiteFinance broker. The material published on this page is provided for informational purposes only and should not be considered as the provision of investment advice for the purposes of Directive 2014/65/EU.
According to copyright law, this article is considered intellectual property, which includes a prohibition on copying and distributing it without consent.