The main category of All News Articles.
You can use the search box below to find what you need.
[wd_asp id=1]
The main category of All News Articles.
You can use the search box below to find what you need.
[wd_asp id=1]
The China coffee market in 2026 stands at an inflection point: per-capita consumption, though still a fraction of that in the United States or Japan (estimated at 0.2-0.3 kg per person annually versus 4-5 kg in developed markets), is growing at a sustained 8-12% per year, underpinned by urbanization, rising disposable incomes, and a deepening coffee-drinking culture. The market spans instant/soluble products (the legacy volume leader), roast-and-ground coffee, whole beans, single-serve pods and capsules, and a fast-expanding ready-to-drink segment.
Demand is bifurcated by channel: at-home consumption (retail packaged coffee) and out-of-home consumption (cafés, offices, foodservice). The total addressable market in value terms is not published here, but retail packaged coffee exceeds take-home food spending growth by a factor of two to three, while the café segment has seen the most visible brand competition. Structural drivers—younger demographics, coffee as a social and lifestyle marker, and the influence of global coffee chains—favor continued expansion, though supply-side constraints (import dependence, green-bean cost, and freshness logistics) remain persistent.
Between 2026 and 2035, the China coffee market is expected to expand at a compound annual growth rate in volume of 7-10%, with value growth likely running 1-2 percentage points higher due to premiumization. The primary growth engine is the shift from instant to fresh-ground and pod formats, which carry higher unit prices. Within the retail segment, single-serve pods and capsules are the fastest-growing format, projected to more than double in volume by 2035, while instant coffee volume growth slows to the low single digits.
Out-of-home coffee consumption—particularly through café chains and convenience stores—is growing at 12-15% annually, driven by store expansion into lower-tier cities. The private-label segment (supermarket own brands and e-commerce store brands) is capturing volume from mainstream national brands, growing at 10-13% per year as retailers seek margin-rich categories. Import volumes are forecast to increase at a similar pace, potentially surpassing 300,000 tonnes annually by the early 2030s, assuming no major trade-policy disruptions.
Overall, the market’s growth trajectory resembles that of South Korea in the late 2000s—rapid adoption, format diversification, and premiumization—suggesting sustained double-digit growth for at least the first half of the forecast horizon.
Instant/soluble coffee still commands the largest share of retail volume (40-50%), but its share is declining by roughly 1-2 percentage points per year as consumers trade up to roast-and-ground and whole-bean products. Fresh coffee (ground and whole bean) accounts for 20-25% of retail volume and is growing at 10-14% annually, driven by the at-home espresso culture and growth in manual brewing methods (pour-over, French press).
Single-serve pods and capsules represent 5-8% of retail volume but 15-20% of retail value, with unit growth of 15-20% per year; pod adoption is highest in tier-1 cities among households with higher disposable incomes and limited time for brewing. Out-of-home consumption splits into two main end uses: the café/foodservice channel accounts for an estimated 25-30% of total coffee volume, while office/workplace coffee services (vending, managed coffee programs) contribute another 5-8%. The convenience-store RTD segment, though small in volume (<5%), is growing rapidly (15-18% CAGR) by catering to on-the-go consumption.
By buyer group, household shoppers drive roughly 55-60% of retail volume, with e-commerce consumers increasingly dominant (over 40% of retail sales). Procurement managers in HoReCa and offices are the primary buyers for out-of-home channels, prioritizing price stability, delivery frequency, and branded recognition.
China’s coffee pricing is layered across four tiers: commodity/private-label entry (CNY 60-100 per kg for instant or bagged ground coffee), mainstream national brands (CNY 100-250 per kg), premium/specialty roasters (CNY 250-500 per kg), and super-premium single-origin or rare-lot coffees (CNY 500-1,000+ per kg). The primary cost driver is the international green-bean price, which for arabica has ranged from USD 3-5 per kg (farm-gate) in recent years, with volatility driven by weather events in Brazil, Colombia, and East Africa.
Import costs add 8-15% through tariffs (depending on origin and HS code: 090121 for roasted, not decaffeinated; 090122 for decaf; 090190 for other roasted coffee), plus logistics and warehousing. Domestic roasting and packaging costs are competitive, though premium packaging (nitrogen-flush valved bags, single-serve capsules) adds CNY 10-30 per kg. Labor costs in urban roasting facilities have risen 5-8% annually, but automation in roasting profile control and packaging lines is moderating that pressure. Private-label and value-tier brands face the tightest margins, with input-cost pass-through limited by retailer pricing power.
Premium and specialty roasters can absorb moderate cost fluctuations through brand loyalty and higher unit prices. Overall, retail coffee prices in China have been rising 3-6% per year, reflecting quality upgrading and cost-push factors.
The competitive landscape is dominated by global brand owners (Nestlé, Starbucks, JDE Peet’s, illy, Lavazza) that control the majority of branded premium and mainstream segments. Nestlé’s portfolio—Nescafé for instant, Nespresso and Starbucks by Nespresso for pods, and Nescafé Dolce Gusto—gives it a commanding multi-format position. Chinese domestic challengers, notably Luckin Coffee (now operating a large retail pod line and fresh-brew café network), Manner, and Seesaw, are strong in the out-of-home specialty segment and have launched private-label-style retail offerings.
Value and private-label specialists (e.g., supermarket chains like Hema, RT-Mart, and e-commerce platforms’ own brands) compete aggressively on price (CNY 60-120 per kg) and are expanding their coffee assortment. The single-serve system proprietors (Nespresso system, Keurig-compatible brands, and Chinese proprietary systems like the ones from Xiaomi-backed roasters) create a dual structure: high-margin proprietary pods and a growing market for compatible third-party pods.
DTC and e-commerce native brands (e.g., Yunnan-based roasters, specialty subscription services) are carving out niches through sustainability claims, traceability, and direct relationship with the consumer. Competition is intensifying in the medium-term as private-label quality improves and as Chinese roasters develop origin-relationships in Yunnan and Vietnam to reduce import dependency.
China has a small but established coffee-growing region in Yunnan Province, which accounts for an estimated 98% of national arabica and robusta output, with smaller volumes in Hainan and Fujian. Domestic production in 2025-2026 is estimated at 100,000-130,000 tonnes of green beans, of which roughly half meets specialty-grade (80+ SCA) standards; the rest is commercial-grade robusta. Yunnan’s coffee farms are fragmented (average plot <1 hectare) and face challenges with processing consistency, water scarcity, and aging trees, though government initiatives are promoting varietal improvement and centralized wet-milling to raise quality.
Local production supplies mainly the domestic instant coffee industry (Nestlé sources some Yunnan beans for Nescafé) and a growing number of domestic specialty roasters. However, domestic beans cover only 10-15% of total consumption; the remainder must be imported. The supply model is therefore import-led: global green-bean traders, large roasters, and importers maintain warehousing in Shanghai, Guangzhou, and Tianjin, where beans are stored, roasted, and packaged before distribution. Roasting capacity is concentrated in these coastal hubs and in Chengdu, with many mid-sized roasters operating at 50-70% utilization.
Freshness logistics (nitrogen-flush packaging, controlled-temperature warehousing) are critical for the premium segment, where shelf life is 12-18 months for whole beans and 8-12 months for ground. The domestic supply chain is improving but still faces constraints in cold-chain coverage beyond tier-2 cities.
China is a net importer of coffee, with imports roughly 85-90% of total consumption. In 2025, import volumes are estimated at 250,000-300,000 tonnes (green beans, roasted, and instant combined), with the value exceeding USD 1.5-2 billion at CIF prices. The primary origins are Vietnam (robusta, accounting for 40-50% of volume), Brazil (arabica, 20-25%), and Colombia, Ethiopia, and Indonesia (combined 15-20%). Roasted coffee (HS 090121/090122) imports are smaller in volume (perhaps 15-20% of total coffee imports) but higher in value, reflecting premium branding and convenience.
China also re-exports a negligible volume—under 10,000 tonnes annually, mostly specialty lots to Taiwan, Hong Kong, and Japan. Tariff treatment varies: green beans from most producing countries attract 0-8% duty under most-favored-nation rates, while roasted coffee (090121) faces higher duties (8-15%) plus a 13% VAT. Preferential rates exist under the ASEAN-China Free Trade Agreement for Vietnamese and Indonesian beans (0% tariff for green beans). Import patterns are two-way: instant coffee exports (mostly Nescafé production in China) go to Southeast Asia and the Middle East, but the value is small relative to imports.
Trade logistics are efficient, with major ports handling containerized green-bean shipments and bonded warehouses allowing duty-deferred storage for roasting prior to domestic sale. Currency fluctuations (CNY versus USD/BRL/VND) directly affect landed costs, and importers typically hedge 6-12 months forward.
Packaged coffee distribution in China flows through three primary routes. First, mainstream retail: hypermarkets, supermarkets, and grocery chains (e.g., Walmart, Carrefour, Yonghui, Lianhua) account for 25-30% of retail sales by value, with private-label and national-brand coffee placed in both shelf and end-aisle displays. Second, e-commerce and subscription platforms (Tmall, JD.com, Douyin, Pinduoduo) command 35-45% of retail packaged coffee sales, with a high proportion of imported specialty and pod sales; subscription models are growing rapidly for whole-bean and ground coffee.
Third, specialty coffee shops and HoReCa (cafés, hotels, restaurants, office catering) represent 30-40% of total coffee volume (including out-of-home consumption), with procurement managed through foodservice distributors, direct contracts with roasters, and bulk purchasing programs.
Buyer groups differ: household shoppers (55-60% of retail volume) are increasingly digital-savvy, influenced by reviews, sustainability claims, and price comparisons; procurement managers in HoReCa prioritize consistency, delivery lead times (1-3 days in tier-1 cities, longer elsewhere), and cost stability; office coffee service managers look for vending-compatible formats and branded servicing. The distribution landscape is fragmented below the national level, with regional wholesalers and distributors servicing thousands of small café operators in secondary cities.
E-commerce is partially bypassing traditional wholesalers for DTC brands, reducing intermediary margins but raising last-mile delivery costs for fresh coffee.
The regulatory framework for coffee in China is primarily governed by the Food Safety Law and its implementing standards (GB 2762 for contaminants, GB 5009 for testing methods) and the National Food Safety Standard for Coffee Products (GB/T 29602). Imported coffee must comply with Chinese labeling regulations in Chinese, including net content, origin, roasting date, and shelf life, plus meet maximum residue limits for pesticides. Organic certification follows China’s organic standard (GB/T 19630), and imported organic products must be certified by approved bodies—a process that adds 6-12 months for foreign roasters.
Fair Trade certification is recognized but not mandatory; however, it is increasingly used in premium marketing. Single-serve pod recycling and extended producer responsibility (EPR) schemes are nascent: China has no national mandate for capsule recycling, but pilot programs in Shanghai and Shenzhen require brands to provide recovery channels; Nespresso and Starbucks have voluntarily launched recycling collection points, but overall recovery rates remain below 10%.
Import tariffs are structured by HS code: green beans (090111) face 0-8% MFN duty; roasted coffee (090121) generally 8% duty plus 13% VAT; instant coffee (210111) 15% duty plus VAT. Anti-dumping duties are not currently in place, though phytosanitary inspections can delay shipments. Labeling rules are strict on health claims—no functional or therapeutic claims are permitted without approval, which limits differentiation for functional coffee (e.g., mushroom-infused, collagen). The overall regulatory environment is stable but gradually tightening, particularly around pesticide residue limits and single-use plastic packaging.
Over the 2026-2035 period, China’s coffee market is forecast to continue its structural growth, driven by urbanization, rising middle-class spending on quality food, and the deepening of coffee culture beyond tier-1 cities into tier-2 and tier-3 centers. Total retail volume (packaged coffee) is expected to increase at a CAGR of 7-9%, with the value growing 8-11% due to product mix improvement. Single-serve pods and capsules are projected to triple in volume by 2035, surpassing instant coffee as the largest retail format by value around 2030-2032.
Out-of-home consumption (cafés, offices, foodservice) will grow at 10-12% annually, adding roughly 50,000-70,000 new coffee shops over the decade, particularly in lower-tier cities where per-capita café density is currently low. Import volumes will likely track domestic demand growth, with Vietnam remaining the largest origin for robusta and Brazil/Colombia gaining share in specialty arabica. Domestic production in Yunnan could expand by 30-50% if varietal upgrades succeed, but will still supply less than 20% of total demand.
Private-label penetration is forecast to reach 15-20% of retail volume by 2035, up from 8-10% in 2026, as large retailers and e-commerce platforms invest in quality and branding. The main risks to the forecast are sustained green-bean price spikes (which slow premiumization), trade-policy disruptions (e.g., increased tariffs, non-tariff barriers), and a potential deceleration in Chinese GDP growth that could compress out-of-home spending. Barring such shocks, the market is on a trajectory to see coffee consumption double from 2025 levels by the early 2030s, approaching per-capita levels seen in Taiwan or South Korea today.
The China coffee market offers several high-potential growth pockets for brand owners, roasters, and investors. First, the private-label opportunity: as retailers expand their own coffee lines (especially whole-bean and ground formats), they seek reliable co-packers and origin-sourcing partners to achieve quality parity with national brands at a 15-25% lower retail price.
Second, the single-serve pod ecosystem: despite patent restrictions, the market for compatible third-party capsules is underdeveloped and holds potential for roasters that can design low-cost, recyclable pods meeting Chinese labeling and safety standards, especially for the growing office and hotel segment. Third, DTC subscription models for fresh-roasted coffee: with e-commerce penetration already high, there is room for brands that offer personalized blending, micro-lot discovery, and direct farmer-connection stories to build loyalty among the 80 million young urban coffee drinkers.
Fourth, sustainability and traceability: Chinese consumers (especially Gen Z and millennials) increasingly value environmental claims—carbon-neutral roasting, compostable packaging, and direct-trade relationships—providing differentiation for premium roasters willing to invest in certification and transparent supply chains. Fifth, lower-tier city expansion: as disposable incomes rise in cities of 1-5 million residents, there is a gap in affordable specialty coffee options, both for retail bags and for café formats. Brands that can offer a value-priced specialty experience (CNY 15-25 per cup) will capture early-mover advantage.
Finally, functional and ready-to-drink innovations (cold-brew, nitrogen-infused, coffee-plus-functional-ingredients) cater to the convenience-seeking consumer and can be distributed through convenience stores and vending machines, a channel that is expanding rapidly in Chinese railway stations, airports, and office buildings.
This report is an independent strategic category study of the market for Coffee in China. It is designed for brand owners, general managers, category leaders, trade-marketing teams, e-commerce teams, retail partners, distributors, investors, and market entrants that need a clear read on where growth sits, which brands control the category, how pricing and promotion shape demand, and which channels matter most for scale and margin.
The framework is built for consumer goods category markets within consumer goods, where performance is driven by need states, shopper missions, brand hierarchies, price-pack architecture, retail execution, promotional intensity, and route-to-market control rather than by a narrow technical specification alone. It defines Coffee as Roasted coffee beans, ground coffee, and single-serve formats (pods/capsules) for at-home and out-of-home consumption, excluding ready-to-drink (RTD) beverages and unroasted green coffee and maps the market through category boundaries, consumer segments, usage occasions, channel structure, brand and private-label positions, supply and availability logic, pricing and promotion mechanics, and country-level commercial roles. Historical analysis typically covers 2012 to 2025, with forward-looking scenarios through 2035.
This report is designed to answer the questions that matter most to brand, category, channel, and strategy teams in consumer-goods markets.
At its core, this report explains how the market for Coffee actually works as a consumer category. It is built to show where demand comes from, which need states and shopper missions matter most, which brands and private-label players shape the category, which channels control visibility and conversion, and where pricing power, repeat purchase, and margin are actually created.
Rather than framing the category through narrow technical attributes, the study breaks it into decision-grade commercial layers: product format, benefit platform, shopper segment, purchase occasion, pack-price architecture, channel environment, promotional intensity, route-to-market control, and company archetype. It is therefore useful both for teams shaping portfolio strategy and for teams executing growth through Household Shopper, Procurement Manager (Office/HoReCa), Retail Buyer (Grocery/Specialty), and E-commerce Consumer.
The report also clarifies how value pools differ across Brewed coffee, Espresso-based drinks, Filter coffee, and Cold brew preparation, how premiumization and private label reshape category economics, how retail concentration and route-to-market design affect scale, and which countries matter most for brand building, sourcing, packaging, and channel expansion.
The report is based on an independent market-intelligence methodology that combines category reconstruction, public company evidence, retail and channel mapping, pricing review, and multi-layer triangulation. It is built for consumer categories where no single public dataset captures the real structure of demand, brand power, promotion, and channel control.
The evidence stack typically combines company disclosures, investor materials, brand and retailer product pages, e-commerce assortment checks, packaging and claims analysis, public pricing references, trade statistics where relevant, regulatory and labeling guidance, and observable route-to-market evidence from distributors, retailers, merchandisers, and marketplace ecosystems.
The analytical model then reconstructs the category across the layers that matter commercially: category scope, shopper need states, consumer segments, pack-price ladders, brand and private-label hierarchy, channel power, promotional intensity, route-to-market design, and country role differences.
Special attention is given to Daily consumption ritual/habit, Premiumization & specialty trends, Convenience (pods, ground), At-home café experience, Brand perception & loyalty, and Sustainability & ethical sourcing claims. The objective is not only to size the market, but to explain where value pools sit, which segments drive mix and repeat purchase, which channels shape growth, and how leading brands defend or expand their positions across Household Shopper, Procurement Manager (Office/HoReCa), Retail Buyer (Grocery/Specialty), and E-commerce Consumer.
The report does not rely on survey-based opinion as its core evidence base. Instead, it uses observable commercial signals and structured public evidence to build a decision-grade view for brand, category, retail, e-commerce, investment, and market-entry teams.
This report defines Coffee as Roasted coffee beans, ground coffee, and single-serve formats (pods/capsules) for at-home and out-of-home consumption, excluding ready-to-drink (RTD) beverages and unroasted green coffee and treats it as a branded consumer category rather than as a narrow technical product class. The objective is to capture the real commercial market that category, brand, trade-marketing, and channel teams are managing.
Scope is determined by how the category is sold, merchandised, priced, and chosen in market. That means the report follows product formats, claims, price tiers, pack architecture, need states, and retail environments that shape Brewed coffee, Espresso-based drinks, Filter coffee, and Cold brew preparation.
The study deliberately separates the category from adjacent baskets when they distort the economics or shopper logic of the market being measured. Typical exclusions therefore include Ready-to-drink (RTD) coffee beverages, Unroasted green coffee beans (commodity), Coffee shop café sales (service), Coffee-making equipment (machines, grinders), Coffee syrups/flavorings sold separately, Tea, Hot chocolate/cocoa, Energy drinks, Functional beverages, and Coffee creamers/sweeteners.
The report provides focused coverage of the China market and positions China within the wider global consumer-goods industry structure.
The geographic analysis explains local consumer demand conditions, brand and private-label balance, retail concentration, pricing tiers, import dependence, and the country’s strategic role in the wider category.
This study is designed for strategic and commercial users across brand-led consumer categories, including:
In many brand-driven, channel-sensitive, and consumer-demand-led markets, official trade and production statistics are not sufficient on their own to describe the true market. Product boundaries may cut across multiple tariff codes, several product categories may be bundled into the same official classification, and a meaningful share of activity may take place through customized services, captive supply, platform relationships, or technically specialized channels that are not directly visible in standard statistical datasets.
For this reason, the report is designed as a modeled strategic market study. It uses official and public evidence wherever it is reliable and scope-compatible, but it does not force the market into a purely statistical framework when doing so would reduce analytical quality. Instead, it reconstructs the market through the logic of demand, supply, technology, country roles, and company behavior.
This makes the report particularly well suited to products that are innovation-intensive, technically differentiated, capacity-constrained, platform-dependent, or commercially structured around specialized buyer-supplier relationships rather than standardized commodity trade.
The report typically includes:
The GBPJPY pair confirmed its surrender to the bearish corrective trend by providing a new close below 214.50 level, to begin forming bearish waves, achieving the corrective targets by reaching 212.75 level, forcing it to form mixed trading due to the continuation of the main indicators’ contradiction.
The price needs a new bearish momentum to help it renew the bearish attempts, which might target 211.80 and 211.30, while breaching the mentioned barrier and holding above it will cancel the negative scenario, providing chance to begin forming new bullish waves, to expect forming initial positive station at 215.25 level.
The expected trading range for today is between 211.80 and 214.20
Trend forecast: Bearish
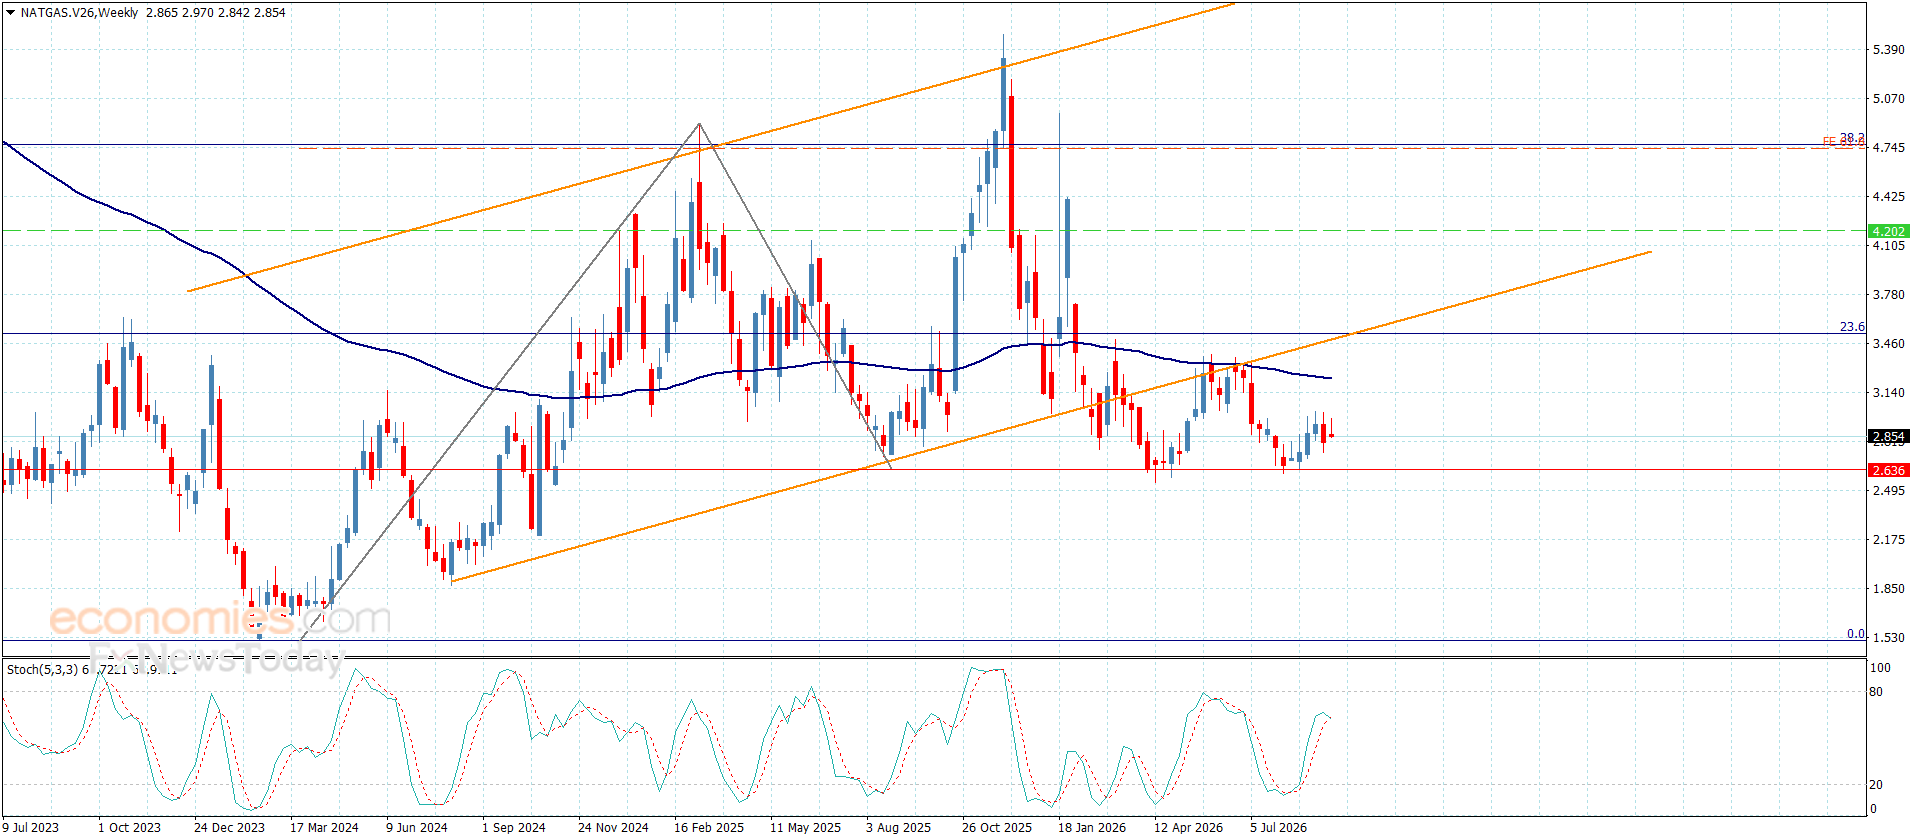
The Natural Gas market has fallen a bit during the trading session here on Tuesday as the 50-day EMA continues to be a massive barrier.
If we do break above there, then we could send this market towards the $3 level, but all things being equal, I think it takes quite a bit of momentum to make that happen.
With that being the case, I believe that most traders will be looking at the Natural gas as a market that you continue to sell anytime you get an opportunity. After all, this is what is known as shoulder season and that of course is the time of year where traders price in the idea of a huge lack of demand. After all, nobody’s really that worried about heating their homes or anything like that.
So, with that being the case, it is a market that will continue to look at each rally as a potential shorting opportunity with the $3 level being a massive ceiling. If we can break above there, then it’s possible that we could go looking at the $3.30 level, but I think something pretty spectacular would have to happen. In fact, we’ve already seen some pushbacks during the day on Tuesday.
I believe that this market could go looking to the $2.60 region, but it’s going to be a grind. Higher interest rates are an effect on most markets, but here in Natural Gas I don’t think so just because there’s so much of it.
With that, anytime this market rallies at the first signs of exhaustion I’m more than willing to start selling. It’s just not a market that lends itself to being very strong anytime soon. With that, I still believe that the $3 level is your ceiling and it’s probably not for a few months where we see air conditioning demand come into the picture that we see Natural Gas rise.
Ready to trade daily Forex forecast? Here’s a list of some of the best commodities brokers to check out.
Christopher Lewis has been trading Forex and has over 20 years experience in financial markets. Chris has been a regular contributor to Daily Forex since the early days of the site. He writes about Forex for several online publications, including FX Empire, Investing.com, and his own site, aptly named The Trader Guy. Chris favours technical analysis methods to identify his trades and likes to trade equity indices and commodities as well as Forex. He favours a longer-term trading style, and his trades often last for days or weeks.
As seen on: Pairs Of Aces Podcast,The Trader Guy, FXEmpire
The GBPJPY pair confirmed its surrender to the bearish corrective trend by providing a new close below 214.50 level, to begin forming bearish waves, achieving the corrective targets by reaching 212.75 level, forcing it to form mixed trading due to the continuation of the main indicators’ contradiction.
The price needs a new bearish momentum to help it renew the bearish attempts, which might target 211.80 and 211.30, while breaching the mentioned barrier and holding above it will cancel the negative scenario, providing chance to begin forming new bullish waves, to expect forming initial positive station at 215.25 level.
The expected trading range for today is between 211.80 and 214.20
Trend forecast: Bearish
Ethereum (ETHUSD) rose in recent intraday trading after holding firmly above the important support level at $2,265, which provided positive momentum and helped the price recover part of its previous losses. At the same time, the market is attempting to unwind oversold conditions shown on the relative strength indicators, despite emerging positive signals.
However, the broader outlook remains pressured, as the price continues to trade below EMA50, limiting the strength and sustainability of any recovery in the near term. This is further reinforced by the breakdown of a short-term ascending trend line, which adds to the negative technical outlook.
GBP/USD retreats by over 0.55% on Tuesday amid political turmoil in the UK, as pressure mounts on Prime Minister Keir Starmer to step aside following cabinet resignations. Technically, the formation of a ‘dark-cloud cover’ suggests further downside if sellers drive the pair below 1.3500.
After consolidating around 1.3600, political pressure pushed GBP/USD lower. The Relative Strength Index (RSI) shows that sellers are gaining momentum, as it points downwards, indicating a potential bearish turn.
For a bearish continuation, sellers must keep GBP/USD below 1.3500. In that outcome, the next support would be the 100-day Simple Moving Average (SMA) at 1.3482, followed by the confluence of the 50- and 200-day SMA near 1.3427/25. On further weakness, the next area of interest would be the 1.3400 mark.
On the flip side, bulls must climb above 1.3550 to challenge the 1.3600 milestone. Above this level, the next area of interest would be the May 8 daily high at 1.3637, followed by key resistance levels 1.3650 and 1.3700.
The table below shows the percentage change of British Pound (GBP) against listed major currencies today. British Pound was the strongest against the Swiss Franc.
| USD | EUR | GBP | JPY | CAD | AUD | NZD | CHF | |
|---|---|---|---|---|---|---|---|---|
| USD | 0.36% | 0.55% | 0.22% | 0.16% | 0.18% | 0.19% | 0.36% | |
| EUR | -0.36% | 0.19% | -0.11% | -0.21% | -0.19% | -0.18% | -0.00% | |
| GBP | -0.55% | -0.19% | -0.30% | -0.41% | -0.38% | -0.36% | -0.19% | |
| JPY | -0.22% | 0.11% | 0.30% | -0.12% | -0.08% | -0.05% | 0.10% | |
| CAD | -0.16% | 0.21% | 0.41% | 0.12% | 0.03% | 0.06% | 0.21% | |
| AUD | -0.18% | 0.19% | 0.38% | 0.08% | -0.03% | 0.02% | 0.19% | |
| NZD | -0.19% | 0.18% | 0.36% | 0.05% | -0.06% | -0.02% | 0.16% | |
| CHF | -0.36% | 0.00% | 0.19% | -0.10% | -0.21% | -0.19% | -0.16% |
The heat map shows percentage changes of major currencies against each other. The base currency is picked from the left column, while the quote currency is picked from the top row. For example, if you pick the British Pound from the left column and move along the horizontal line to the US Dollar, the percentage change displayed in the box will represent GBP (base)/USD (quote).
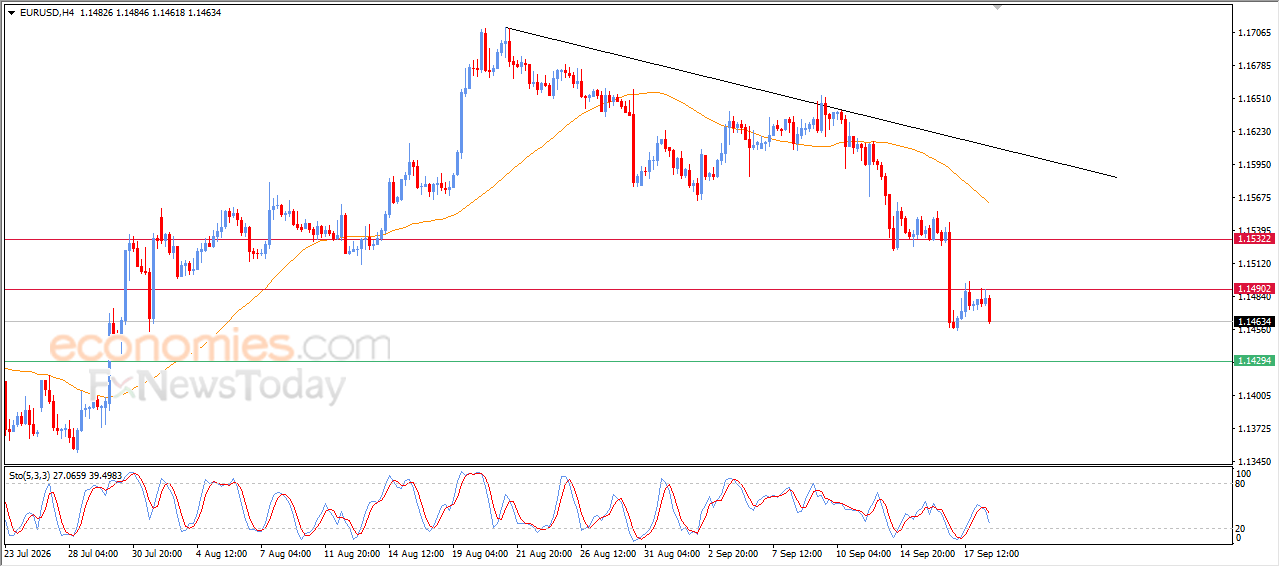
The US dollar has been both positive and negative during the trading session against the Japanese yen, with the 158-yen level looking very much like a bit of a barrier. The 50-day EMA sits right there as well, and if we can break above there, then we can truly take off to the upside.
That being said, I suspect we are still within consolidation between 156 yen on the bottom and 158 yen on the top. Interest rate differential continues to pay you to own dollars, that’s basically what I’m looking at here, but I recognize there is a lot of chop, and of course, the Bank of Japan recently got involved.
The GBPJPY pair continued delaying the negative corrective attempts due to the positive momentum that comes from the main indicators, which forces it to form some bullish waves, approaching near 214.50.
The price might continue providing mixed trading, however the stability below the previously mentioned barrier will increase the efficiency of the bearish corrective trend, to expect targeting 213.30 level, attempting to reach 211.80, while surpassing the barrier and holding above it will support the chances of forming strong bullish waves, to target 215.25 and 216.05.
The expected trading range for today is between 212.80 and 214.50
Trend forecast: Bearish
Despite the weakness of the EURGBP trading, but its stability below the main bearish channel’s resistance at 0.8685 supports the previously suggested negative scenario. The current sideways trading is caused by the contradiction of the main indicators, specifically by stochastic surpass to 50 level as appears in the above image.
We will keep waiting for gathering extra negative momentum to ease the mission of reaching 0.8610 level and surpassing it will make it begin to target more negative stations by reaching 0.8592 and 0.8565, while breaching the resistance and holding above it will cancel the negative scenario, to begin forming strong bullish waves, to expect reaching 0.8710 and 0.8735.
The expected trading range for today is between 0.8595 and 0.8675
Trend forecast: Bearish
Domestic coffee prices
The domestic coffee market this morning – May 12, 2026 – witnessed a spectacular “comeback” after a series of volatile trading days. According to records in key growing areas of the Central Highlands, the price of raw coffee beans has simultaneously rebounded sharply, convincingly regaining the mark of 88,000 VND/kg.
In the Dak Nong (old) area, coffee prices recorded an increase of 1,100 VND, pushing the purchase price to the highest level in the region of 88,200 VND/kg. Dak Lak and Gia Lai provinces both had an increase of 1,000 VND, currently trading stably at the mark of 88,000 VND/kg.
Lam Dong region recorded the strongest increase with 1,200 VND, bringing coffee prices to 87,500 VND/kg. Coupled with this upward momentum, the USD/VND exchange rate at Vietcombank continued to increase by 6 VND, currently listed at 26,099 VND/USD, creating more favorable momentum for export activities.
World coffee prices
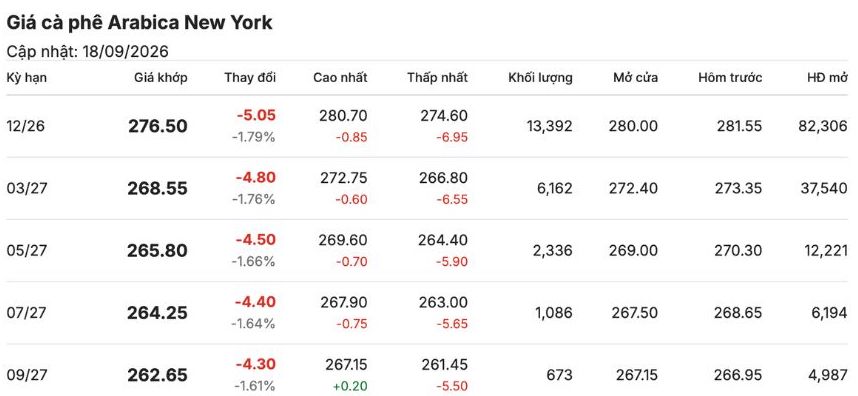
Developments on futures exchanges last night were also brilliantly green as inventory bottomed out, triggering a massive buying wave. On the London exchange, Robusta coffee futures for July surged by 90 USD (equivalent to 2.64%), reaching 3,504 USD/ton, officially setting a 2-week high.
At the same pace, the New York exchange witnessed the price of Arabica for July delivery increase by 7.50 cents (equivalent to 2.73%), closing at 282.30 cents/lb. The fact that both exchanges broke through above 2.5% shows that excitement is covering the global market in the face of short-term supply shortages.
The core reason for this increase came from inventory data monitored by the ICE floor falling to a record low. Robusta inventory as of Monday was only 3,687 lots left, the lowest level in nearly 17 months, while Arabica inventory is also anchored at a 2.5-month low.
In addition, geopolitical tensions in the Middle East are still a “nozzle” for prices as the Hormuz Strait continues to be blockaded. The disruption of this vital sea route not only pushes up freight rates and insurance premiums but also causes fertilizer and fuel prices to escalate, directly putting pressure on the cost of goods sold by international roasters.
In addition, although Brazil forecasts the next crop very well, actual exports in March decreased sharply from 10% to 31%, showing that the actual supply to the market is currently being significantly tightened.
However, experts still issue warnings about the “ghost” of surplus in the long term. Reputable organizations such as StoneX and Marex still maintain forecasts for a global surplus of up to 10 million bags for 2026 when Brazil officially enters a record harvest season with an expected output of 75.9 million bags. Vietnam’s strong export growth in the first 4 months of the year (up 15.8% to 810,000 tons) is also a factor hindering the overheated increase.