The main category of All News Articles.
You can use the search box below to find what you need.
[wd_asp id=1]
The main category of All News Articles.
You can use the search box below to find what you need.
[wd_asp id=1]
Veracity has launched Metabolic Power Protein, a doctor-developed, plant-based protein formulated to support lean muscle development and long-term metabolic health.
Designed for consumers seeking sustained energy, appetite control and metabolic resilience, the product aims to address growing concerns around protein quality, efficacy and safety within the wellness market.
Metabolic Power Protein is enhanced with MyoVera, a patented, clinically studied ingredient from Nutrition21 that has been shown to significantly increase muscle protein synthesis, improving how efficiently the body utilises protein.
“We are excited to partner with Veracity on the first product launch featuring the MyoVera brand,” said Jordan Miller, VP of Marketing at Nutrition21.
“MyoVera helps users get more from their protein intake, delivering clinically backed benefits regardless of lifestyle or fitness goals.”
According to Veracity, the formulation is designed to support the development of lean, metabolically active muscle — a key driver of energy expenditure and metabolic health.
“By helping the body build active muscle more effectively, we’re strengthening the foundation of metabolism itself,” said Dr Gabrielle Francis, Veracity’s Chief Medical Officer.
Beyond performance, Veracity is positioning the product around safety and transparency.
The company highlights ongoing industry concerns around heavy metal contamination in protein powders, citing independent testing that has identified elevated levels of lead, arsenic and cadmium in many popular products.
Metabolic Power Protein undergoes third-party testing and is formulated to meet California Proposition 65 limits for heavy metals and other contaminants.
The launch builds on Veracity’s broader metabolic health platform, which includes Metabolism Ignite, a clinically studied supplement for healthy weight management.
According to the company, Metabolic Power Protein is intended to act as a foundational nutritional component within a wider, science-backed metabolic system.
As protein continues to play a central role in conversations around weight management, strength and longevity, Veracity says the new product reflects a shift towards cleaner formulations that support metabolic health without compromising safety or quality.
Polygon’s POL token is drawing renewed attention as price strength, derivatives activity, and infrastructure development converge. Recent chart action shows a decisive recovery phase after weeks of consolidation.
Besides technical momentum, improving spot flows and new ecosystem tools add context to the market’s near-term outlook. Consequently, traders are reassessing risk as POL tests higher levels near the $0.15 zone.
POL price action on the four-hour chart reflects a clear upward trend. The market advanced sharply from the $0.118 area toward $0.149. This move followed a prolonged sideways phase, which often precedes stronger directional breaks. Significantly, price now trades above key exponential moving averages across short and long periods.
The EMA alignment shows sustained bullish control. The 20-period average continues to act as dynamic support near $0.131. Hence, dips toward this zone may attract buyers if momentum cools. Fibonacci retracement levels also reinforce this structure. The $0.129 and $0.138 zones remain important buffers during any pullback.
However, the Donchian Channel places price above its upper boundary. That condition often signals near-term exhaustion. Consequently, consolidation or a shallow retracement could emerge before another push higher. Resistance remains concentrated near $0.149, which marks the recent swing high.

Futures open interest adds another layer to the narrative. Open interest expanded steadily from mid-summer and peaked near $180 million in early autumn. That phase aligned with stronger speculative appetite. However, October saw rapid deleveraging, which pushed open interest sharply lower.
Since then, derivatives activity stabilized between $55 million and $70 million. Moreover, the recent uptick toward $66 million suggests traders are returning cautiously. Leverage remains restrained compared with previous highs. This structure reduces liquidation risk but also limits explosive upside.
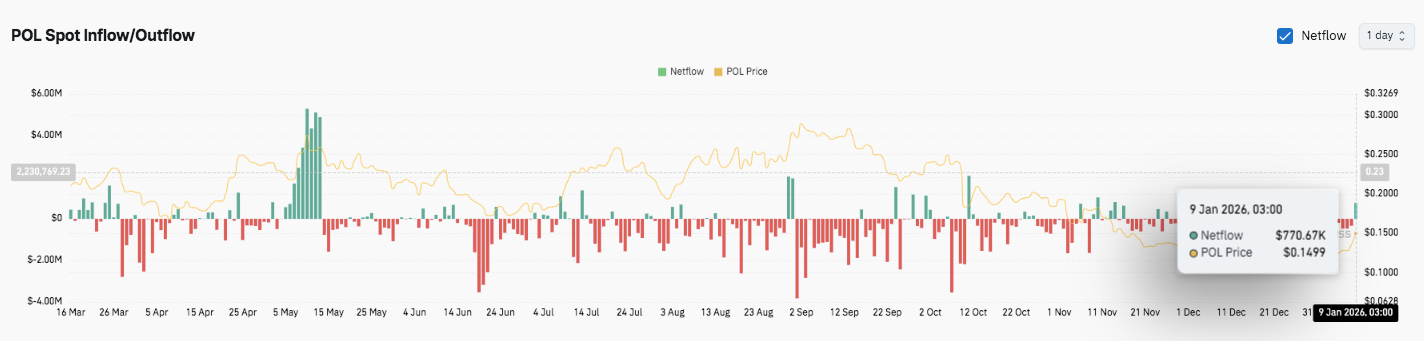
Spot flow data supports this measured shift. Earlier periods showed persistent outflows and sharp sell-side spikes. Additionally, those flows coincided with price weakness. Into late November and December, outflows moderated and netflows moved closer to balance. The latest modest inflow near $770,000 aligns with price stability near $0.15.
Beyond charts, ecosystem progress continues. Polygon Labs recently introduced the Open Money Stack. The initiative focuses on regulated stablecoin payments and cross-border transfers. It combines compliance, wallets, orchestration, and settlement into a unified framework.
Moreover, the stack aims to connect onchain and offchain systems without sacrificing interoperability. Developers can onboard users and integrate payment and yield features more efficiently. Several components already operate through partners, with further releases planned.
Polygon’s POL token continues to trade at a technically sensitive zone, where momentum remains constructive but not yet decisive. Price action on the short-term timeframe shows POL attempting to hold above recent breakout levels near $0.145–$0.149. Consequently, traders are closely monitoring whether buyers can sustain control or if consolidation deepens before the next directional move.
From a structural standpoint, POL appears to be compressing after a sharp impulse move. EMAs remain positively stacked, supporting the broader uptrend. However, price trading near the upper Donchian boundary signals short-term exhaustion risk. Hence, consolidation or a shallow retracement would remain healthy for trend continuation.
Polygon’s short-term outlook depends on whether buyers can defend the $0.138–$0.145 area while pressuring the $0.150 resistance. Technical compression suggests volatility expansion may follow.
If bullish momentum builds alongside improving spot flows, POL could target $0.158 and $0.165 next. However, failure to hold $0.138 risks a reset toward $0.129 or lower. For now, POL trades in a pivotal zone where confirmation will shape the next leg.
Disclaimer: The information presented in this article is for informational and educational purposes only. The article does not constitute financial advice or advice of any kind. Coin Edition is not responsible for any losses incurred as a result of the utilization of content, products, or services mentioned. Readers are advised to exercise caution before taking any action related to the company.
Copper Price is moving higher again, extending its rally as metals head toward a fourth straight weekly gain. The rise reflects a mix of tight global supply, steady demand expectations tied to electrification, and renewed investor interest in base metals. Even as some buyers pull back at record levels, the broader market trend remains positive, keeping Copper Price firmly in focus for traders, manufacturers, and long-term investors.
This latest move comes at a time when copper is no longer just an industrial metal. It is now widely seen as a strategic asset linked to electric vehicles, renewable energy, grid upgrades, and global infrastructure plans. As prices climb, market participants are asking simple but important questions. Why is copper rising now? Who is buying, and where could prices go next?
Let us explore every angle of this story in a clear, easy, and investor-friendly way.
Copper Price traded higher in recent sessions, pushing metals toward their fourth weekly advance in a row. On global exchanges, benchmark copper contracts climbed as investors reacted to a blend of supply constraints and long-term demand optimism.
On the London Metal Exchange, copper prices have hovered near multi-year highs, supported by strong speculative interest and lower visible inventories. Futures markets show that traders are increasingly positioning for further upside, even as short-term profit-taking appears at higher levels.
A market-focused post from FXCMOfficial highlighted the strength of metals and the role of macro trends driving this move:
So what is pushing prices higher week after week? The answer lies in both supply and demand, with a strong dose of sentiment in between.
Copper prices have already climbed sharply over the past year, and yet the rally continues. This may sound surprising, but several forces are working together.
First, global copper supply remains tight. Many major mines are facing lower ore grades, rising costs, and operational challenges. New projects take years to develop, and investment has lagged behind future demand needs.
Second, energy transition demand is growing steadily. Copper is essential for electric vehicles, charging stations, solar panels, wind turbines, and power grids. Each electric car uses roughly three to four times more copper than a traditional vehicle.
Third, financial investors are returning to metals as a hedge against inflation and supply risk. With interest rate expectations stabilizing in key economies, capital is flowing back into commodities.
A widely shared market comment from N_fozz captured this mood among traders watching copper charts closely:
China remains the world’s largest consumer of copper, accounting for more than half of global demand. According to Bloomberg reporting, Chinese industrial buyers have recently stepped back from the market after prices touched record levels. This pause is not unusual.
When prices rise too quickly, fabricators often delay purchases, waiting for pullbacks. However, this does not mean demand has disappeared. It simply shifts in time.
Why does this matter for Copper Price?
Because even with some short-term caution from China, global demand remains strong enough to keep prices supported. Analysts note that inventories in China are not excessive, and any improvement in construction or manufacturing activity could quickly revive buying.
This balance between cautious buyers and tight supply is one reason prices are holding firm instead of collapsing.
Looking ahead, many banks and research firms expect the Copper Price to remain elevated over the medium to long term. Forecasts vary, but several credible projections suggest copper could trade between nine thousand five hundred dollars and eleven thousand dollars per tonne over the next one to three years.
Some longer-term outlooks even point to higher levels later in the decade if supply fails to keep pace with demand from electrification and digital infrastructure.
Why are forecasts so optimistic?
Because copper demand is not just cyclical anymore. It is structural.
Power grids need upgrades. Renewable energy capacity is expanding. Electric vehicles are gaining market share. All of this requires copper.
This is why copper has become part of many AI Stock research frameworks, where analysts link metal demand to data centers, automation, and smart infrastructure growth.
One of the strongest signals supporting copper prices is low inventory levels. Stocks tracked by major exchanges remain near historically tight ranges relative to global consumption.
Low inventories mean that even small supply disruptions can push prices higher. Weather issues, labor strikes, or transport problems can all have outsized effects in such an environment.
This tightness also encourages financial players to stay long, reinforcing price momentum.
Technical analysts point to several key levels shaping short-term Copper Price action. Support zones are forming near recent breakout levels, while resistance sits close to record highs.
Momentum indicators suggest that while prices may pause or consolidate, the broader trend remains upward. This is why many short-term traders are using advanced trading tools to manage risk while staying exposed to the upside.
A technical-focused post from Share_Talk added to this discussion by highlighting copper’s chart strength:
Copper is not moving alone. Aluminum, nickel, and zinc have also shown strength, suggesting a broader metals rally rather than an isolated move. This adds confidence to the copper story, as cross-metal support often signals healthy demand expectations.
At the same time, copper remains the bellwether. When copper rises, it often reflects optimism about global growth and infrastructure spending.
For investors, rising Copper Price levels create both opportunity and risk. Mining stocks often benefit from higher prices, especially those with strong balance sheets and low costs. However, valuations can move quickly, so careful analysis is essential.
Some investors are now combining fundamental research with AI stock analysis to better understand supply-demand models and price sensitivity.
For manufacturers, higher copper prices mean higher input costs. This can pressure margins unless costs are passed on to consumers.
This is the big question. While prices are high, many analysts argue that the market is simply pricing in future scarcity. Unlike past cycles, supply growth is limited, and demand drivers are long-lasting.
Could prices pull back in the short term? Yes.
Is the long-term trend still positive? Many believe so.
Copper Price continues to rise as metals head for a fourth straight weekly gain, supported by tight supply, structural demand, and renewed investor interest. Even with some caution from China at record levels, the market remains balanced in a way that favors higher prices over time.
For investors, copper is no longer just an industrial input. It is a strategic metal tied to the future of energy, transport, and technology. As long as supply struggles to keep up, copper prices are likely to stay firm, keeping this metal at the center of global market conversations.
The copper story is not over. In many ways, it is only beginning.
The Copper Price is rising due to tight global supply, low inventories, and strong long-term demand from electric vehicles, renewable energy, and power grid upgrades. Investor interest in metals has also increased.
China has slowed short-term copper buying after prices reached record levels. However, long-term demand remains strong, and buyers usually return when prices stabilize or when inventory needs rise.
Most analysts expect the Copper Price to stay elevated. Forecasts suggest prices could trade between nine thousand five hundred and eleven thousand dollars per tonne if supply remains tight and demand continues to grow.
Low copper inventories mean there is less buffer against supply disruptions. Even small production issues can push prices higher, which helps support strong copper prices in the market.
Copper often performs well during metal rallies because it reflects global economic activity and infrastructure growth. However, investors should consider market volatility and do proper research before investing.
Disclaimer
The content shared by Meyka AI PTY LTD is solely for research and informational purposes. Meyka is not a financial advisory service, and the information provided should not be considered investment or trading advice.
EUR/USD stays on the back foot and trades near 1.1650 after closing in negative territory on Thursday. While investors prepare for the release of the key December employment data from the US, the pair’s technical outlook suggests that the bearish bias stays intact.
The table below shows the percentage change of Euro (EUR) against listed major currencies this week. Euro was the weakest against the Australian Dollar.
| USD | EUR | GBP | JPY | CAD | AUD | NZD | CHF | |
|---|---|---|---|---|---|---|---|---|
| USD | 0.70% | 0.36% | 0.39% | 0.95% | -0.10% | 0.47% | 0.99% | |
| EUR | -0.70% | -0.34% | -0.26% | 0.25% | -0.79% | -0.23% | 0.29% | |
| GBP | -0.36% | 0.34% | -0.02% | 0.60% | -0.45% | 0.11% | 0.63% | |
| JPY | -0.39% | 0.26% | 0.02% | 0.53% | -0.52% | 0.04% | 0.60% | |
| CAD | -0.95% | -0.25% | -0.60% | -0.53% | -0.89% | -0.49% | 0.04% | |
| AUD | 0.10% | 0.79% | 0.45% | 0.52% | 0.89% | 0.57% | 1.10% | |
| NZD | -0.47% | 0.23% | -0.11% | -0.04% | 0.49% | -0.57% | 0.52% | |
| CHF | -0.99% | -0.29% | -0.63% | -0.60% | -0.04% | -1.10% | -0.52% |
The heat map shows percentage changes of major currencies against each other. The base currency is picked from the left column, while the quote currency is picked from the top row. For example, if you pick the Euro from the left column and move along the horizontal line to the US Dollar, the percentage change displayed in the box will represent EUR (base)/USD (quote).
The US Dollar (USD) benefited from the cautious market mood and a modest increase in the US Treasury bond yields on Thursday, causing EUR/USD to stretch lower.
Nonfarm Payrolls (NFP) in the US are forecast to rise by 60,000 in December following the 64,000 increase recorded in November. In this period, the Unemployment Rate is expected to edge lower to 4.5% from 4.6%.
According to the CME FedWatch Tool, markets see a less than 15% chance of a Federal Reserve (Fed) rate cut in January and price in about a 40% probability of a 25 basis points rate cut in March.
A significant positive surprise, with an NFP print of 80,000 or higher, could feed into expectations for two consecutive Fed policy holds in January and March. In this scenario, the USD could preserve its strength heading into the weekend and cause EUR/USD to extend its weekly slide. Conversely, investors could lean toward a rate cut in March and open the door for a recovery in the pair, if the employment report highlights worsening conditions in the labor market, with an uptick in the Unemployment Rate and an NFP reading of 30,000 or lower.
In the 4-hour chart, EUR/USD trades at 1.1647. The 20-period Simple Moving Average (SMA) slopes lower beneath the 50- and 100-period measures, while the pair trades below all four key averages. The 100-period SMA softens and the 200-period one edges higher but remains above spot, maintaining overhead pressure. The Relative Strength Index (RSI) prints 32 (near oversold), signaling bearish momentum. A descending trend line from 1.1801 caps rebounds, with resistance marked at 1.1712.
Measured from the 1.1503 low to the 1.1800 high, the 50% retracement stands at 1.1652 and is being tested as support. A clear break would expose the 61.8% retracement at 1.1617 and 1.1600 (static level), while rebounds could stall beneath the descending trend line as long as the short-term SMAs continue to slope lower.
(The technical analysis of this story was written with the help of an AI tool)
The Euro is the currency for the 20 European Union countries that belong to the Eurozone. It is the second most heavily traded currency in the world behind the US Dollar. In 2022, it accounted for 31% of all foreign exchange transactions, with an average daily turnover of over $2.2 trillion a day.
EUR/USD is the most heavily traded currency pair in the world, accounting for an estimated 30% off all transactions, followed by EUR/JPY (4%), EUR/GBP (3%) and EUR/AUD (2%).
The European Central Bank (ECB) in Frankfurt, Germany, is the reserve bank for the Eurozone. The ECB sets interest rates and manages monetary policy.
The ECB’s primary mandate is to maintain price stability, which means either controlling inflation or stimulating growth. Its primary tool is the raising or lowering of interest rates. Relatively high interest rates – or the expectation of higher rates – will usually benefit the Euro and vice versa.
The ECB Governing Council makes monetary policy decisions at meetings held eight times a year. Decisions are made by heads of the Eurozone national banks and six permanent members, including the President of the ECB, Christine Lagarde.
Eurozone inflation data, measured by the Harmonized Index of Consumer Prices (HICP), is an important econometric for the Euro. If inflation rises more than expected, especially if above the ECB’s 2% target, it obliges the ECB to raise interest rates to bring it back under control.
Relatively high interest rates compared to its counterparts will usually benefit the Euro, as it makes the region more attractive as a place for global investors to park their money.
Data releases gauge the health of the economy and can impact on the Euro. Indicators such as GDP, Manufacturing and Services PMIs, employment, and consumer sentiment surveys can all influence the direction of the single currency.
A strong economy is good for the Euro. Not only does it attract more foreign investment but it may encourage the ECB to put up interest rates, which will directly strengthen the Euro. Otherwise, if economic data is weak, the Euro is likely to fall.
Economic data for the four largest economies in the euro area (Germany, France, Italy and Spain) are especially significant, as they account for 75% of the Eurozone’s economy.
Another significant data release for the Euro is the Trade Balance. This indicator measures the difference between what a country earns from its exports and what it spends on imports over a given period.
If a country produces highly sought after exports then its currency will gain in value purely from the extra demand created from foreign buyers seeking to purchase these goods. Therefore, a positive net Trade Balance strengthens a currency and vice versa for a negative balance.
Alpha Lipoic Acid, Chromium, Cayenne, and Korean Ginseng Capsule Analysis Amid January 2026 Natural Weight Loss Supplement Search Trends
AURORA, COLORADO, Jan. 08, 2026 (GLOBE NEWSWIRE) — Disclaimer: This article is for informational purposes only and does not constitute medical advice. Always consult a qualified healthcare professional before starting any new supplement, especially if you have existing health conditions, take medications, or are pregnant or nursing. This article contains affiliate links. If you purchase through these links, a commission may be earned at no additional cost to you.
AquaFit, a capsule-format dietary supplement marketed in the weight management category, has attracted consumer attention in January 2026 as seasonal patterns in supplement searches often increase during New Year health initiatives. According to the company, the formulation emphasizes a metabolism-focused narrative and thermogenic research references, alongside an ingredient profile described by the company in its published materials.
This report summarizes publicly available label information and published research context; it does not evaluate clinical outcomes or product performance. The manufacturer positions AquaFit around research examining the relationship between metabolic rate patterns in adipose tissue and cellular energy expenditure. The company references a 2019 research discussion published in Scientific Reports associated with circadian regulation in human white adipose tissue that examined how metabolic timing patterns relate to fat cell activity in research settings. The research did not evaluate AquaFit or any dietary supplement and does not establish clinical outcomes.
Consumers researching AquaFit often encounter information about its capsule-based delivery format and ingredient profile described as including nine botanical extracts plus essential minerals.
What AquaFit Is and How the Company Positions the Formula
According to the company, AquaFit is a dietary supplement marketed in a capsule format. In the company’s published materials, the product’s messaging emphasizes thermogenic research references within the broader context of metabolic health discussions.
Thermogenesis is a metabolic process that has been extensively studied for its role in energy expenditure. Research published examining green tea catechins and their effects on 24-hour energy expenditure documented how certain botanical compounds influence metabolic rate in controlled settings. These researchers have no affiliation with AquaFit, but their work contributes to broader scientific discussions around thermogenesis and its relationship to weight management research.
According to the manufacturer, AquaFit contains ingredients selected based on published research examining their potential relationships to metabolic function, glucose utilization, and energy balance. The capsule format is positioned by the company as a convenient delivery method.
AquaFit and the Metabolic Research Narrative
The company references a 2019 research discussion published in Scientific Reports that examined circadian regulation in human white adipose tissue through transcriptome and metabolic network analysis. The research did not evaluate AquaFit or any dietary supplement and does not establish clinical outcomes.
The referenced research examined how fat cells operate on different metabolic cycles throughout the day, with metabolic activity patterns varying based on circadian rhythms. According to coverage in Science Daily, the research suggested that cellular metabolism in adipose tissue may have relationships to timing patterns and hormonal fluctuations. Published research has examined how metabolic rate, nutrient processing, and energy expenditure relate to cellular function in various tissue types.
This research builds on earlier published studies. A 2006 study published in the Journal of the American Dietetic Association examined low-fat dietary patterns and weight change over seven years in the Women’s Health Initiative Dietary Modification Trial. A 2021 study published in the American Journal of Clinical Nutrition examined relationships between dietary factors and body composition. Research published in peer-reviewed literature has examined how various compounds may relate to metabolic function and energy balance.
The metabolism-related hypothesis discussed in published research suggests that certain botanical compounds play roles in thermogenic function by influencing cellular energy pathways. Research has documented that metabolic rate changes with age, which has been associated with various age-related weight management considerations in some populations.
Consumers evaluating AquaFit should understand that the circadian adipose tissue research investigated physiological mechanisms and cellular processes rather than evaluating specific supplement formulations. AquaFit as a complete product has not been subjected to clinical trials. The manufacturer references this research as the conceptual foundation for the formula’s design.
AquaFit Ingredient Profile: Research Context and Formulation Design
According to the company’s published formulation details, AquaFit contains ingredients selected based on published research examining their potential relationships to various biological processes. Consumers researching AquaFit often encounter detailed ingredient information in the manufacturer’s materials.
The product label lists a proprietary botanical blend totaling 276 mg, plus zinc (5.5 mg as zinc gluconate) and chromium (0.05 mg as chromium picolinate). This labeling approach is permitted under current FDA regulations but may limit direct comparison to dosages used in published research. The proprietary blend includes the following components:
Alpha Lipoic Acid
Alpha lipoic acid is a compound produced naturally by the body that functions as a cellular antioxidant and mitochondrial cofactor. Published research has examined alpha lipoic acid for its relationships to various metabolic processes. A systematic review and meta-analysis published in peer-reviewed literature examined alpha lipoic acid’s effects on body weight, finding associations with modest weight reduction in some study populations. A 2012 study published in Obesity Reviews examined the compound’s relationships to energy metabolism and oxidative stress markers. These studies examine isolated compounds or biological mechanisms and do not evaluate AquaFit as a finished dietary supplement.
Green Tea Extract (98% Polyphenols, 80% Catechins, 50% EGCG)
Green tea (Camellia sinensis) extract has extensive documentation in metabolic research. A 1999 study published in the American Journal of Clinical Nutrition examined the efficacy of green tea extract rich in catechin polyphenols and caffeine in increasing 24-hour energy expenditure and fat oxidation in humans. A 2007 study published in Obesity examined a green tea extract high in catechins and its effects on body fat and cardiovascular risks in study participants. A 2013 meta-analysis published in the American Journal of Clinical Nutrition examined the effect of green tea on glucose control and insulin sensitivity across 17 randomized controlled trials. These studies examine isolated compounds or biological mechanisms and do not evaluate AquaFit as a finished dietary supplement.
Milk Thistle Seed Extract (80% Silymarin)
Milk thistle (Silybum marianum) and its active compound silymarin are primarily known for their traditional use in supporting liver function. Published research has examined silymarin for its antioxidant properties and relationships to hepatic metabolism. A 2016 review examined silymarin’s effects on metabolic parameters in various study populations. The liver plays a central role in processing nutrients, metabolizing fats, and regulating blood sugar, which has led researchers to investigate relationships between liver health compounds and metabolic function. These studies examine isolated compounds or biological mechanisms and do not evaluate AquaFit as a finished dietary supplement.
Berberine HCL (97% from Berberis aristata Root)
Berberine is an alkaloid extracted from plants including Berberis aristata that has been used in traditional medicine systems for centuries. Modern research has focused on its potential effects on glucose metabolism and related metabolic markers. A meta-analysis published in peer-reviewed literature examined multiple randomized controlled trials involving berberine supplementation, finding associations with improvements in certain metabolic markers in some study populations. Mechanistic research suggests berberine may influence metabolic function through effects on cellular energy pathways, though the exact mechanisms continue to be studied. These studies examine isolated compounds or biological mechanisms and do not evaluate AquaFit as a finished dietary supplement.
Resveratrol (from Polygonum cuspidatum Root Extract)
Resveratrol is a polyphenol found in grapes, berries, and other plants that has been studied for antioxidant properties and potential effects on cellular metabolism. Published research has examined resveratrol’s relationships to various metabolic processes including energy expenditure and lipid metabolism. A 2015 meta-analysis examined resveratrol supplementation’s effects on metabolic parameters across multiple studies. Research has investigated resveratrol’s potential activation of certain cellular pathways related to energy metabolism. These studies examine isolated compounds or biological mechanisms and do not evaluate AquaFit as a finished dietary supplement.
Cayenne Fruit (40,000 Heat Units)
Cayenne pepper (Capsicum annuum) contains capsaicin, which has been researched for its thermogenic properties. A 2012 study published in Chemical Senses examined capsaicin’s effects on energy expenditure and substrate oxidation. Published research has documented that capsaicin consumption has been associated with temporary increases in metabolic rate through thermogenic mechanisms in some study populations. A 2017 meta-analysis examined capsaicinoid supplementation’s relationships to energy intake and expenditure. These studies examine isolated compounds or biological mechanisms and do not evaluate AquaFit as a finished dietary supplement.
Korean Ginseng (8% Ginsenosides)
Panax ginseng has extensive documentation in traditional practices spanning centuries. A 2013 review published in specialized literature examined research discussions on ginseng’s relationships to various physiological processes including energy metabolism. Published research has examined ginsenosides, the active compounds in ginseng, for potential effects on glucose metabolism and energy balance. A 2014 study examined ginseng’s relationships to fatigue and energy levels in various populations. These studies examine isolated compounds or biological mechanisms and do not evaluate AquaFit as a finished dietary supplement.
Banaba Leaf Extract (2% Corosolic Acid)
Banaba (Lagerstroemia speciosa) is a traditional Asian botanical used for metabolic support. Published research has examined corosolic acid, the primary active compound in banaba, for its potential effects on glucose transport. A 2012 review examined banaba leaf extract’s relationships to blood sugar regulation in various study populations. Research has investigated corosolic acid’s potential influence on cellular glucose uptake mechanisms. These studies examine isolated compounds or biological mechanisms and do not evaluate AquaFit as a finished dietary supplement.
Mineral Components: Zinc and Chromium
According to the company, AquaFit includes two essential minerals. Zinc has been examined in published research for its relationships to various metabolic processes including protein synthesis and enzyme function. A 2013 study examined zinc’s relationships to metabolic markers in various populations. Chromium, particularly as chromium picolinate, has been studied for its involvement in insulin signaling and macronutrient metabolism. According to the National Institutes of Health Office of Dietary Supplements, chromium is involved in the action of insulin, a hormone critical for metabolism and storage of carbohydrate, fat, and protein in the body. A 2017 meta-analysis examined chromium supplementation’s effects on body composition parameters. These studies examine isolated compounds or biological mechanisms and do not evaluate AquaFit as a finished dietary supplement.
Manufacturing and Regulatory Context for AquaFit
According to the company, AquaFit is manufactured in the United States for AquaFit, Natures Formulas, based in Aurora, Colorado. The manufacturer states that ingredients are sourced according to quality specifications and that the product formulation follows established supplement manufacturing protocols.
Consumers researching dietary supplements should understand that the FDA does not approve dietary supplements before they reach the market. The regulatory framework for supplements differs from medications, with the Dietary Supplement Health and Education Act placing responsibility on manufacturers for safety and accurate labeling.
According to the company, AquaFit uses vegetable capsules (hypromellose), making it suitable for those following vegetarian dietary preferences. Other ingredients include microcrystalline cellulose, magnesium stearate, and silicon dioxide.
Label directions describe a once-daily capsule format; readers should follow the product label and consult a qualified healthcare professional for individualized guidance.
Safety Information and Interaction Considerations
Some ingredients commonly discussed in metabolic supplement research may be relevant for individuals taking medications or managing health conditions. Published research frequently discusses berberine, chromium, and alpha lipoic acid in relation to glucose metabolism, and green tea extracts may contain caffeine. Individuals who take prescription medications or have medical conditions should consult a qualified healthcare professional before using dietary supplements.
The product label states the following cautions: Do not exceed recommended dose. Not for use by those under the age of 18 or pregnant or nursing mothers. Consult with a physician prior to use especially if you are taking a medication or have a medical condition.
Distribution Information
According to the company, AquaFit is offered through its official website, where current availability, shipping information, and policy terms are published and subject to change. According to the company’s published policy pages, AquaFit lists refund and return terms on its official website, and those terms may change; consumers are encouraged to review current details directly before making any purchase decision.
Market Context: Weight Management Supplement Category
Consumers researching weight management approaches encounter numerous options including single-ingredient supplements, multi-ingredient formulations, prescription medications, and various dietary and exercise programs. Traditional supplement approaches have emphasized particular botanicals such as green tea extract or conjugated linoleic acid as primary ingredients. These have varying levels of research documentation, with study results showing mixed outcomes across different research designs.
Prescription medications represent a different category with distinct regulatory pathways. These medications undergo clinical trial processes and regulatory review procedures that differ from dietary supplement pathways.
According to the company, AquaFit’s positioning emphasizes thermogenic research references and metabolic support research discussions within the broader weight management supplement category. The capsule format represents one delivery method option within the broader supplement category.
What Research and Public Information Do and Do Not Show About AquaFit
Consumers evaluating AquaFit should understand several important distinctions about research and evidence:
AquaFit as a complete formulation has not been subjected to clinical trials. The manufacturer references published research on individual ingredients and physiological mechanisms, but these studies examined isolated compounds or biological processes rather than evaluating the finished AquaFit product.
Published research on ingredients represents investigation of individual substances under controlled conditions. The presence of researched ingredients in a formulation does not predict outcomes from the complete product. Ingredient research and finished product outcomes represent different categories of evidence.
Individual responses to dietary supplements vary significantly based on numerous factors including baseline characteristics, lifestyle variables, genetic factors, concurrent medications, health status, and other individual considerations. Research documenting group-level statistical associations in controlled studies does not predict individual experiences.
The company references research as the conceptual foundation for formulation design. This represents the manufacturer’s interpretation of published science rather than direct evidence of product efficacy. Consumers should distinguish between research informing formulation strategy and research documenting finished product outcomes.
One characteristic of the AquaFit formula worth noting: the use of a proprietary blend. While the total blend weight is listed (276 mg), individual ingredient amounts within the blend are not specified on the label. This labeling approach is permitted under current FDA regulations but may limit direct comparison to dosages used in published research.
Dietary supplements are not intended to diagnose, treat, cure, or prevent any disease. Weight management concerns should be evaluated by qualified healthcare professionals. Any health management decisions should occur with physician guidance.
Consumer Decision Framework and Evaluation Considerations
Consumers considering nutritional approaches to weight management encounter questions about appropriateness, expectations, and alignment with individual circumstances. AquaFit represents one option within a broader landscape of supplement and lifestyle approaches.
Consumers researching AquaFit often have various characteristics and motivations. Some seek nutritional support approaches while maintaining active lifestyles. Others take proactive approaches to metabolic health maintenance. Some prefer multi-ingredient formulas. Some are drawn to formulations emphasizing thermogenic and metabolic research. Individual priorities and circumstances vary significantly.
Consumers for whom AquaFit may not be appropriate include those requiring medical intervention for obesity or metabolic disorders, those with diagnosed medical conditions requiring physician oversight, individuals seeking evidence from product-specific clinical trials, individuals with sensitivities to caffeine or botanical extracts, those who prefer single-ingredient approaches for precise dosing, or those taking multiple medications or managing complex health situations.
Before choosing any dietary supplement, healthcare provider consultation is recommended to ensure appropriate oversight and informed decision-making. Lifestyle approaches including caloric balance, dietary patterns, physical activity, sleep quality, and stress management significantly relate to weight management outcomes.
Contact Information
For questions about AquaFit, according to the company’s published information, customer service is available through:
Product Support Email: [email protected]
Phone: 1-888-254-0425 (7AM to 9PM, 7 days a week)
Physical Address: AquaFit, 19655 E 35th Dr #100, Aurora, CO 80011, USA
Readers may view the current AquaFit offer (official AquaFit page) to review manufacturer-published label details, ingredient disclosures, and policy information.
Regulatory Environment and Industry Context
The dietary supplement industry operates under regulatory frameworks that differ from pharmaceutical regulation. The FDA’s authority over dietary supplements differs significantly from medication oversight. Supplements do not require pre-market approval processes, though manufacturers bear responsibility for safety and label accuracy. Post-market surveillance systems monitor safety through adverse event reporting mechanisms.
Recent years have included regulatory attention to health claim categories for various supplement types. The Federal Trade Commission monitors advertising representations, requiring that marketing claims have substantiation.
Consumers should review current information about any supplement’s regulatory status and manufacturing practices before making purchase decisions. Weight management concerns should be evaluated by qualified healthcare professionals. Health management approaches should be discussed with physicians.
Approaches to maintaining healthy weight include balanced caloric intake, dietary patterns emphasizing whole foods, regular physical activity, adequate sleep, stress management, and prompt discussion of weight concerns with qualified healthcare providers.
Disclaimers
FDA Health Disclaimer: These statements have not been evaluated by the Food and Drug Administration. This product is not intended to diagnose, treat, cure, or prevent any disease. Always consult your physician before starting any new supplement, especially if you have existing health conditions, take medications, or are pregnant or nursing.
Results May Vary: Individual results will vary based on factors including age, baseline health condition, lifestyle factors, consistency of use, genetic factors, current medications, and other individual variables. Ingredient-level research does not predict outcomes from any specific finished product.
Affiliate Disclosure: This article contains affiliate links. If you purchase through these links, a commission may be earned at no additional cost to you.
Pricing and Policy Disclaimer: All information was accurate at the time of publication (January 2026) but is subject to change. Always verify current pricing, terms, and policies on the official AquaFit website before making decisions.
Publisher Responsibility: The publisher has made every effort to ensure accuracy at the time of publication. Readers are encouraged to verify all details directly with AquaFit and their healthcare provider before making decisions.
Related Links:
Contact: AquaFit Customer Support 19655 E 35th Dr #100 Aurora, CO 80011, USA Phone: 1-888-254-0425 Email: [email protected]
CONTACT: Product Support Email: [email protected]
Phone: 1-888-254-0425 (7AM to 9PM, 7 days a week)

Jakarta, Pintu News – Dogecoin (DOGE) is currently trading at technically sensitive levels, as short-term momentum starts to slow down after the previous sharp rally. The latest price action on Kraken’s 4-hour DOGE/USD chart shows that buyers still dominate the overall market structure.
However, consolidation below the resistance area indicates that the market is evaluating the direction of the move, rather than going straight for a breakout. This pause came after an impulsive move from the $0.115 to $0.155 range, which signaled strong participation from the buyers’ side.
As a result, traders are now focusing on whether the support level can hold during this cooling phase.
Dogecoin’s short-term trend is still bullish, although the upward momentum is starting to ease. DOGE continues to form higher lows, indicating that the recovery structure is maintained.
Read also: Shiba Inu Still Under Pressure Due to Surge in Liquidations: Can SHIB Price Rise?
Moreover, the medium-term trend appears to be stabilizing after the formation of a higher low around the $0.116 level. This recovery has shifted market sentiment away from aggressive selling pressure. However, the price is now stuck below the $0.148 supply zone, creating a narrow trading area.
Importantly, DOGE is still trading above the key area of the Fibonacci level and EMA cluster combined, which reinforces the bullish bias. The $0.141 to $0.142 zone is the first important point for the bulls to defend.
This level is a combination of the 0.618 Fibonacci retracement and the previous breakout area. If the price fails to hold here, then there is a risk of a deeper correction. On the other hand, the $0.138 to $0.137 range has a dense cluster of EMAs, adding to the significance of the area as a demand zone.
Resistance is still clear and layered. DOGE faces immediate selling pressure around $0.148, which is the area where the price has recently been stuck. In addition, the psychological level of $0.150 could attract new momentum if broken successfully. A confirmed breakout above $0.155 would signal the continuation of the uptrend and open up the potential towards $0.160.
On the downside, a controlled correction to around $0.134 is still considered reasonable and does not damage the long-term structure. However, if there is a net breakdown below $0.125, then the bullish scenario will fall. Therefore, traders are now watching these zones closely to determine the direction of the next move.

Derivatives data provides important context to the structure of price charts. Open interest in the Dogecoin futures market shows a cyclical pattern – expanding during rallies and contracting after the price peaks.
The peak in open interest that occurred near the previous high suggests aggressive use of leverage to chase the price. However, the latest data shows that open interest has now stabilized at around $1.8 billion as the DOGE price hovers around $0.15. This stability indicates reduced speculative pressure.
Read also: PEPE Price Jumps 50% in a Week: Is an 80% Rise Awaiting?
Spot flow data supports this view. In recent sessions, net outflows from exchanges have continued to dominate, meaning DOGE is being pulled off trading platforms.
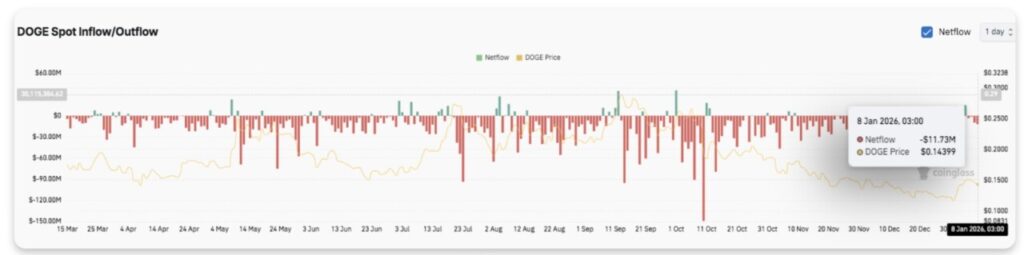
This suggests that selling pressure is likely to be limited. The latest outflow of around $11.7 million occurred while the price stayed above the $0.14 level. Overall, this behavior reflects cautious accumulation, rather than aggressive speculation.
Dogecoin’s price structure remains positive as key technical levels are still evident ahead of the short-term trading sessions.
Currently, the price is still in a consolidation phase after a strong impulsive rise, which reflects compression rather than exhaustion.
Rising Levels (Resistance):
Immediate resistance is in the range of $0.1478-$0.1485, an area where sellers have consistently held back the upside.
If price manages to break and hold this zone, the upside potential could continue to $0.1500, then to the swing high at $0.1557. A confirmed breakout above $0.155 would most likely accelerate the momentum towards the $0.160 area.
Downside Levels (Support):
Initial support is in the $0.1410-$0.1420 range, which is reinforced by the 0.618 Fibonacci retracement and the previous breakout structure. Below that, the EMA cluster in the range of $0.1383-$0.1375 becomes an important demand zone.
If the price correction continues, the $0.1340 area could be the next target, while $0.1255 becomes the last level that determines the validity of the bullish scenario.
Upper Limit Resistance:
The high of $0.1557 is an important point that the bulls need to break in order to continue the uptrend and open up the upside potential to higher levels.
From a Structure Perspective:
DOGE price appears to be moving in a compression pattern (volatility tightening) within a narrowing range, after rallying from $0.115 to $0.155. The pattern of higher lows is still intact, while short-term lower highs are also forming indicating a consolidation phase below the resistance.
Therefore, volatility expansion becomes increasingly likely as the price approaches the apex of this pattern.
That’s the latest information about crypto. Follow us on Google News to get the latest crypto news about crypto projects and blockchain technology. Also, learn crypto from scratch with complete discussion through Pintu Academy and stay up-to-date with the latest crypto market such as bitcoin price today, xrp coin price today, dogecoin and other crypto asset prices through Pintu Market.
Enjoy an easy and secure crypto trading experience by downloading Pintu crypto app via Google Play Store or App Store now. Also, get a web trading experience with various advanced trading tools such as pro charting, various types of order types, and portfolio tracker only at Pintu Pro.
*Disclaimer
This content aims to enrich readers’ information. Pintu collects this information from various relevant sources and is not influenced by outside parties. Note that an asset’s past performance does not determine its projected future performance. Crypto trading activities have high risk and volatility, always do your own research and use cold cash before investing. All activities of buying and selling bitcoin and other crypto asset investments are the responsibility of the reader.
Reference:
From a breakthrough for diabetes to a potential key for heart, kidney, liver, and reproductive health, GLP-1 medications are redefining chronic disease treatment.
The story of GLP-1 receptor agonists began as a chapter in diabetes care, but it is rapidly expanding into a multi-volume saga on managing interconnected chronic conditions. Originally developed to help the body better regulate blood sugar, this class of medications—which includes widely known drugs like semaglutide (Ozempic, Wegovy) and tirzepatide (Mounjaro, Zepbound)—has demonstrated effects that reach far beyond the pancreas. By mimicking a natural gut hormone that slows digestion and signals fullness to the brain, these drugs have unlocked a new, systemic approach to treating obesity and its related conditions**, from heart and kidney disease to polycystic ovary syndrome (PCOS). Their rapid rise, coupled with the recent U.S. launch of the first oral GLP-1 pill for obesity, signals a seismic shift in how we approach metabolic and overall health.
The core mechanism of GLP-1 drugs is elegantly tied to natural physiology. They act like the body’s own glucagon-like peptide-1 hormone, which is released after eating. This action triggers a cascade of effects:
This multifaceted approach to regulating metabolism and energy balance is why their benefits extend across multiple organ systems.
A landmark 2026 umbrella review in Nature Communications, synthesizing data from over 5,600 articles, confirmed that GLP-1 receptor agonists show clear trends toward improving outcomes across a wide spectrum of health areas. Their impact is not singular but systemic.
This remains the most dramatic and well-documented effect. Large-scale trials show that newer agents can lead to an average body weight reduction of 15–22%. The recent FDA approval and launch of the first oral GLP-1 pill for obesity—Novo Nordisk’s Wegovy pill—promises to expand access dramatically, with a cash price starting at $149 per month. Clinical trials showed this oral version could lead to an average weight loss of up to 16.6% over 64 weeks.

The cardiovascular benefits are now firmly established. Semaglutide (Wegovy) is approved specifically to reduce the risk of major cardiovascular events—like heart attack, stroke, or cardiovascular death—in adults with obesity and established heart disease. The Nature Communications review corroborates that these drugs show a strong trend toward improving cardiovascular outcomes. Researchers believe these benefits stem not just from weight loss, but also from direct effects on blood vessels, blood pressure, and lipid profiles.
Emerging evidence points to significant renal protection. Slowing the progression of kidney disease is a critical need for many people with diabetes and hypertension, and GLP-1 agonists are showing promise in this arena, as noted in the broad review of their therapeutic potential.
Non-alcoholic fatty liver disease (NAFLD), closely linked to obesity and insulin resistance, may also be positively impacted. Research indicates these drugs can reduce liver fat and inflammation, offering a potential medical therapy for a condition with few treatment options.

Perhaps one of the most profound and personal impacts of GLP-1 therapy is emerging in women’s reproductive health, particularly for the 10% of women affected by Polycystic Ovary Syndrome (PCOS).
PCOS is characterized by insulin resistance, hormonal imbalance, and often obesity, which together can suppress ovulation and cause infertility. GLP-1 drugs attack the root of the problem. By improving insulin sensitivity and promoting significant weight loss, they can help restore hormonal balance and regular menstrual cycles.
A Critical Caution on Contraception and Pregnancy: The fertility-boosting potential comes with a vital warning. These drugs can decrease the effectiveness of oral birth control pills because slower stomach emptying affects the pill’s absorption. Experts strongly recommend using a backup, non-oral contraceptive method (like an IUD, implant, or condoms) to prevent unplanned pregnancies while on GLP-1 therapy. Furthermore, these drugs are not recommended during pregnancy or breastfeeding due to limited safety data. Women planning for pregnancy must work closely with their healthcare team to safely discontinue the medication before trying to conceive.

The promise of these drugs is tempered by the challenges of cost and access. While list prices for injectable versions can approach $1,000 per month, efforts are underway to improve affordability. The recent BALANCE payment model announced by the federal government aims to negotiate lower prices for Medicare and Medicaid programs. Additionally, direct-to-consumer deals, like the $149 per month cash price for the new Wegovy pill, are creating new pathways.
The therapeutic horizon continues to expand. Next-generation agents in development are moving beyond pure GLP-1 agonism. Triple agonists like retatrutide (targeting GLP-1, GIP, and glucagon receptors) and combinations with other hormones like amylin (e.g., CagriSema) promise even greater efficacy for weight loss and metabolic control. The rise of oral small-molecule GLP-1 agonists will likely improve adherence and choice for patients.
GLP-1 receptor agonists represent a fundamental shift from treating individual symptoms to addressing the interconnected root causes of many chronic diseases: metabolic dysfunction and obesity. Their benefits for the heart, kidneys, liver, and reproductive system underscore that improving metabolic health is improving whole-body health.

However, they are powerful medications, not magic bullets. They carry risks, including gastrointestinal side effects and a potential increased risk for certain conditions like gallbladder disease. Their success depends on being part of a holistic plan that includes sustainable nutrition, exercise, and behavioral changes—habits that patients can maintain long after medication is discontinued, especially when preparing for life events like pregnancy.
As access broadens and science advances, the true “miracle” of GLP-1 drugs may ultimately be how they have reframed our understanding of disease, compelling both medicine and society to treat the whole person, not just a single diagnosis.
Disclaimer
The Content is not intended to be a substitute for professional medical advice, diagnosis, or treatment. Always seek the advice of your physician or other qualified health provider with any questions you may have regarding a medical condition.
Toronto, Canada, January 9th, 2026, Chainwire
DBTC DeFi today announced the launch of its fully automated decentralized finance platform, designed to generate daily yield without requiring trading, speculation, or ongoing user intervention. In a fast-moving market, where investors often struggle to respond to volatility in real time, DBTC DeFi introduces a system that aims to simplify yield generation by eliminating the need to time the market or actively manage positions.
Why DBTC DeFi Exists
DBTC DeFi was developed to provide a system aimed at generating consistent daily yield, without requiring users to make time-sensitive decisions. The protocol is designed to operate without the need for chart analysis, hardware management, or market timing.
How DBTC DeFi Works
The process is designed to function without technical setup or ongoing user decisions, aiming to provide consistent, automated output.
Key Features of DBTC DeFi
Structured Mechanism Over Market Speculation
DBTC DeFi operates through a structured execution model, rather than relying on speculative investment strategies. The system is designed to function independently of market conditions, with its yield mechanism not dependent on price forecasts or market timing by users.
Starting in Minutes
Sample Investment Structures:
About DBTC DeFi
DBTC DeFi is a leading decentralised finance platform that enables users to generate daily yield through fully automated, hands-off systems. By leveraging global green-energy infrastructure and secure technology, DBTC DeFi offers a reliable and eco-friendly investment solution.
Users can visit: https://dbtcdefi.com and Download the DBTC DeFi App now.
DBTC DeFi
info@dbtcdefi.com
Select market data provided by ICE Data Services. Select reference data provided by FactSet. Copyright © 2026 FactSet Research Systems Inc.Copyright © 2026, American Bankers Association. CUSIP Database provided by FactSet Research Systems Inc. All rights reserved. SEC fillings and other documents provided by Quartr.© 2026 TradingView, Inc.
The GBPJPY pair lost the bullish momentum due to stochastic exit from the overbought level, which forces it to delay the bullish attack by reaching below 211.30 level, which keeps forming an important obstacle against the bullish attempts.
We expect providing new mixed trading with a chance of attacking the minor bullish channel’s support at 210.10, breaking this support makes us expect targeting extra corrective stations that might begin at 209.45 and 208.80, while the trading rally above the obstacle will increase the chances of recording new gains by targeting 212.55 and 213.75 level.
The expected trading range for today is between 210.10 and 211.50
Trend forecast: Fluctuated within the bullish trend


