The main category of All News Articles.
You can use the search box below to find what you need.
[wd_asp id=1]
The main category of All News Articles.
You can use the search box below to find what you need.
[wd_asp id=1]
The euro went back and forth on Monday, as traders continued to digest the news over the weekend out of Caracas. Risk sentiment is likely to be in flux at best.
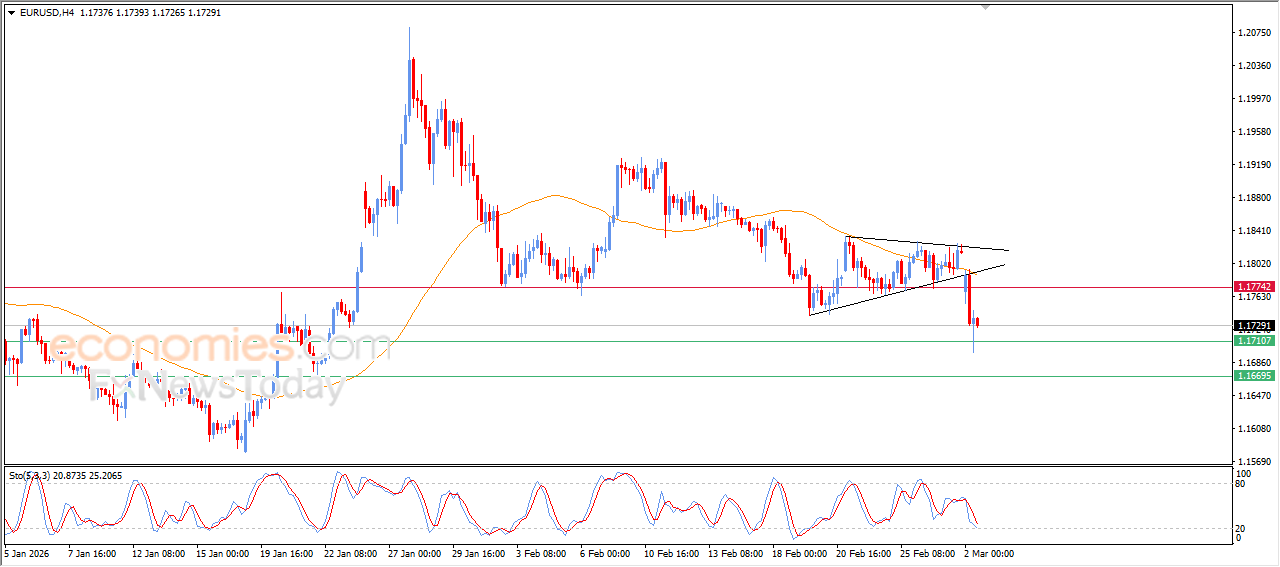
The euro was back and forth during the trading session on Monday as we initially tested the 50-day EMA. I think at this point in time, it is obvious that the buyers are still willing to stick with the euro despite the fact that it has not been able to break above a significant resistance barrier. That resistance barrier is the 1.18 level, which could extend all the way to the 1.19 level. I think it is going to take pretty hefty bullish pressure to finally break above there.
But there is a little bit of policy divergence here between these two central banks as the Federal Reserve is expected to cut rates further into 2026, and as a result, it is likely that the US dollar will face some pressure there. That being said, the ECB is expected to be less aggressive with its cuts, although cutting is still possible. At this point, the European growth is projected to be modest, somewhere right around 1.2%, but steady and supported by fiscal stimulus in Germany. The United States growth outlook is expected to slow in the beginning part of 2026 but then take off.
All things being equal, I think this is also a market that is trying to determine whether or not inflation is going to be sticky in America. If it is, that is dollar positive. Ultimately, I think this is a situation where traders look at this through the eyes of a consolidation range with more of a buy on the dip mentality. Breaking below the 1.14 level smashes this narrative to pieces, but right now, this has held steady for several months.
Ready to trade our daily Forex analysis? We’ve made this forex brokers list for you to check out.
Christopher Lewis has been trading Forex and has over 20 years experience in financial markets. Chris has been a regular contributor to Daily Forex since the early days of the site. He writes about Forex for several online publications, including FX Empire, Investing.com, and his own site, aptly named The Trader Guy. Chris favours technical analysis methods to identify his trades and likes to trade equity indices and commodities as well as Forex. He favours a longer-term trading style, and his trades often last for days or weeks.
XRP is experiencing significant momentum on January 6, 2026, with the cryptocurrency surging 12.3% to reach $2.3475. This rally has captured attention across the crypto market, pushing XRP’s market cap to $130.2 billion. The strong price action reflects growing interest in the digital asset, with trading volume reaching 7.07 billion. Understanding why XRP is pumping requires examining both technical factors and broader market sentiment. We’ll break down the key drivers behind this move and what it means for XRP price prediction going forward.
XRP’s 12.3% daily surge stems from multiple converging factors in the crypto market. The token has recovered significantly from its $1.53 year low, now trading closer to its $3.65 year high. Strong volume of 7.07 billion indicates genuine buying pressure rather than speculative moves.
Regulatory clarity around XRP has improved sentiment considerably. The cryptocurrency has benefited from reduced legal uncertainty that previously weighed on its price. Additionally, institutional adoption continues to grow, with more financial institutions exploring blockchain solutions that XRP supports. Market participants are positioning ahead of potential positive developments in the crypto regulatory landscape.
Trading activity shows robust engagement with XRP on January 6, 2026. Volume is 57% above the 30-day average at 7.07 billion, signaling strong conviction among traders. The relative volume metric of 1.21 confirms this is above-average activity for the asset.
Liquidation data reveals that long positions are being accumulated rather than liquidated at current levels. This suggests traders expect further upside movement. The price holding above the 50-day moving average of $2.02 demonstrates sustained buying interest. Short-term momentum remains positive, though traders should monitor for potential consolidation as the asset approaches resistance levels.
XRP’s technical setup shows mixed signals worth examining carefully. The RSI at 66.74 indicates the asset is approaching overbought territory but hasn’t reached extreme levels above 70. This suggests momentum remains strong without being overextended. The MACD histogram at 0.05 is positive but small, showing momentum is present but potentially weakening.
The ADX at 34.92 confirms a strong trend is in place, well above the 25 threshold that indicates directional strength. Bollinger Bands show price at $2.35 positioned between the middle band at $1.93 and upper band at $2.17, indicating price is in the upper half of its recent range. Support sits at the lower Bollinger Band of $1.70, while resistance forms near the upper band at $2.17. The Stochastic %K at 76.34 suggests momentum is elevated but the %D at 54.80 shows the signal line hasn’t caught up, potentially indicating a divergence.
Monthly Forecast: XRP is projected to reach $2.76 by month-end, representing a 17.4% increase from current levels. This target assumes continued positive sentiment and sustained buying pressure.
Quarterly Forecast: By the end of Q1 2026, XRP could reach $2.95, a 25.5% gain from today’s price. This timeframe allows for consolidation and potential pullbacks before the next leg higher.
Yearly Forecast: Our 2026 year-end target stands at $3.07, representing a 30.7% increase from current trading levels. This projection assumes regulatory environment remains supportive and institutional adoption continues growing.
Forecasts may change due to market conditions, regulations, or unexpected events. These targets reflect technical analysis and historical patterns but are not guaranteed outcomes.
Looking beyond 2026, XRP shows compelling long-term potential based on fundamental and technical factors. The three-year forecast of $6.07 suggests the asset could more than double from current levels. This projection assumes continued blockchain adoption and XRP’s role in cross-border payments expands significantly.
The five-year forecast of $9.07 reflects confidence in XRP’s utility and market position. Historical performance supports this outlook, with XRP up 295% over the past year and 539% over three years. However, these forecasts depend on regulatory clarity remaining favorable and competition in the payments space not intensifying. The cryptocurrency’s success hinges on real-world adoption of Ripple’s technology by financial institutions globally.
Understanding price levels is crucial for XRP traders and holders. The upper Bollinger Band at $2.17 serves as immediate resistance, though price has already moved above this level. The year-to-date high of $3.65 represents the next significant resistance zone that could attract selling pressure.
Support levels are equally important for risk management. The 50-day moving average at $2.02 has proven reliable, with price bouncing from this level multiple times. The lower Bollinger Band at $1.70 provides a secondary support zone. The 200-day moving average at $2.57 sits above current price, acting as a longer-term resistance level. Breaking below the $2.02 support would signal weakening momentum and could trigger a retest of the $1.70 level.
XRP’s 12.3% surge on January 6, 2026 reflects genuine market momentum driven by improved regulatory sentiment and institutional interest. The technical setup shows strength with an ADX of 34.92 confirming a strong trend, though the RSI at 66.74 warns of approaching overbought conditions. Price forecasts suggest XRP could reach $2.76 monthly, $2.95 quarterly, and $3.07 by year-end 2026. Trading volume at 7.07 billion demonstrates conviction behind this move, with liquidation data supporting continued accumulation. The cryptocurrency’s long-term outlook remains positive, with five-year forecasts reaching $9.07, assuming regulatory clarity persists and institutional adoption accelerates. Key support sits at the $2.02 level, while resistance forms near $2.17 and $3.65. Traders should monitor the RSI for overbought extremes and watch for MACD divergence signals. The broader crypto market environment and regulatory developments will remain critical factors influencing XRP’s price trajectory throughout 2026.
XRP is surging **12.3%** due to improved regulatory clarity, institutional adoption growth, and strong trading volume of **7.07 billion**. The cryptocurrency has recovered from its year low of **$1.53**, benefiting from reduced legal uncertainty and positive market sentiment toward blockchain solutions.
XRP price prediction targets **$2.76 monthly**, **$2.95 quarterly**, and **$3.07 by year-end 2026**. These forecasts assume continued regulatory support and institutional adoption. Long-term projections suggest **$6.07 in three years** and **$9.07 in five years**, though actual results depend on market conditions.
Technical analysis reveals **RSI at 66.74** (approaching overbought), **ADX at 34.92** (strong trend), and **MACD histogram at 0.05** (positive momentum). Price trades between Bollinger Bands with support at **$1.70** and resistance at **$2.17**, indicating strength but potential consolidation ahead.
Market data shows XRP has gained **295% over one year** and **539% over three years**, with strong technical indicators and institutional interest. However, cryptocurrency investments carry significant risk. Consult financial advisors before making investment decisions based on market analysis.
Key support levels include the **50-day moving average at $2.02** and **lower Bollinger Band at $1.70**. Resistance forms at the **upper Bollinger Band of $2.17** and **year high of $3.65**. The **200-day moving average at $2.57** acts as longer-term resistance above current price.
Current volume of **7.07 billion** is **57% above** the 30-day average of **4.49 billion**, with relative volume at **1.21**. This elevated activity confirms strong trader conviction and genuine buying pressure behind the price surge.
Disclaimer:
Cryptocurrency markets are highly volatile. This content is for informational purposes only.
The Forecast Prediction Model is provided for informational purposes only and should not be considered financial advice.
Meyka AI PTY LTD provides market data and sentiment analysis, not financial advice.
Always do your own research and consider consulting a licensed financial advisor before making investment decisions.
Gold (XAU/USD) increased to about $4,440. As the Venezuela crisis introduces geopolitical uncertainty, the precious metal continues to rise and reaches a one-week high due to demand for safe havens.

Traders will keenly watch US economic data, such as Nonfarm Payrolls (NFP), for hints about the direction of monetary policy. After the US Army’s Delta Force attacked Venezuela and captured its President Nicolás Maduro and his wife on Saturday, tensions between the US and Venezuela reached a new high
Maduro began an extraordinary legal battle with significant geopolitical ramifications on Monday when he entered a not guilty plea to US charges in a narco-terrorism case against him. Traditional safe-haven assets are fueled by increased geopolitical tensions and uncertainty in this area.
The upside of the yellow metal is partly due to dovish expectations of the US Federal Reserve (Fed). According to the most recent Federal Open Market Committee (FOMC) Minutes, the majority of Fed officials agreed that additional interest rate cuts were necessary as long as inflation decreased.
Still, they couldn’t agree on when or how much. Lower interest rates could support the non-yielding precious metal by lowering the opportunity cost of holding gold. On Friday, everyone will be watching the US employment report for December.
55,000 new jobs are anticipated to be added to the US economy in December, while the unemployment rate is predicted to drop to 4.5 percent. In the short term, this could strengthen the US dollar (USD) and weaken the price of commodities denominated in USD if the reports indicate a better-than-expected result.
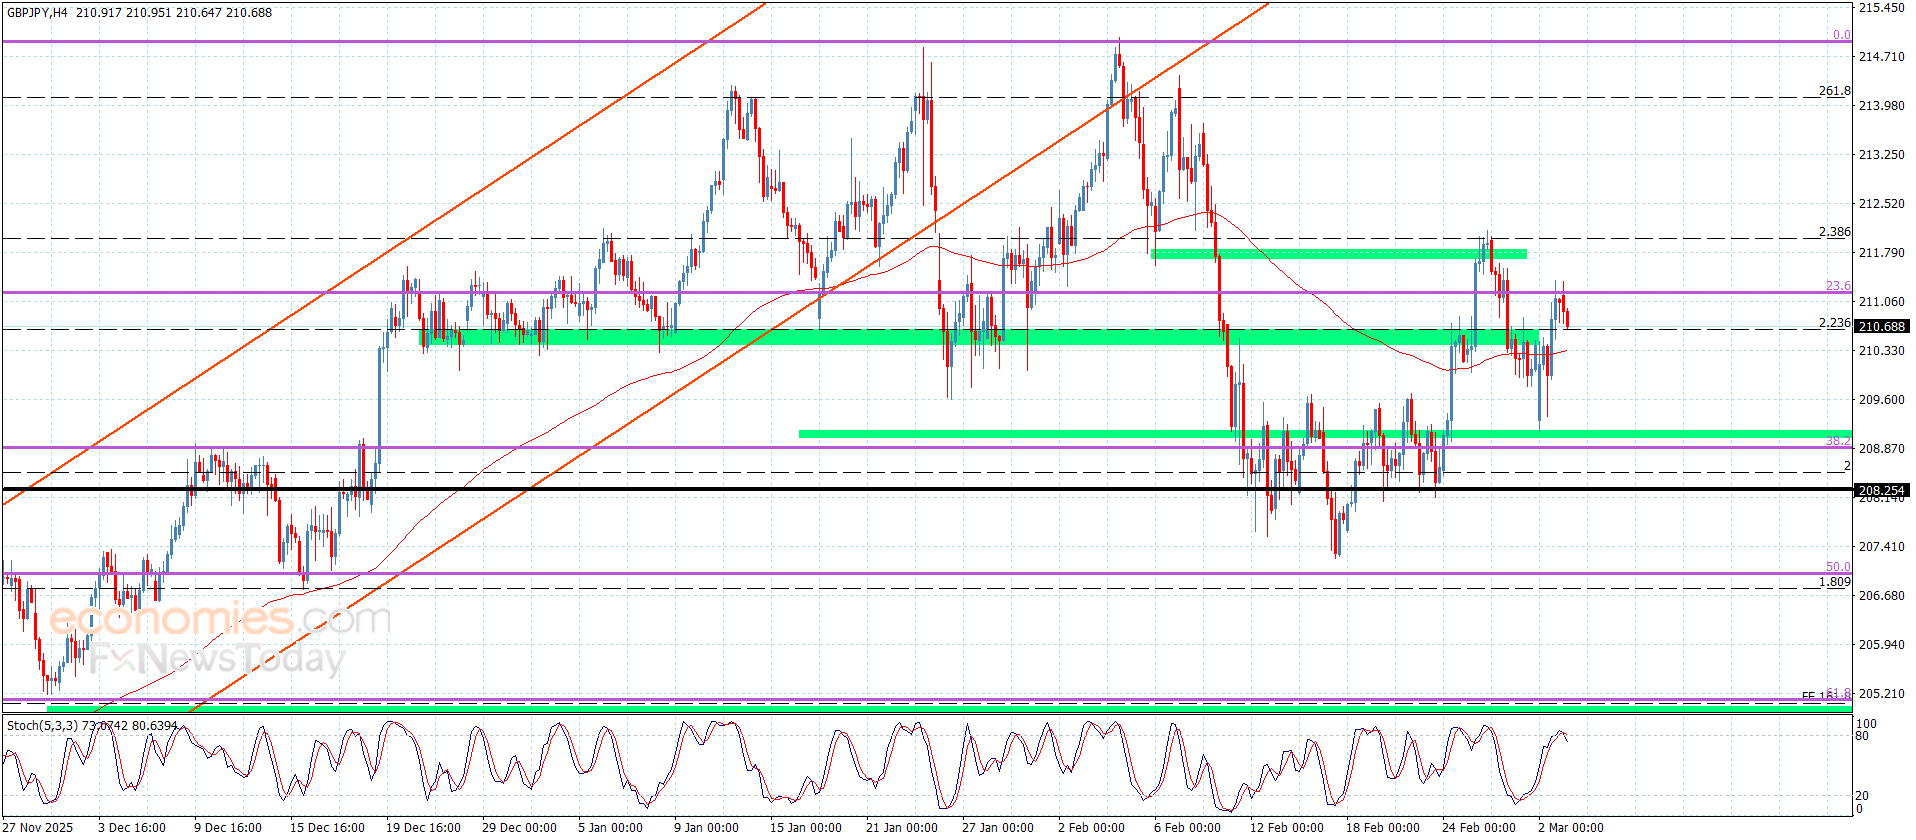
The British pound has spent most of the day on Monday bouncing from the initial selloff. Initially, when the market woke up, it started to look at the situation in Venezuela, and we did see a little risk-off type of behavior. That has since abated, and it looks like this pair is going to continue to find plenty of momentum. As I write this article, we are near the recent swing high, and there is no reason to think that anything has changed. The market is currently consolidating near its highs, showing no immediate signs of a reversal.
This market is defying what some people would think of as the fundamental logic of a strengthening Japanese yen due to the Bank of Japan’s rate hikes. But that being said, it is driven by the carry trade because even if the Bank of Japan starts to raise rates, the Bank of England still offers so much more interest that the carry trade is alive and well.
The market breaking out to the upside could open up a move to the 215 yen level, possibly higher than that. We will just have to wait and see. Just like the market breaking down below the 210 level opens up the possibility of a deeper correction toward the 50-day EMA near the 207 yen level. This is a market that I think will continue to see plenty of buy on the dip type of attitude. I do think there are plenty of people out there willing to take advantage of cheap British pounds in relation to the Japanese yen going forward. I have no interest whatsoever in shorting this pair as the momentum is obviously to the upside.
Begin trading our daily forecasts and analysis. Here is a list of Forex brokers in Japan to work with.
Christopher Lewis has been trading Forex and has over 20 years experience in financial markets. Chris has been a regular contributor to Daily Forex since the early days of the site. He writes about Forex for several online publications, including FX Empire, Investing.com, and his own site, aptly named The Trader Guy. Chris favours technical analysis methods to identify his trades and likes to trade equity indices and commodities as well as Forex. He favours a longer-term trading style, and his trades often last for days or weeks.
CLAIM: The amount of catechins in a single cup of green tea is too low to cause meaningful weight loss, with studies showing only modest effects at much higher doses. Consuming green tea in excess to achieve such doses may pose health risks rather than benefits.
FACT: True. Experts caution that relying on green tea alone for weight loss is misleading, and excessive consumption may cause side effects such as iron absorption issues, interactions with medications, and increased caffeine-related risks.
Weight loss trends come and go, but certain “healthy” fixes seem to return again and again. Green tea is one of them. From celebrity endorsements to daily wellness routines, it is often promoted as a simple drink that can boost metabolism and shrink waistlines. But how much of this claim actually holds up?
In a viral Instagram reel, dietician Bhawesh Gupta, who has 7.16 lakh followers, addresses the belief that green tea leads to weight loss. Referring to actor Shraddha Kapoor’s advertisement for Lipton Green Tea, he points out how celebrity promotions have shaped public perception around the drink. “You must have seen Shraddha Kapoor’s famous ad,” he says, adding that she claims drinking green tea daily boosts metabolism and reduces waist size.
Bhawesh explains that green tea contains a special polyphenol called catechin, which is often linked to fat loss. Citing research studies, he says that when 500 to 1,000 mg of catechins were given in an isolated form, participants lost only 1–2 kg of weight and 2–3 cm of waist size over three months. However, he stresses that “in one cup of green tea, only around 70 mg of catechins are present.”
“To get even a little weight loss, you would have to drink at least 10 cups of green tea every day,” he says, warning that such high consumption is not good for health. He notes that green tea also contains antinutrients like tannins and oxalates, which in large amounts can interfere with iron absorption and increase the risk of kidney stones. He further adds that high doses of catechins can raise liver enzymes such as ALT and AST. “So, avoid this misleading marketing of companies,” Bhawesh says, advising people to consume green tea only in moderation, and for taste.
The reel, which has garnered 1.74 lakh views, over 6,200 likes, and more than 1,000 shares, has reignited debate around whether green tea is genuinely effective for weight loss, or simply another example of misleading health marketing dressed up as wellness advice.
Green tea is rich in nutrients and antioxidants and may offer some health benefits. However, further research is necessary to determine how much it may help with weight loss and the best consumption method.
According to the National Centre for Complementary and Integrative Health (NCCIH), green tea is commonly included in weight-loss products, yet it does not cause significant weight loss in adults with overweight or obesity. “The catechins and caffeine in green tea and its extracts may have a modest effect on body weight. However, the effects of green tea products may vary depending on the composition of the product and the individual’s level of physical activity,” the NCCIH notes.
Green tea contains polyphenols, catechins, and caffeine, which may contribute to modest weight-loss benefits. A 2023 review suggests that catechins can influence metabolism and fat markers, while caffeine may support weight loss when consumed in amounts above 300 mg daily.
Research in animals and lab studies also indicate that catechins may reduce total blood cholesterol, LDL, and triglycerides, which are linked to weight management. However, these benefits are generally small, and achieving measurable effects would require consuming large amounts consistently over time.
A 2023 meta-analysis highlights mixed results regarding green tea’s weight-loss effects. Within the analysis, some randomised controlled trials found that green tea supplementation significantly reduced weight, BMI, and waist circumference in women with overweight or obesity. The researchers concluded that taking up to 1,000 mg of green tea catechins daily for 8 weeks or less could provide modest benefits.
Similarly, a 2020 review suggested that lower doses (under 500 mg daily) for 12 weeks also led to small reductions in body weight. Overall, green tea may support weight management when combined with a balanced diet and regular exercise, but its effects are generally modest.
Another 2022 review reported that green tea could reduce total cholesterol, low-density lipoprotein (LDL), and triglycerides in animals on obesity-inducing diets. However, similar effects were not consistently observed in human studies, indicating that more research is needed to confirm these benefits in people.
Green tea may interact with certain medications. The NCCIH notes that high doses of green tea can reduce blood levels of some drugs, including the beta-blocker nadolol (Corgard).
While caffeine and catechins in green tea have known health benefits, they can also cause side effects in some people, especially when consumed in large amounts. Excessive caffeine may lead to anxiety, sleep disturbances, stomach upset, and headaches. During pregnancy, high caffeine intake may increase the risk of birth defects or miscarriage.
Research recommends limiting caffeine to 300 mg daily, though a review of over 400 studies found that healthy adults consuming up to 400 mg per day did not experience adverse effects.
The caffeine content in green tea varies depending on the leaves and steeping time. One gram of green tea contains 11–20 mg of caffeine, and a typical serving of 1 tablespoon (2 grams) in 240 ml of water provides roughly 22–40 mg of caffeine per cup.
Green tea catechins can also reduce iron absorption, and consuming large amounts may lead to iron deficiency anaemia. Those at risk, including infants, young children, pregnant or menstruating women, and people with internal bleeding or on dialysis, should drink tea between meals and wait at least an hour after eating.
Catechins may additionally interfere with certain medications, including those used to treat anxiety and depression, potentially reducing their effectiveness. Toxic effects are most common with green tea supplements, which contain much higher concentrations of catechins than brewed tea.
Rajeshwari Panda, Head of the Dietetics Department at Medicover Hospital, Mumbai, emphasised that a single cup of green tea contains too little catechin to significantly reduce weight or waist size. She also highlighted that regular exercise and a balanced lifestyle play a major role in weight management. “Excessive green tea intake may harm your health by interfering with medications, reducing iron absorption, and even increasing the risk of kidney stones,” she noted.
She pointed out that while catechins and caffeine in green tea may support fat metabolism, the amount present in typical servings is very small. “It requires a lot of catechins to see measurable results, which is not practical, or advisable, because consuming that much tea would lead to excessive caffeine intake, impacting nutrient absorption.”
Panda stressed that green tea can only act as a supportive element, not a primary solution for weight loss. “There are studies showing that catechins have antioxidant properties, and caffeine may slightly boost fat burning, but the effect is modest. Claiming that green tea alone causes weight loss is misleading,” she said.
On recommended consumption, she advised, “We usually suggest two to three cups a day. Even then, it should be seen as support, not a magic solution. People need to understand that lifestyle and dietary changes are the real drivers of weight loss.”
She also cautioned specific groups about green tea intake. “Pregnant women, individuals with liver conditions, and people with iron deficiency should avoid or limit green tea, as caffeine can affect iron absorption and other health parameters. Reading product labels carefully is important to avoid being misled by exaggerated claims,” Panda added.
This story is done in collaboration with First Check, which is the health journalism vertical of DataLEADS.
BNB USD (BNBUSD) is trading at $909.82 as of January 6, 2026, showing mixed signals in the crypto market. The token gained 1.71% today despite a 0.82% decline over the past 24 hours, reflecting volatility in the broader digital asset space. With a market cap of $133 billion and trading volume of 2.08 billion, BNBUSD remains one of the most actively traded cryptocurrencies. Understanding why BNBUSD is dropping requires examining technical indicators, market sentiment, and price forecasts that suggest both near-term challenges and longer-term opportunities for traders and analysts.
BNBUSD is currently trading near its 50-day moving average of $871.94, indicating consolidation around key support levels. The token’s year-to-date performance shows a 39.21% gain, though it remains 33.6% below its 52-week high of $1,370.55. Today’s 1.71% increase suggests some buying interest despite the broader downward pressure.
The day’s trading range of $890 to $915.89 shows relatively tight price action. Volume at 2.08 billion is 60% of the 90-day average, indicating lighter participation than normal. This reduced activity often precedes larger price moves as traders await clearer directional signals.
The RSI at 57.78 sits in neutral territory, neither overbought nor oversold, suggesting balanced momentum between buyers and sellers. The MACD shows a bearish signal with the line at -9.85 below the signal line at -20.16, though the positive histogram of 10.31 indicates potential bullish divergence forming.
The ADX at 34.83 confirms a strong downtrend is in place, meaning the current directional move has conviction behind it. BNBUSD is trading just above the Bollinger Bands middle line at $863.59, with support at $818.69 and resistance at $908.49. The Stochastic %K at 80.38 signals overbought conditions on shorter timeframes, which could trigger profit-taking in the near term.
Monthly Forecast: BNBUSD is projected to reach $833.08 by end of January, representing an 8.4% decline from current levels. This downside move would test the 200-day moving average at $889.20 and could be driven by profit-taking after recent gains.
Quarterly Forecast: By end of Q1 2026, the forecast rises to $1,032.17, a 13.5% increase from today’s price. This suggests a recovery phase after the monthly pullback, potentially driven by renewed institutional interest or positive regulatory developments.
Yearly Forecast: The 12-month target sits at $810.39, indicating a 10.9% decline from current levels. This longer-term view reflects potential consolidation as the market digests recent gains. Forecasts may change due to market conditions, regulations, or unexpected events.
Trading activity shows mixed signals with volume 60% below average, suggesting traders are cautious about directional commitment. The Money Flow Index at 71.08 indicates strong buying pressure despite price weakness, a bullish divergence that often precedes reversals.
Liquidation data reveals the Awesome Oscillator at 3.56 remains positive, showing momentum hasn’t completely reversed. However, the negative OBV at -18.1 billion suggests institutional selling pressure may be building beneath the surface. This combination indicates a market in transition between downtrend and potential recovery.
BNBUSD is dropping 0.82% today primarily due to profit-taking after the 1.71% daily gain and broader crypto market consolidation. The strong ADX reading confirms sellers maintain control, though oversold conditions on the Stochastic suggest a bounce could occur soon.
The token’s position between key moving averages creates a critical decision point. A break below $890 support could accelerate the decline toward $850, while a hold above $908 resistance might trigger a recovery toward $950. Traders should watch volume closely, as the current light activity suggests the next major move will come with increased participation.
BNB serves as the native token for the Binance Smart Chain ecosystem, which continues expanding with new DeFi protocols and NFT platforms. The token’s utility in transaction fees, staking rewards, and governance gives it fundamental value beyond speculation.
The 145.9 billion shares outstanding and $133 billion market cap position BNBUSD as a top-5 cryptocurrency by market value. Recent ecosystem developments, including enhanced cross-chain bridges and layer-2 scaling solutions, provide long-term growth catalysts. These fundamentals support the quarterly forecast of $1,032.17, though near-term technical weakness suggests patience is required.
BNBUSD at $909.82 presents a complex picture for traders and analysts on January 6, 2026. The token’s 1.71% daily gain masks underlying weakness, with the 0.82% 24-hour decline and strong ADX downtrend suggesting sellers remain in control. Technical indicators show mixed signals: neutral RSI, overbought Stochastic, and bullish MACD divergence all point to a market at an inflection point.
The price forecasts reveal a near-term pullback to $833.08 followed by a recovery to $1,032.17 in Q1, suggesting volatility ahead. Traders should monitor the $890 support level closely, as a break below could accelerate losses. The reduced trading volume indicates the market awaits clearer directional signals before committing fresh capital. For longer-term holders, the yearly forecast of $810.39 and three-year target of $1,017.53 suggest BNBUSD remains within a consolidation range despite short-term weakness. Market sentiment remains cautious but not bearish, with the Money Flow Index and Awesome Oscillator suggesting institutional interest persists beneath the surface.
BNBUSD is dropping 0.82% today due to profit-taking after recent gains and a strong downtrend confirmed by the ADX at 34.83. Lighter trading volume at 60% of average suggests traders are cautious about direction. The Stochastic at 80.38 indicates overbought conditions on shorter timeframes, triggering some selling pressure.
The monthly forecast for BNBUSD is $833.08, representing an 8.4% decline from current $909.82 levels. This pullback would test the 200-day moving average at $889.20. However, the quarterly forecast rises to $1,032.17, suggesting recovery in Q1 2026 after the monthly consolidation phase.
Key support for BNBUSD sits at $890 (day low) and $818.69 (Bollinger Bands lower band). Resistance is at $908.49 (upper Bollinger Band) and $915.89 (day high). A break below $890 could accelerate decline toward $850, while holding above $908 might trigger recovery toward $950.
BNBUSD shows mixed conditions: the RSI at 57.78 is neutral, but the Stochastic %K at 80.38 signals overbought conditions on shorter timeframes. The CCI at 244.77 also indicates overbought status. This suggests potential profit-taking in the near term, supporting the monthly forecast decline to $833.08.
The yearly forecast for BNBUSD is $810.39, while the three-year target reaches $1,017.53 and five-year forecast is $1,226.93. These targets suggest BNBUSD will consolidate around current levels before trending higher over multiple years, driven by ecosystem growth and institutional adoption.
BNBUSD has a market cap of $133 billion, making it one of the top-5 cryptocurrencies globally. With 145.9 billion tokens outstanding, the token maintains significant liquidity and trading volume of 2.08 billion daily. This scale provides stability compared to smaller altcoins.
Disclaimer:
Cryptocurrency markets are highly volatile. This content is for informational purposes only.
The Forecast Prediction Model is provided for informational purposes only and should not be considered financial advice.
Meyka AI PTY LTD provides market data and sentiment analysis, not financial advice.
Always do your own research and consider consulting a licensed financial advisor before making investment decisions.
The SUI price is trading sharply higher today, outperforming several major altcoins as on-chain activity and DeFi participation picked up over the past few hours. The move is being supported by rising transactions, stable liquidity, and expanding trading volumes, suggesting this is more than a short-lived speculative spike.
SUI is currently hovering near the $1.9–$2.0 zone, with over a 25% jump in the past 24 hours. The market cap increased above $7.44 billion, while the trading volume surged by over 85%, reaching over $1.65 billion. Sui always ranks among the coins that experience significant growth whenever the market recovers. The buying power of SUI is currently very strong and overwhelming, which has helped the price to surpass the previous peaks.
Now the question arises, will the SUI price continue to rise and mark new highs?
As SUI trades higher, on-chain data offers critical insight into whether the rally is driven by speculation or real network demand. This chart from Artemis displays a comparison of Sui’s daily transactions relative to its fully diluted market cap (FDMC) with token trading volume relative to FDMC over the past three months, highlighting how usage and market activity are evolving together.

The data shows a steady increase in transaction intensity, particularly since late November, suggesting that network activity is growing faster than SUI’s valuation. This points to expanding real usage across the ecosystem, including higher smart contract and application-level interactions.
Meanwhile, trading volume relative to FDMC remains volatile and largely range-bound, marked by brief spikes rather than sustained expansion. This divergence signals that recent price strength is not being fueled by excessive speculative trading.
Overall, the decoupling between rising usage and contained speculation supports the view that SUI’s current price trend is backed by organic adoption rather than short-term hype.
Blockchain data shows a visible pickup in transaction activity during the same period SUI’s price gained momentum. Despite the price surge, capital has not exited the Sui ecosystem. Total Value Locked has remained stable to slightly positive, indicating that investors are holding positions rather than selling into strength. Moreover, DEX activity on Sui has increased meaningfully, with the volumes rising in tandem with price.


This alignment between price and usage often reflects genuine demand, not just exchange-driven trades. Higher transaction counts point to increased smart contract interactions, more active wallets and stronger short-term ecosystem usage. This behavior also contrasts with typical short-term pumps, where liquidity drains quickly. In SUI’s case, capital commitment remains intact, reinforcing the bullish structure.
SUI has entered 2026 with a notable rebound after a prolonged downtrend, putting focus back on its daily structure. The chart highlights a recovery from a clearly defined base formed in December, with price now attempting to reclaim key levels. Importantly, this move comes as trend and volume indicators begin to show early signs of improvement, suggesting the bounce may have follow-through. With Supertrend and OBV in focus, traders are now assessing whether SUI can extend toward higher resistance zones.


The daily chart shows SUI rebounding from the $1.4–$1.6 demand zone after a prolonged decline from above $3. Price is now pushing toward the Supertrend level, making $2.10–$2.20 the first upside target. A decisive Supertrend flip could open the door toward $2.35–$2.50, with $3.0 acting as a major resistance if momentum strengthens. Meanwhile, OBV has flattened and started to curl higher, signaling reduced selling pressure. A breakdown below $1.45 would invalidate this recovery setup.
SUI’s recent rebound is showing early signs of structure rather than a random relief bounce. The combination of a defended demand zone, price pressing toward the Supertrend, and improving OBV suggests selling pressure is easing. As long as SUI holds above the $1.45–$1.50 base, upside attempts toward the $2.2 and $2.5 resistance zones remain valid. However, a sustained trend reversal will only be confirmed if the price can flip the Supertrend and maintain higher volume participation. Until then, the move should be viewed as a developing recovery rather than a confirmed uptrend.
CoinPedia has been delivering accurate and timely cryptocurrency and blockchain updates since 2017. All content is created by our expert panel of analysts and journalists, following strict Editorial Guidelines based on E-E-A-T (Experience, Expertise, Authoritativeness, Trustworthiness). Every article is fact-checked against reputable sources to ensure accuracy, transparency, and reliability. Our review policy guarantees unbiased evaluations when recommending exchanges, platforms, or tools. We strive to provide timely updates about everything crypto & blockchain, right from startups to industry majors.
All opinions and insights shared represent the author’s own views on current market conditions. Please do your own research before making investment decisions. Neither the writer nor the publication assumes responsibility for your financial choices.
Sponsored content and affiliate links may appear on our site. Advertisements are marked clearly, and our editorial content remains entirely independent from our ad partners.
The EURJPY pair suffered strong negative pressures, reaching below the bullish channel’s support at 183.45 level, to suffer intraday losses by targeting 182.80 level, which forms a key support level to take advantage of its rally towards 183.40.
The confinement between extra support at 182.80 and 183.60 level makes us expect extending the support of the broken bullish channel, to keep the neutrality until confirming the trend by surpassing one of these levels, note that the price rally above 183.60 will reinforce the chances of renewing the bullish attempts, to expect targeting 184.40 barrier, and surpassing it will form next target at 184.90 level in the bullish trading.
The expected trading range for today is between 182.80 and 183.60
Trend forecast: Neutral
The EURJPY pair suffered strong negative pressures, reaching below the bullish channel’s support at 183.45 level, to suffer intraday losses by targeting 182.80 level, which forms a key support level to take advantage of its rally towards 183.40.
The confinement between extra support at 182.80 and 183.60 level makes us expect extending the support of the broken bullish channel, to keep the neutrality until confirming the trend by surpassing one of these levels, note that the price rally above 183.60 will reinforce the chances of renewing the bullish attempts, to expect targeting 184.40 barrier, and surpassing it will form next target at 184.90 level in the bullish trading.
The expected trading range for today is between 182.80 and 183.60
Trend forecast: Neutral
India is witnessing a profound transformation in how its citizens approach health and wellness. The nutritional supplements market of the country has evolved from a niche segment into a mainstream industry serving millions of health-conscious consumers. This shift reflects changing lifestyles, increased awareness about preventive healthcare, and growing disposable incomes. The market encompasses protein powders, vitamins and minerals, omega fatty acids, probiotics, herbal supplements, and sports nutrition formulations, catering to diverse segments from fitness enthusiasts to senior citizens. According to IMARC Group, the market was valued at USD 20.64 Billion in 2024, and it is projected to reach USD 57.53 Billion by 2033, at a CAGR of 11.14% during the forecast period (2025-2033).
Explore in-depth findings for this market, Request Sample
The contemporary Indian consumer has fundamentally altered their relationship with health and nutrition. Preventive healthcare has emerged as a priority, driven by increased health literacy and awareness campaigns. This paradigm shift has positioned nutritional supplements as essential components of daily wellness routines.
Young professionals and urban millennials view supplements as investments in long-term health outcomes. Immunity boosting has particularly resonated with vitamin C, vitamin D, zinc, and herbal formulations becoming household staples integrated into morning routines.
The fitness revolution has created massive demand for protein supplements and performance enhancers. Gym memberships have surged, home workout culture has flourished, and running communities have expanded exponentially. These enthusiasts view supplementation as fundamental to achieving their health goals.
Senior citizens represent another significant segment, increasingly recognizing the value of targeted nutritional support. Joint health supplements, calcium formulations, and multivitamins tailored for older adults have found substantial traction, often influenced by healthcare professionals.
Working adults facing demanding schedules have turned to supplements as convenient solutions for nutritional gaps. Energy boosters, stress management formulations, and cognitive support supplements address modern corporate life challenges.
The India nutritional supplements market presents a compelling growth story driven by demographic and economic factors. India’s large young population combined with rising per capita incomes creates an ideal environment for market development.
Protein powders have transcended bodybuilding to become mainstream nutritional products. Whey protein, plant-based protein, and blended formulations cater to diverse dietary preferences at multiple price points, making supplementation accessible to middle-class consumers.
Vitamin and mineral supplements represent the most established category with consistent demand. Single-vitamin formulations compete alongside comprehensive multivitamins, normalized through public health campaigns as preventive health measures.
Gummy vitamins have emerged as innovative products appealing to younger consumers and parents seeking child-friendly options. These combine functional benefits with enjoyable consumption experiences, successfully penetrating markets where traditional formats faced resistance.
Herbal and ayurvedic supplements leverage India’s traditional medicine heritage, resonating with consumers seeking natural wellness solutions. Ashwagandha and turmeric have been reformulated into convenient modern formats, bridging ancient wisdom with contemporary lifestyles.
Sports nutrition constitutes a high growth subsegment driven by fitness culture proliferation. Pre-workout formulations, post-workout recovery products, and amino acid supplements serve increasingly sophisticated consumer needs beyond elite athletes.
Organized retail expansion, modern trade channels, and e-commerce infrastructure have dramatically improved product accessibility. Consumers in tier-two and tier-three cities now access brands previously available only in metropolitan markets, unlocking new growth opportunities.
The fitness ecosystem in India has undergone remarkable expansion, creating substantial demand for nutritional supplements. Commercial gyms have proliferated with growing memberships, serving as important distribution and recommendation channels where trainers influence purchasing decisions.
Home fitness gained unprecedented momentum, with consumers investing in equipment and following digital workout programs. This expanded the market beyond traditional gym-goers to home exercisers. Online fitness platforms have democratized professional guidance while normalizing supplement consumption.
The running community has experienced explosive growth, with marathons attracting thousands of participants. Endurance athletes require specialized nutritional support including energy gels, electrolyte supplements, and recovery formulations. Running clubs facilitate knowledge sharing about supplementation strategies.
Whey protein has become synonymous with muscle building, establishing itself as the cornerstone sports nutrition product. Multiple domestic and international brands compete intensely, offering products with varying protein concentrations, flavors, and value propositions. For instance, in June 2025, Nutrabay announced the release of BioAbsorb, a next-generation whey protein intended to address poor absorption and digestive pain, two of the most prevalent but untreated problems that protein consumers encounter. Similarly, GNC Pro Performance 100% Whey + Keto Surge, a cutting-edge protein supplement that combines premium whey protein with fat-burning ingredients to support weight loss and lean muscle gain, has been introduced by GNC in May 2025.
Functional fitness and CrossFit-style workouts have introduced consumers to specialized supplements including branched-chain amino acids (BCAAs), creatine, and beta-alanine. Fitness influencer content has accelerated awareness and adoption of these performance products.
Women’s fitness has emerged as a distinct rapidly growing segment, with products formulated for female physiology addressing hormonal balance, bone health, and lean muscle development. Destigmatization of strength training among women has opened substantial opportunities.
Supplement brands have strategically partnered with gyms, fitness studios, and sports academies for brand awareness and trial. In-gym sampling, trainer endorsements, and co-branded events create multiple touchpoints with high-intent consumers, building credibility during the consideration phase.
The digital revolution has transformed how Indian consumers discover and purchase nutritional supplements. Online pharmacies have emerged as preferred destinations, offering convenience, competitive pricing, and extensive selection. Consumers can compare formulations, read reviews, and access detailed product information.
Direct-to-consumer (D2C) brands have disrupted traditional distribution by building direct customer relationships. These digitally native brands leverage social media, content marketing, and influencer partnerships to build awareness. By eliminating intermediary margins, many offer competitive pricing while maintaining premium positioning through brand storytelling.
Fast delivery capabilities have become essential, with leading platforms offering same-day or next-day delivery in major cities. Quick commerce platforms deliver supplements within hours of ordering, addressing the immediacy barrier to online purchasing.
Influencer marketing has proven exceptionally effective where trust influences decisions. Fitness influencers, nutritionists, and wellness creators provide authentic recommendations resonating with followers. User-generated transformation stories create powerful social proof driving conversions.
Subscription models have gained traction with recurring deliveries offering pricing benefits and eliminating reordering friction. Brands benefit from predictable revenue streams and increased customer lifetime value.
Personalization has emerged as a differentiator, with platforms offering customized recommendations based on health assessments and fitness goals. AI-driven engines analyze inputs to suggest optimal product combinations, enhancing satisfaction and average order values.
Digital payment infrastructure enables seamless transactions through wallets, UPI, cards, and buy-now-pay-later schemes. Educational content marketing—through blogs, videos, and podcasts—positions brands as trusted information sources, building credibility that translates into sales.
The India nutritional supplements market features dynamic competition with domestic players, multinationals, and D2C brands vying for market share, offering consumers extensive choice while driving innovation and competitive pricing.
The India nutritional supplements market stands poised for sustained expansion driven by fundamental shifts in consumer behavior and health consciousness. The convergence of rising incomes, increased health awareness, digital infrastructure development, and demographic advantages creates a uniquely favorable environment.
The transition from reactive to preventive healthcare represents a cultural shift with lasting implications. Consumers increasingly view supplements as long-term wellness investments rather than immediate health responses, creating sustained demand beyond short-term trends.
Innovation in product formats, delivery mechanisms, and personalization will differentiate successful brands. Companies investing in understanding evolving consumer needs will capture disproportionate market share. Technology, data analytics, and consumer insights integration will separate market leaders.
Opportunities ahead are substantial for stakeholders across the value chain. Strategic investments in distribution infrastructure, brand building, and consumer education will yield significant returns as the market matures. What developments will shape the next chapter of India’s nutritional supplements revolution?
At IMARC Group, we empower businesses with intelligence to succeed in India’s evolving wellness market.