The main category of All News Articles.
You can use the search box below to find what you need.
[wd_asp id=1]
The main category of All News Articles.
You can use the search box below to find what you need.
[wd_asp id=1]
Many of us have made our list of resolutions for the New Year, and some of those resolutions involve health and fitness. We’ve decided to get healthy and believe that the answers lie in exercise, diet, social interaction for mental health — and vitamin supplements.
Of those, the one that puts up red flags is the vitamin supplements. If we don’t know what we’re doing, however, we can cause problems because what we take might be unsafe.
National Institutes of Health has explored the topic — https://tinyurl.com/Supplements-for-Older-Adults — and the site is full of caveats and warnings.
To be considered:
• If you’re hunting for supplement information on the internet or by watching TV ads, be wary about who is behind it. Do they have a reason — such as profit — for promoting a certain supplement?
• Remember that more is not necessarily better. Too much “more” of any supplement might be harmful to you.
Check the NIH dietary supplement database at dsld.od.nih.gov. They have over 200,000 supplements listed, and you can search by product, brand or ingredient.
Before you start taking supplements, talk to your doctor. You might be advised to make some adjustments to your diet instead, or they might know of a reason in your medical profile that indicates a certain supplement could cause problems for you.
The NIH also recommends looking at the Dietary Guidelines for Americans, 2020-2025, a free publication online at https://tinyurl.com/Make-Every-Bite-Count. There is a whole section for older adults.
When it comes to our prescription drugs, we need to be aware there, as well. To check for any interactions with drugs you are taking, go to drugs.com, click “Drugs Interaction Checker” and enter the drug name. You’ll get a result that shows any interactions, as well as warnings, side effects and uses of the drug.
Here’s to a healthy 2026 — with or without vitamin supplements!
Join Our Telegram channel to stay up to date on breaking news coverage
The Ethereum price prediction reveals that ETH remains one of the most influential assets in the crypto market, serving as the foundation for decentralized finance, NFTs, and smart contract innovation.
Being an early adopter of transformative crypto projects has often proven to be one of the biggest advantages for long-term investors, and Ethereum is a textbook example of this principle in action. From its all-time low recorded in October 2015, ETH has surged by an extraordinary +706,595.55%, highlighting how early exposure to strong fundamentals and real utility can deliver outsized returns over time. Even today, despite short-term price fluctuations between roughly $2,891 and $2,991 in the past 24 hours and trading nearly 40% below its all-time high of $4,953.73, Ethereum continues to demonstrate why early conviction matters. As the backbone of smart contracts, DeFi, NFTs, and countless blockchain innovations, ETH shows that identifying high-potential projects early, before mainstream adoption, can be far more impactful than trying to time perfect entries later in the cycle.
Key Levels:
Resistance levels: $3,600, $3,800, $4,000
Support levels: $2,300, $2,100, $1,900

At the time of analysis, ETH/USD is trading around $2,976, following a mild rebound from the lower boundary of its descending channel on the daily chart. This recovery suggests that buyers are beginning to show interest near key demand levels, although the broader trend still reflects consolidation after a prolonged corrective phase. Price action remains compressed between dynamic trendlines, indicating that a decisive breakout or breakdown may be approaching.
From a technical standpoint, Ethereum is hovering just below the 21-day moving average while the 9-day moving average is attempting to flatten, signaling slowing bearish momentum. The inability to reclaim and hold above these short-term moving averages keeps ETH vulnerable to renewed selling pressure. However, a sustained close above the 21-day MA would strengthen bullish conviction and could open the door for a push toward the descending channel’s upper boundary.
Be Ready For This ETH Move
Looking upward, the first major hurdle for bulls sits at $3,600, which aligns with prior resistance and the upper structure of the channel. A clean breakout above this level could trigger accelerated upside toward $3,800 and potentially $4,000, where stronger supply is expected. Such a move would likely require a noticeable expansion in volume to confirm that buyers have regained control of the trend. On the downside, failure to maintain current levels may expose Ethereum to renewed weakness. A decisive drop below the lower channel support could send ETH/USD toward the $2,300 support zone, with additional downside risk extending to $2,100 and $1,900 if bearish momentum intensifies. For now, Ethereum (ETH) sits at a critical inflection point, where holding above structural support keeps recovery hopes alive, while rejection from moving averages may prolong consolidation or trigger another leg lower.
On the daily chart, ETH/BTC is currently trading around 0.0335 BTC (≈ 3,351 SAT), consolidating within a well-defined descending channel that has guided price action since the September peak. The pair recently rebounded from the lower boundary of this channel near 0.0310 BTC (≈ 3,100 SAT), signaling that buyers are actively defending this support zone. However, price remains capped below the 21-day moving average, while the 9-day moving average continues to act as short-term resistance, suggesting that bullish momentum is still tentative and the broader structure remains corrective rather than impulsive.
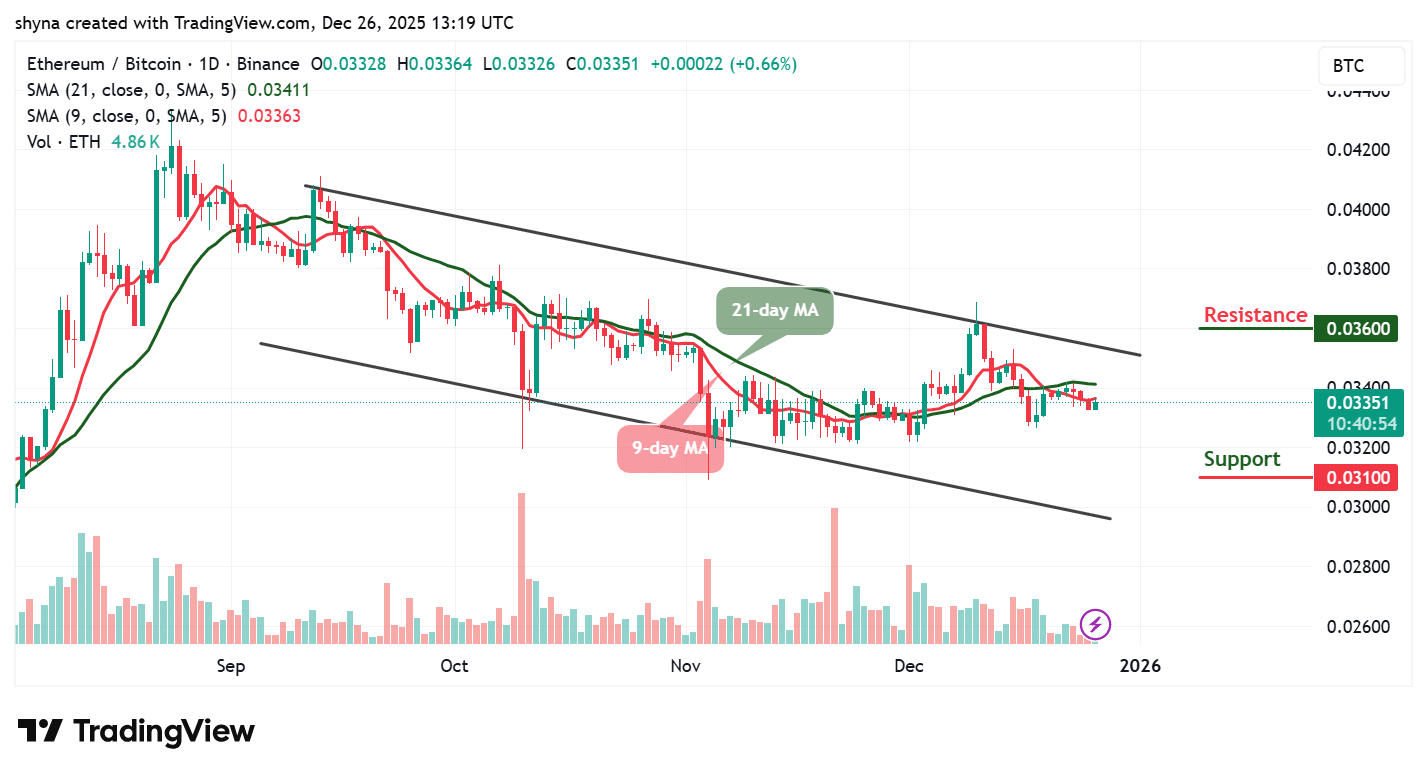
Technically, the next directional move will depend on how ETH/BTC reacts around the mid-channel and moving average cluster. A sustained daily close above the 21-day MA would improve the bullish outlook and could allow price to grind higher toward the key resistance at 0.0360 BTC (≈ 3,600 SAT), where sellers previously stepped in aggressively. A breakout above this level would signal relative strength for Ethereum against Bitcoin and potentially mark the beginning of a trend shift. Conversely, failure to hold above 3,300 SAT may invite renewed downside pressure, exposing ETH/BTC to another test of the 3,100 SAT support, with a breakdown likely extending losses toward the lower channel boundary.
Moreover, @0xPepesso, who has over 156k followers on X (formerly Twitter), shared a bullish outlook on $ETH, noting that the price appears to be on the verge of a breakout after tightening within a falling channel around a major demand zone. According to the analysis, selling pressure is clearly weakening, suggesting that momentum may be shifting in favor of the bulls, with a potential move opening up toward the $5,000 level, adding a confident reminder that the signal shouldn’t be ignored.
$ETH IS MOMENTS AWAY FROM A BREAKOUT
Price is compressed inside a falling channel at a key demand zone
Selling pressure is fading
Next target: $5,000
Don’t say, I didn’t warn you! pic.twitter.com/j2ohb2JQ1p
— Pepesso (@0xPepesso) December 26, 2025
Nevertheless, Ethereum’s current price action reflects a market under pressure but quietly building energy for a decisive move. The crypto analyst above, @0xPepesso, highlights fading selling pressure and a potential breakout from a compressed structure at a key demand zone, which closely aligns with the broader chart analysis showing a rebound from channel support and tightening price action. While the technical outlook remains cautious, with price still constrained by moving average resistance and a descending channel, the flattening short-term averages suggest bearish momentum is weakening. Overall, both perspectives point to Ethereum approaching a critical inflection point, where sustained buying interest could trigger an upside breakout, while rejection at key technical barriers may prolong consolidation before the next major move.
Best Wallet – Diversify Your Crypto Portfolio

Join Our Telegram channel to stay up to date on breaking news coverage
Updated: 26.12.2025 | 10:14 a.m. EST
U.S. natural gas is ending the week with a familiar winter push-and-pull: colder early‑January forecasts and strong LNG demand on one side, near‑record production and still‑healthy storage on the other.
In holiday-thinned trade on Friday morning, NYMEX Henry Hub natural gas (January 2026) hovered around the mid‑$4.30s per MMBtu, extending a rebound that traders are tying to colder model runs and steady export pulls. Barchart showed NGF26 near $4.342/MMBtu mid‑morning, while market reporting also pegged the contract around $4.29/MMBtu earlier in the session. [1]
Below is what’s moving natural gas today (26.12.2025) across news, forecasts, and market analysis, including the next big catalysts traders are watching into year-end.
With many participants out for the holidays, liquidity is thinner than usual—and that can exaggerate moves in either direction.
This is also a notable moment on the calendar: Barchart lists expiration timing for NGF26 approaching at the end of December, which tends to accelerate position‑rolling and can add noise to day-to-day price action. [4]
Bottom line: Friday’s tape is being shaped not only by fundamentals, but also by holiday liquidity and the late‑month contract transition—a mix that often increases volatility.
The central driver in U.S. winter gas is still the same metric traders watch every day: heating demand.
Market reporting on Friday tied the bounce to forecasts pointing to colder conditions and higher demand into early January, particularly across the eastern half of the U.S. [5]
One way to translate that into market language is with Heating Degree Days (HDDs), a key proxy for heating demand:
This nuance matters. Natural gas can rally sharply on model runs that “turn colder,” but if temperatures remain below-normal vs. normal on the HDD scale, upside can be capped—especially with production running hot.
If weather is the spark, production is the wet blanket.
Friday’s reporting cited Lower 48 output at a record-high pace in December, around 109.8 bcfd, topping November’s record. [7] That level of supply matters because it reduces how quickly cold weather can tighten the market—unless demand spikes hard.
EIA’s latest Short‑Term Energy Outlook (released December 9) also frames the same story for 2026: rising production is expected to help moderate prices after winter, with U.S. dry gas output forecast around 109 Bcf/d in 2026. [8]
Translation: Even if early January turns colder, the market’s immediate question becomes: Is it cold enough to overwhelm record supply and strong LNG pulls?
LNG is a structural pillar under U.S. natural gas demand—and it has been especially important this year.
Friday market reporting said gas flows to the eight large U.S. LNG export plants averaged about 18.4 bcfd so far this month, near record territory. [9]
There’s also a plant‑specific note that traders watch because it can swing feedgas quickly:
From a macro perspective, EIA’s December STEO points to LNG exports staying elevated longer-term, projecting U.S. LNG exports at 14.9 Bcf/d in 2025 and 16.3 Bcf/d in 2026. [11]
And while U.S. LNG remains globally significant, Reuters data-driven analysis notes that Asia’s LNG imports from the U.S. fell in 2025 versus 2024, highlighting how trade policy and shifting demand patterns can influence where U.S. cargoes ultimately land. [12]
For U.S. natural gas, weekly storage is the scoreboard—and the schedule matters this week.
EIA’s official schedule shows the Weekly Natural Gas Storage Report was shifted to Monday, December 29, 2025 at 12:00 p.m. ET due to the Christmas holiday, with another holiday adjustment set for Wednesday, December 31 at 12:00 p.m. ET. [13]
Barchart also referenced the same holiday shift, underscoring how widely traders are focused on the Monday release. [14]
EIA’s Natural Gas Weekly Update (release date December 18, covering the week ending December 17) reported:
In the December STEO, EIA outlined why its winter price forecast moved higher: it assumed December would be colder than previously modeled and projected heavier withdrawals—expecting 580 Bcf of inventory withdrawals in December, notably above the five‑year average for the month. [16]
Why this matters for Monday: If the next storage figure shows a draw that surprises to the upside (bigger withdrawal), it can validate the “colder + tight balance” narrative. A softer draw would strengthen the argument that record production and comfortable inventories can absorb winter demand.
Supply isn’t only a function of the weather—it’s also a function of how aggressively producers drill.
The most recent Baker Hughes data (reported by Reuters) showed:
That headline number alone doesn’t guarantee higher output (productivity and associated gas matter), but it supports the broader theme seen across multiple sources: the U.S. system has been producing at exceptionally high levels—even as the market tries to price winter risk.
EIA’s STEO also noted that updated assumptions about gas-to-oil ratios (GORs), especially in the Permian, contributed to a higher production outlook. [18]
U.S. natural gas is increasingly tied to global gas pricing—because global prices help determine how “sticky” U.S. LNG demand will be.
A Reuters global LNG market update (published Dec 24) put February-delivery LNG into Northeast Asia around $9.60/mmBtu, slightly higher on the week—but still reflecting a generally soft market, with prices down significantly year-to-date. [19]
That same reporting highlighted:
Europe remains the “balancing market” when LNG is abundant. An Investing.com market analysis (published Dec 25) cited Europe’s gas storage level around 66.1% as of Dec 24, below average and below last year. [21]
Meanwhile, the Reuters LNG market update noted that European gas prices ticked up in thin trade on cold-spell forecasts, and also described firm buying interest into early Q1 2026 in parts of Central and Eastern Europe, tied to concerns about pipeline flows and regional supply needs. [22]
Two Russia-linked developments are shaping longer-term supply expectations:
These shifts don’t directly set Henry Hub on any given day, but they do influence global LNG supply/demand expectations—which can feed back into U.S. LNG economics and, ultimately, U.S. gas balances.
A widely read Reuters Breakingviews column published today adds a longer-horizon angle: as major producers plan aggressive LNG capacity growth into 2030, the rapid cost declines and fast deployment of renewables (plus grid storage) could undercut future LNG demand growth—raising the risk of an oversupply cycle later in the decade. [25]
That matters even for today’s market because long-dated gas pricing and LNG contracting influence investment decisions, forward curves, and producer behavior—all of which shape how tight (or loose) the market can become in future winters.
Here are the near-term catalysts most likely to move U.S. natural gas into year-end:
EIA’s December STEO provides the clearest “official” baseline:
That forecast lines up with what Friday’s market is pricing in: winter risk still matters, but the ceiling is debated because supply is robust and the system entered winter with above-average inventories. [33]
Natural gas is trading like a winter market again—weather-led, headline-sensitive, and increasingly tied to LNG flows. The next test is whether the colder outlook translates into a storage draw strong enough to overcome the market’s most stubborn counterweight: record U.S. production. [34]
1. www.barchart.com, 2. www.barchart.com, 3. www.worldenergynews.com, 4. www.barchart.com, 5. www.worldenergynews.com, 6. www.worldenergynews.com, 7. www.worldenergynews.com, 8. www.eia.gov, 9. www.worldenergynews.com, 10. www.worldenergynews.com, 11. www.eia.gov, 12. www.reuters.com, 13. ir.eia.gov, 14. www.barchart.com, 15. www.eia.gov, 16. www.eia.gov, 17. www.reuters.com, 18. www.eia.gov, 19. www.brecorder.com, 20. www.brecorder.com, 21. www.investing.com, 22. www.brecorder.com, 23. www.reuters.com, 24. www.reuters.com, 25. www.reuters.com, 26. ir.eia.gov, 27. www.worldenergynews.com, 28. www.worldenergynews.com, 29. www.worldenergynews.com, 30. www.brecorder.com, 31. www.eia.gov, 32. www.eia.gov, 33. www.eia.gov, 34. www.worldenergynews.com
NEW DELHI-India’s food safety regulator has tightened the rules on what can be officially called “tea”, making it clear that only products made from the plant Camellia sinensis can use the word on their labels.
In a directive, the Food Safety and Standards Authority of India (FSSAI) said that many food business operators are wrongly using the term “tea” for herbal infusions and plant-based drinks that are not made from Camellia sinensis. According to the regulator, this practice is misleading consumers and amounts to misbranding.
The FSSAI said it found several products in the market being sold as “Rooibos tea”, “herbal tea” and “flower tea”, even though these beverages are not derived from the tea plant. The authority clarified that such products do not meet the legal definition of tea and therefore cannot be marketed using that name.
As per existing regulations, only infusions made from Camellia sinensis qualify as tea. This includes well-known varieties such as green tea, Kangra tea and instant tea. Any drink made from other plants, herbs or flowers does not fall under this category.
The regulator has warned all food business operators, to stop using the word “tea” directly or indirectly for products that are not derived from Camellia sinensis. Failure to comply, it said, will be treated as a violation of food safety laws. (IANS)

Hoskinson’s argument centers on Bitcoin’s fixed supply colliding with steadily rising demand from large investors, as per a report. With only a limited number of bitcoins available, any increase in demand can have an outsized effect on price. He highlighted that dynamic is becoming more important as institutions continue to enter the market, as per a Coinpedia report.
Large financial players, including institutions, corporations, and even some governments, are gradually adding Bitcoin to their portfolios. Access for individual investors is also expanding through traditional finance channels.
Also read: Can your dog be a tax dependent? Woman takes IRS to court in legal battle
Morgan Stanley now allows its private wealth advisers to recommend Bitcoin to clients, lowering barriers to entry. Even relatively small allocations from retirement funds and wealth managers can matter because Bitcoin’s supply does not adjust to higher demand, as per the Coinpedia report.
Hoskinson said that the same forces that pushed Bitcoin into six-figure territory remain in place. Institutional investors, he notes, tend to buy consistently and hold for the long term, creating steady buying pressure rather than short-term speculation, as per the Coinpedia report. As more financial products tied to Bitcoin become available, demand could continue to broaden.
Also read: Social Security falling short? These 6 income streams can turn retirement into a paycheck
Another factor is Bitcoin’s growing role in decentralized finance as new systems are being built that allow Bitcoin holders to earn yield without giving up control of their assets, as per the Coinpedia report. If these tools gain traction, then significant Bitcoin value could gradually move into the wider crypto ecosystem.
While Hoskinson expects some capital to rotate from Bitcoin into altcoins, Hoskinson cautions that it may not resemble the strong altcoin rally seen in 2021. He points to a more uncertain global economic environment and ongoing regulatory questions in the United States.
Hoskinson also flagged risks tied to broader markets. He noted that parts of the technology sector, particularly artificial intelligence stocks, appear highly valued. Companies such as Nvidia have reached very large market capitalizations, and he warned that a tech-sector downturn could spill over into crypto markets, which often move in the same direction as tech stocks.
He said, “I also believe there’s going to be some value leakage from Bitcoin into the altcoin space. Whether it will be proportionate like in 2021, when a $68,000 Bitcoin translated into $3 ADA and an all-time high for Ethereum, is hard to say,” as quoted by the Coinpedia report.
Who predicted Bitcoin could reach $250,000 by 2026?
The prediction was made by Cardano founder Charles Hoskinson.
Why does Hoskinson believe Bitcoin can rise further?
He says Bitcoin’s fixed supply combined with growing institutional demand supports higher prices.

Gold and silver price today, prediction and forecast remained supported due to expectations of lower U.S. interest rates. Spot gold rose 0.8 percent to $4,516.50 per ounce at 0933 GMT. Gold touched a record of $4,530.60 earlier. U.S. gold futures for February delivery rose 1 percent to $4,547.70.
UBS analyst Giovanni Staunovo said demand for gold and silver remains strong due to expectations of lower U.S. interest rates. He also said low liquidity is increasing volatility in precious metals markets.
Gold and silver price today, prediction and forecast also reflects gold’s strongest yearly performance since 1979. Several factors supported this trend. These include Federal Reserve policy easing, central bank purchases, ETF inflows, and reduced reliance on the U.S. dollar.
Markets expect two interest rate cuts next year. These expectations are based on signals of a more flexible Federal Reserve approach. Gold remains supported as it does not offer yield but benefits from lower rates.
Gold and silver price today, prediction and forecast also reflects physical market activity. Gold discounts in India widened to the highest level in more than six months. In China, discounts narrowed compared to last week. Earlier, China discounts had reached a five-year high.
These changes indicate varied demand conditions across major consumer markets. Pricing remains sensitive to local demand and currency movement.
Gold and silver price today, prediction and forecast highlights silver’s sharp rise. Spot silver rose 4 percent to $74.82 per ounce. It reached an all-time high of $75.14 earlier in the session. Silver prices have risen 158 percent so far this year.
The rise is linked to supply shortages, its classification as a U.S. critical mineral, and industrial demand. Silver continues to attract attention from investors seeking alternatives to gold.
Gold and silver price today, prediction and forecast also includes movement in platinum and palladium. Spot platinum rose 7.3 percent to $2,382.35 per ounce. It earlier reached a record high of $2,448.25. Palladium rose 8.3 percent to $1,823.76.
Both metals are used in automotive catalytic converters. Prices increased due to supply constraints, tariff uncertainty, and shifting investment interest. Platinum is up around 170 percent this year. Palladium is up more than 90 percent.
Gold and silver price today, prediction and forecast also reflects policy developments. Staunovo said platinum and palladium markets are smaller than the gold market. Limited investor activity can cause sharp price movement.
He also noted that the European Commission’s plan to ease the 2035 ban on combustion engines has supported prices. This policy change increased expectations for continued demand in automotive use.
Gold and silver price today, prediction and forecast shows all precious metals heading for weekly gains. Platinum recorded its strongest weekly rise on record. Market participants continue to track interest rate signals and supply conditions.
Precious metals remain sensitive to global economic signals. Investor focus remains on monetary policy, industrial demand, and geopolitical developments.
Q1: Why are gold and silver prices rising today?
Gold and silver price today, prediction and forecast shows prices rising due to rate cut expectations, global uncertainty, supply shortages, and increased investment demand across precious metals markets.
Q2: What is the outlook for gold and silver prices?
Gold and silver price today, prediction and forecast suggests prices may remain supported as long as rate cut expectations, central bank buying, and industrial demand continue.
Many health-conscious people start their day by taking supplements and vitamins as part of their morning routine, right alongside breakfast or a cup of coffee. They do it to boost energy, immunity, bone strength, or overall wellness.
Creatine is one such supplement that has become a common staple in supplement aisles. It has reputation of being something only necessary for people who work out heavily.
Athletes use it to sprint harder, lift heavier, and recover faster, so plenty of people treat it as a “gym thing.” In simple terms, creatine acts like a quick-charge backup system for cells that burn through energy fast.
Cells run on energy every second of every day, then they spend it in a form called Adenosine triphosphate (ATP).
ATP works as the main “spendable” energy molecule, but cells burn through it quickly during intense exercise, illness, missed sleep, or other high-demand stress.
Creatine helps by storing energy in phosphocreatine, which can help rebuild ATP when demand spikes. This setup works as a “quick-recharge system.”
One report also links this backup to cell protection during metabolic stress, when tissues need fast energy support to stay stable.
People still ask, “Is creatine safe?” A major safety analysis led by a long-time creatine researcher focuses on results from controlled scientific studies instead of word-of-mouth warnings.
According to Dr. Richard Kreider, a professor and director of the Exercise & Sport Nutrition Lab at Texas A&M University, creatine is crucial for human bodies to function at full capacity.
“When the body is stressed, like in exercise or under metabolic conditions like some diseases, creatine phosphate is needed to maintain energy in the cell, and therefore has a lot of protective and health benefits, in addition to the exercise performance effects that have been seen,” explained Kreider, who has spent more than 30 years studying creatine.
In a comprehensive study, Kreider’s team reviewed hundreds of clinical trials and compared side effects in people who took creatine with people who took a placebo. They did not see meaningful differences in side-effect rates between the groups.
Many of the loudest claims of side effects come as personal stories: “My friend felt bloated,” “Someone online said it hurt kidneys,” “A coach warned me about cramps.”
Kreider’s study refutes those claims, showing that creatine can actually help the body hold onto more fluid, and that may reduce cramping in some situations. People vary, but the strongest evidence does not match the most common fears.
Your body can make creatine from amino acids and move it through the bloodstream to tissues that need quick energy support. Kreider’s study puts that internal production at about one gram each day.
However, the recommended daily amount is to get two to four grams of creatine per day, depending on muscle mass and activity levels.
“You only get about a gram of creatine per pound of red meat or fish, like salmon, so it’s expensive and takes a lot of calories to get a gram,” Kreider noted.
That is a lot of food if your main goal is simply to raise creatine intake, which helps explain why creatine supplements exist.
Vegetarians and vegans often start with lower creatine stores because they get little creatine through diet, so they may see a more noticeable benefit when they supplement.
A separate study from Virginia Tech explains that creatine plays a vital role in the brain’s energy system, but it also points to effects beyond “energy.”
“Creatine is very crucial for energy-consuming cells in skeletal muscle throughout the body, but also in the brain and in the heart,” said Chin-Yi Chen, a research scientist at Virginia Tech’s Fralin Biomedical Research Institute.
Chen is working with a research team that is developing a new way to send creatine directly into the brain using focused ultrasound.
The project takes place in the lab of Cheng-Chia “Fred” Wu, an assistant professor at the Fralin Biomedical Research Institute.
The human brain works nonstop. Neurons fire, support cells keep the chemical environment steady, and energy demand stays high from morning to night.
Creatine can influence neurotransmitter systems, especially pathways involving GABA, a major inhibitory neurotransmitter that helps prevent neurons from becoming overly excitable.
This fact is important because brain function depends on both steady fuel and balanced signaling. When neurons lose either one, circuits can misfire or struggle to adapt.
That helps explain why many studies associate creatine with learning, memory, brain development, and seizure control.
The brain sits behind the blood-brain barrier, a tight filter built from cells that line brain blood vessels. It blocks many toxins and pathogens from reaching brain tissue, and that protection saves lives. It can also limit access for helpful compounds.
Wu’s study at Virginia Tech describes people with creatine deficiency disorders who can improve muscle mass and body weight with supplements, yet still struggle with neurodevelopmental challenges.
These include difficulties with speech, reading, or writing because the brain does not receive enough creatine through normal routes.
That challenge puts the creatine delivery system at the center of their work. The researchers describe a project that uses therapeutic focused ultrasound to temporarily open access across the blood-brain barrier in a precise, targeted way.
Focused ultrasound uses carefully aimed sound waves to create a short window that can let treatments reach specific brain areas without damaging nearby healthy tissue.
The report notes that the lab has explored focused ultrasound approaches in other contexts, such as pediatric brain cancer, and now sees potential for creatine deficiency conditions as well.
Despite strong scientific evidence, Kreider says people have misunderstood creatine for years and often spread false claims about it.
He is one of the members of the International Society of Sports Nutrition who recently signed a letter stating that creatine is safe and effective and calling on policymakers not to limit public access to it.
“There’s absolutely no data supporting any negative side effect anecdotally reported about creatine on the internet and in the media,” Kreider enthused. “Creatine is safe, and it’s important for everybody, not just bodybuilders and athletes.”
The work keeps moving from “Does it work?” to “Can we deliver it where it’s needed most?” That question changes the discussion from sports performance to medical delivery, where the details of human biology decide what happens next.
—–
Like what you read? Subscribe to our newsletter for engaging articles, exclusive content, and the latest updates.
Check us out on EarthSnap, a free app brought to you by Eric Ralls and Earth.com.
—–
BitcoinWorld
Polygon Price Prediction: Will MATIC’s Explosive Growth Reach $1 by 2030?
As the cryptocurrency market continues to evolve, investors are watching Polygon (MATIC) with intense interest. The burning question on everyone’s mind: can MATIC achieve the elusive $1 milestone in the coming years? With its position as a leading Layer 2 scaling solution for Ethereum, Polygon has transformed from a promising project to a fundamental infrastructure component of the blockchain ecosystem. This comprehensive analysis examines MATIC’s potential trajectory through 2026, 2027, and beyond to 2030, providing you with data-driven insights and expert perspectives on whether this ambitious price target is within reach.
Polygon has established itself as a critical player in solving Ethereum’s scalability challenges. The network processes transactions faster and at significantly lower costs than the Ethereum mainnet, making it attractive for developers and users alike. As of current market conditions, MATIC faces both opportunities and challenges. The broader crypto market sentiment, regulatory developments, and technological advancements within the Polygon ecosystem will all influence its price trajectory. The network’s active development, including Polygon 2.0 upgrades and zero-knowledge technology integration, positions it for potential growth if adoption continues to accelerate.
Looking toward 2026, several factors will shape MATIC’s price movement. Analysts consider multiple scenarios based on market conditions, adoption rates, and technological milestones. A conservative estimate suggests gradual growth if current trends continue, while bullish scenarios depend on widespread institutional adoption and successful implementation of Polygon’s roadmap. Key considerations include:
| Scenario | 2026 Price Range | Key Drivers |
|---|---|---|
| Conservative | $0.45 – $0.65 | Moderate adoption, steady market growth |
| Moderate | $0.65 – $0.85 | Strong developer growth, Ethereum scaling needs |
| Bullish | $0.85 – $1.10 | Mass adoption, major partnerships, market surge |
By 2027, Polygon’s technological advancements should be more fully realized. The implementation of Polygon 2.0, featuring a unified liquidity layer and enhanced zero-knowledge proofs, could significantly boost network efficiency and appeal. If Ethereum maintains its dominant position and Polygon continues to capture scaling demand, MATIC could experience substantial appreciation. However, investors must remain aware of potential headwinds including regulatory changes, technological disruptions from competitors, and macroeconomic factors affecting all cryptocurrency investments. The MATIC surge potential in 2027 depends heavily on whether the network can maintain its competitive advantages while expanding its use cases beyond simple transaction scaling.
The 2030 outlook for Polygon represents the most speculative but potentially rewarding timeframe. By this point, blockchain technology should be more integrated into mainstream applications, and scaling solutions will be essential infrastructure. Polygon’s success in establishing itself as the go-to Layer 2 solution could position MATIC for significant value appreciation. Long-term crypto forecast models suggest that if Polygon captures even a moderate percentage of the projected global blockchain transaction volume, its token economics could support substantially higher valuations. However, this distant horizon requires considering technological obsolescence risks, the evolution of Ethereum itself, and potential paradigm shifts in blockchain architecture.
The $1 price point represents both a psychological milestone and a significant valuation increase from current levels. Achieving this target depends on several converging factors:
Historical patterns suggest that MATIC tends to perform well during periods of Ethereum network congestion, as users seek cheaper alternatives. However, sustained growth requires more than temporary congestion-driven demand.
No investment comes without risks, and Polygon faces several significant challenges. The competitive landscape for Layer 2 solutions is intensifying, with projects like Arbitrum, Optimism, and emerging zero-knowledge rollups vying for market share. Regulatory uncertainty surrounding cryptocurrency tokens, particularly those classified as securities, could impact MATIC’s trading and adoption. Additionally, technological risks include potential vulnerabilities in Polygon’s architecture or failure to keep pace with Ethereum’s own scaling improvements through initiatives like Proto-danksharding.
Industry analysts offer varied perspectives on Polygon’s future. Some emphasize its first-mover advantage and established ecosystem, while others caution about increasing competition. Notable figures like Sandeep Nailwal, Polygon’s co-founder, frequently highlight the network’s growing adoption and technological roadmap. Investment firms and crypto research organizations publish regular analyses, with price predictions ranging from cautious to highly optimistic. These forecasts typically consider both fundamental factors (technology, adoption, team) and technical analysis of price charts and market patterns.
For those considering MATIC as part of their portfolio, several strategies merit consideration:
Remember that cryptocurrency investments carry substantial risk, and only capital that you can afford to lose should be allocated to such volatile assets.
What is Polygon and how does it relate to Ethereum?
Polygon is a Layer 2 scaling solution that operates alongside the Ethereum blockchain. It processes transactions off the main Ethereum chain before settling them back, reducing costs and increasing speed while maintaining security through Ethereum’s consensus mechanism.
Who founded Polygon and who are the key people behind it?
Polygon was founded by Jaynti Kanani, Sandeep Nailwal, and Anurag Arjun. The project has attracted developers and advisors from across the blockchain industry and maintains partnerships with numerous companies and projects.
How does MATIC token utility affect its price?
MATIC tokens are used for paying transaction fees, participating in governance, and staking to secure the network. Increased network usage typically increases demand for MATIC, potentially supporting price appreciation if supply dynamics remain favorable.
What are the main competitors to Polygon?
Major competitors include other Layer 2 solutions like Arbitrum by Offchain Labs, Optimism, and zkSync by Matter Labs. Ethereum’s own scaling improvements also represent competitive pressure.
Where can I buy and store MATIC tokens safely?
MATIC is available on most major cryptocurrency exchanges including Coinbase, Binance, and Kraken. For storage, consider hardware wallets like Ledger or Trezor for maximum security.
Polygon’s journey toward the $1 price target represents a compelling narrative in the broader cryptocurrency evolution. While short-term volatility is inevitable, the network’s fundamental value proposition as Ethereum’s scaling layer provides a solid foundation for potential growth. The 2026-2030 period will test Polygon’s ability to execute its technological vision, maintain competitive advantages, and capture increasing market share. Whether MATIC ultimately surges to $1 depends on a complex interplay of technological execution, market conditions, adoption rates, and broader cryptocurrency acceptance. Investors should approach with cautious optimism, thorough research, and appropriate risk management, recognizing both the transformative potential and inherent uncertainties of this dynamic asset class.
To learn more about the latest cryptocurrency market trends, explore our articles on key developments shaping blockchain technology, institutional adoption, and regulatory landscapes that will influence Polygon and the entire digital asset ecosystem in the coming years.
This post Polygon Price Prediction: Will MATIC’s Explosive Growth Reach $1 by 2030? first appeared on BitcoinWorld.
With no true resistance, let’s face it, the only fear for the bulls is a sudden reversal to the downside with better-than-average volume. We could still get this today, but if it occurs, it will be driven by low volume, which will set up the next “buy the dip” opportunity.
As we move higher and more vertical, the definition of dip is going to change. Sticking with a 50% correction of a price swing, our “dip” level at current price levels is $4350.27. That’s nearly $200. Welcome to the “new norm”. During the old regime, we were lucky to see $200 over a few months, maybe a year. However, as we move higher the swings will get bigger, the corrections will be greater and it will become a big boys game and remember that gold isn’t going to “split” like a stock does.
Back to the fundamentals, the mixed trade in Treasury yields is having little impact on gold prices today. The benchmark U.S. 10-year Treasury yield is trading 4.12%, down 0.014.
We didn’t see much of an impact on yields from this week’s initial claims report, but the Commerce Department’s GDP report showed that the U.S. economy grew by 4.3% in the first quarter, which was the country’s fastest pace of expansion since 2023. This kind of growth is likely to keep inflation boosted, which will be supportive for gold prices.
It seems to me that the economy is getting comfortable with inflation and growth, which will keep gold underpinned and the “buy” the dip strategy intact.
Today’s weaker U.S. Dollar (DXY) is also providing support for gold. The greenback is sitting on support at 97.814. Up above, the 50-day moving average at 98.452 and the 200-day moving average at 100.209 are providing solid resistance and controlling the downtrend. We’re at a critical point for the dollar. Our charts indicate the possibility of a steep decline under 97.814 with 96.218 the first target. Gold could pop even higher on this move.
NEW DELHI: The Food Safety and Standards Authority of India (FSSAI) has written to the Food Commissioners of all States and Union Territories, directing officers to monitor Food Business Operators regarding the use of the term ‘Tea’ on packaging & labelling.
The FSSAI has clarified that only beverages made from Camellia sinensis, such as Kangra tea, green tea, and instant tea, may be labelled ‘tea’. Using the term “herbal” or “plant-based” for infusions is considered misleading and misbranding.
According to the provision, only beverages derived from Camellia sinensis, including Kangra Tea, Green Tea & Instant Tea, may be labelled as Tea. Using the term for other herbal or plant-based infusions is misleading & amounts to misbranding, under the provisions of the Food Safety and Standards Act, 2006.
“Food Business Operators, including E-commerce engaged in manufacturing, packing, marketing, import or sale of such products, are directed to comply with the provisions of the Food Safety and Standards Regulation and refrain from using the term ‘Tea’ for any products not derived from Camellia sinensis,” the letter states.
“It is clarified that, as per standards specified under 2.10.1 of the Food Safety and Standards (Food Product Standards and Food Additives Regulations, 2011, Tea (including Kangra Tea, Green Tea and Instant Tea in solid form) shall be exclusively from the plant of the Camellia sinensis,” it added.
The letter also specified that every package must display the food name on the front, indicating the true nature of the contents.
“Sub-regulation (1) of regulation 5 of Food Safety and Standards (Labelling and Display) Regulations, 2020 specified that every package shall carry the name of the food, which indicates the true nature of the food contained in the package, on the Front of Pack,” it said.
The letter further outlines the repercussions of non-compliance with the provisions of the Food Safety and Standards Act, 2006.
“In case of non-compliance, necessary action shall be initiated as per the provisions of the Food Safety and Standards Act, 2006, and the rules/regulations made thereunder,” thye letter explained.
This move aims to ensure transparency and accuracy in food labelling, protecting consumers from confusion. Manufacturers must comply with these guidelines to avoid penalties. (ANI)
Also Read: HM Amit Shah declares Madhya Pradesh future hub for MSMEs
:quality(70)/cloudfront-us-east-1.images.arcpublishing.com/shawmedia/IGFGVSGM5ZFVJN32ZXRN654A2Y.jpg "Do we need vitamin supplements? – AgriNews")


 Price Forecast: Gold Price Rally Hits New High as Bulls Target Further Breakout")
