The main category of All News Articles.
You can use the search box below to find what you need.
[wd_asp id=1]
The main category of All News Articles.
You can use the search box below to find what you need.
[wd_asp id=1]
After closing the previous week in negative territory, EUR/USD gains traction on Monday and trades above 1.1850. In the second half of the day, investors will pay close attention to comments from central bankers.
The table below shows the percentage change of Euro (EUR) against listed major currencies today. Euro was the strongest against the British Pound.
| USD | EUR | GBP | JPY | CAD | AUD | NZD | CHF | |
|---|---|---|---|---|---|---|---|---|
| USD | -0.33% | 0.14% | -0.25% | -0.09% | -0.26% | 0.12% | -0.32% | |
| EUR | 0.33% | 0.47% | 0.06% | 0.25% | 0.07% | 0.45% | 0.00% | |
| GBP | -0.14% | -0.47% | -0.40% | -0.24% | -0.40% | -0.02% | -0.46% | |
| JPY | 0.25% | -0.06% | 0.40% | 0.16% | -0.01% | 0.37% | -0.08% | |
| CAD | 0.09% | -0.25% | 0.24% | -0.16% | -0.17% | 0.21% | -0.24% | |
| AUD | 0.26% | -0.07% | 0.40% | 0.00% | 0.17% | 0.38% | -0.06% | |
| NZD | -0.12% | -0.45% | 0.02% | -0.37% | -0.21% | -0.38% | -0.45% | |
| CHF | 0.32% | -0.00% | 0.46% | 0.08% | 0.24% | 0.06% | 0.45% |
The heat map shows percentage changes of major currencies against each other. The base currency is picked from the left column, while the quote currency is picked from the top row. For example, if you pick the Euro from the left column and move along the horizontal line to the US Dollar, the percentage change displayed in the box will represent EUR (base)/USD (quote).
The selling pressure surrounding the US Dollar (USD) seems to be helping EUR/USD edge higher at the beginning of the week. The positive shift seen in risk mood and the sharp decline in the USD/JPY pair following the verbal intervention by Japanese officials to offset the JPY weakness on the election outcome cause the USD to lose interest. At the time of press, the USD Index was down 0.3% on the day at 97.35.
Later in the day, European Central Bank (ECB) President Christine Lagarde will speak on the state of the EU economy and ECB activities in an event in France. In the American session, several policymakers from the Federal Reserve (Fed) will be delivering speeches.
The CME FedWatch Tool currently shows that markets are pricing in about a 16% probability of a 25 basis points (bps) rate cut next month. In case officials reiterate that they are willing to remain patient and watch the data before deciding on the next policy move, the USD could find a foothold and limit EUR/USD’s upside.
Nevertheless, investors could refrain from betting on a steady recoveryin the USD ahead of the critical Nonfarm Payrolls data for January, which is scheduled to be released on Friday.
In the 4-hour chart, EUR/USD trades at 1.1858. The 20-period Simple Moving Average (SMA) has turned higher but remains below the 50-period SMA, which slopes gently lower. The 100- and 200-period SMAs trend upward, hinting at a firmer medium-term bias. The 14-period RSI at 61.8 rises above the midline, underscoring building bullish momentum.
Measured from the 1.1590 low to the 1.2025 high, the 38.2% retracement at 1.1860 aligns as a pivot point. If this level stays intact and EUR/USD failes to stabilize above it, the 50% retracement and the 100-period SMA in the 1.1810-1.1800 could act as the next support. On the upside, 1.1900 (static level) could be seen as an interim resistance level ahead of 1.1925 (Fibonacci 23.6% retracement).
(The technical analysis of this story was written with the help of an AI tool.)
The Euro is the currency for the 20 European Union countries that belong to the Eurozone. It is the second most heavily traded currency in the world behind the US Dollar. In 2022, it accounted for 31% of all foreign exchange transactions, with an average daily turnover of over $2.2 trillion a day.
EUR/USD is the most heavily traded currency pair in the world, accounting for an estimated 30% off all transactions, followed by EUR/JPY (4%), EUR/GBP (3%) and EUR/AUD (2%).
The European Central Bank (ECB) in Frankfurt, Germany, is the reserve bank for the Eurozone. The ECB sets interest rates and manages monetary policy.
The ECB’s primary mandate is to maintain price stability, which means either controlling inflation or stimulating growth. Its primary tool is the raising or lowering of interest rates. Relatively high interest rates – or the expectation of higher rates – will usually benefit the Euro and vice versa.
The ECB Governing Council makes monetary policy decisions at meetings held eight times a year. Decisions are made by heads of the Eurozone national banks and six permanent members, including the President of the ECB, Christine Lagarde.
Eurozone inflation data, measured by the Harmonized Index of Consumer Prices (HICP), is an important econometric for the Euro. If inflation rises more than expected, especially if above the ECB’s 2% target, it obliges the ECB to raise interest rates to bring it back under control.
Relatively high interest rates compared to its counterparts will usually benefit the Euro, as it makes the region more attractive as a place for global investors to park their money.
Data releases gauge the health of the economy and can impact on the Euro. Indicators such as GDP, Manufacturing and Services PMIs, employment, and consumer sentiment surveys can all influence the direction of the single currency.
A strong economy is good for the Euro. Not only does it attract more foreign investment but it may encourage the ECB to put up interest rates, which will directly strengthen the Euro. Otherwise, if economic data is weak, the Euro is likely to fall.
Economic data for the four largest economies in the euro area (Germany, France, Italy and Spain) are especially significant, as they account for 75% of the Eurozone’s economy.
Another significant data release for the Euro is the Trade Balance. This indicator measures the difference between what a country earns from its exports and what it spends on imports over a given period.
If a country produces highly sought after exports then its currency will gain in value purely from the extra demand created from foreign buyers seeking to purchase these goods. Therefore, a positive net Trade Balance strengthens a currency and vice versa for a negative balance.
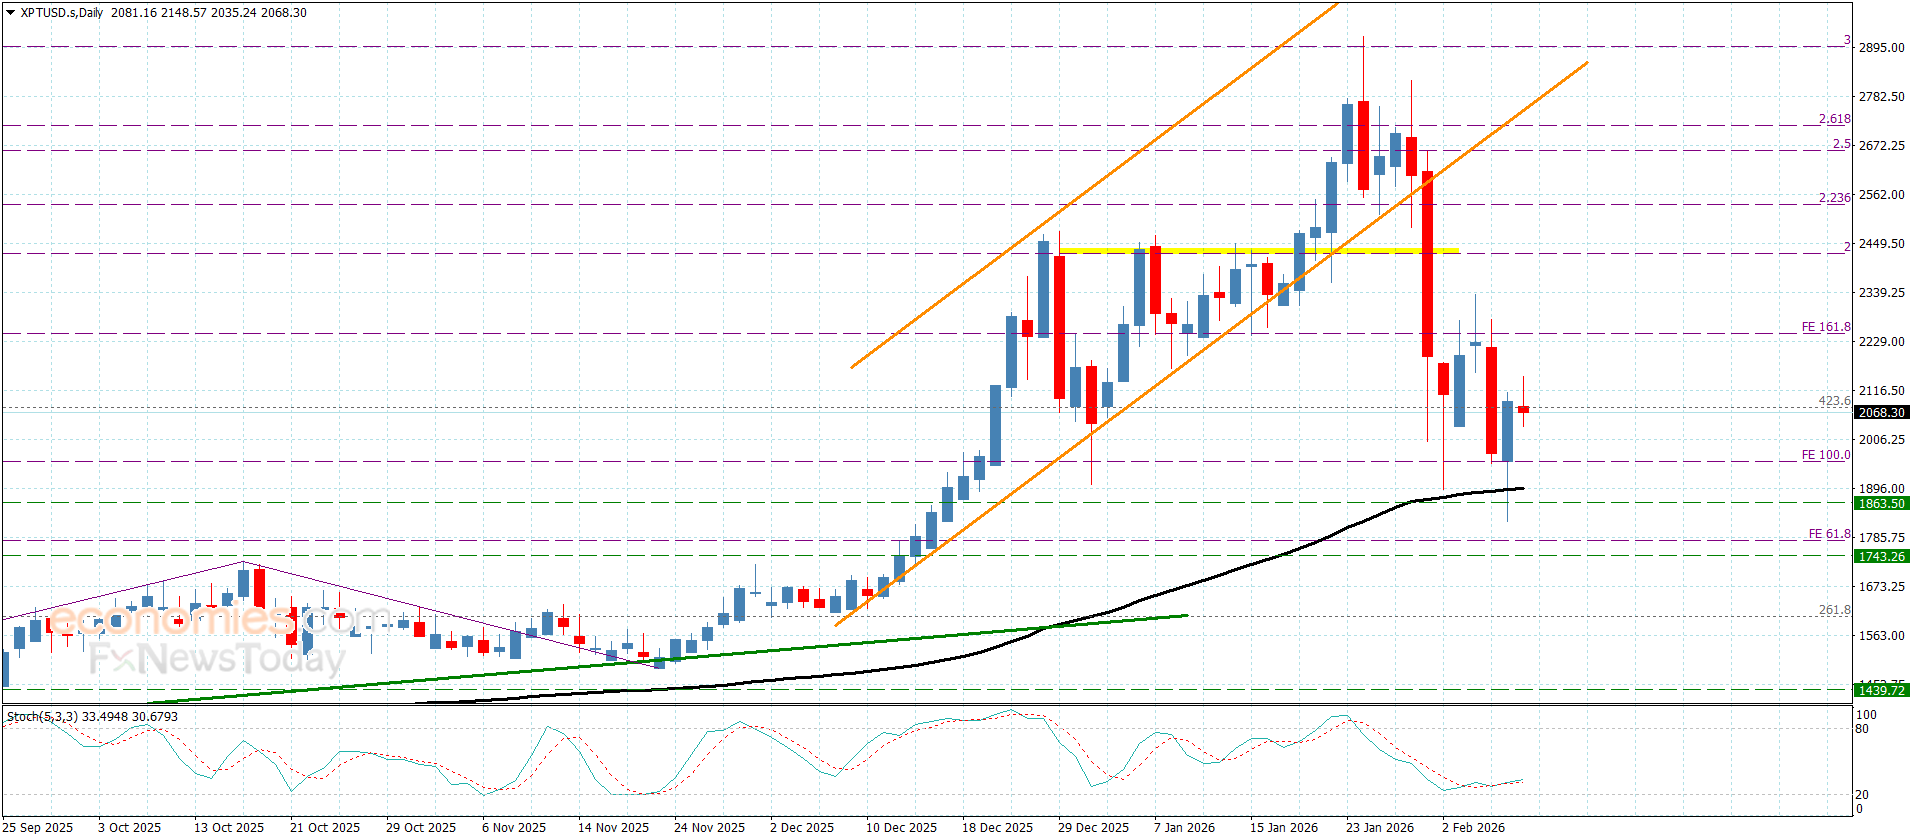
Platinum price attempted to surpass the negative pressures by forming some bullish waves, achieving $2145.00 level to settle above the moving average 55, noting that this rebound will not confirm regaining the bullish trend, due to the continuation of forming an important barrier at $2245.00 level, which makes us prefer the sideways bias dominance in the current period trading until gathering negative momentum, which allows it to decline below $1950.00, to target the corrective stations near $1860.00 and $1740.00.
While breaching the barrier and holding above it, will increase the chances of recording several gains, to expect its rally towards $2340.00 to press on $2425.00 barrier.
The expected trading range for today is between $1780.00 and $2070.00
Trend forecast: Bearish
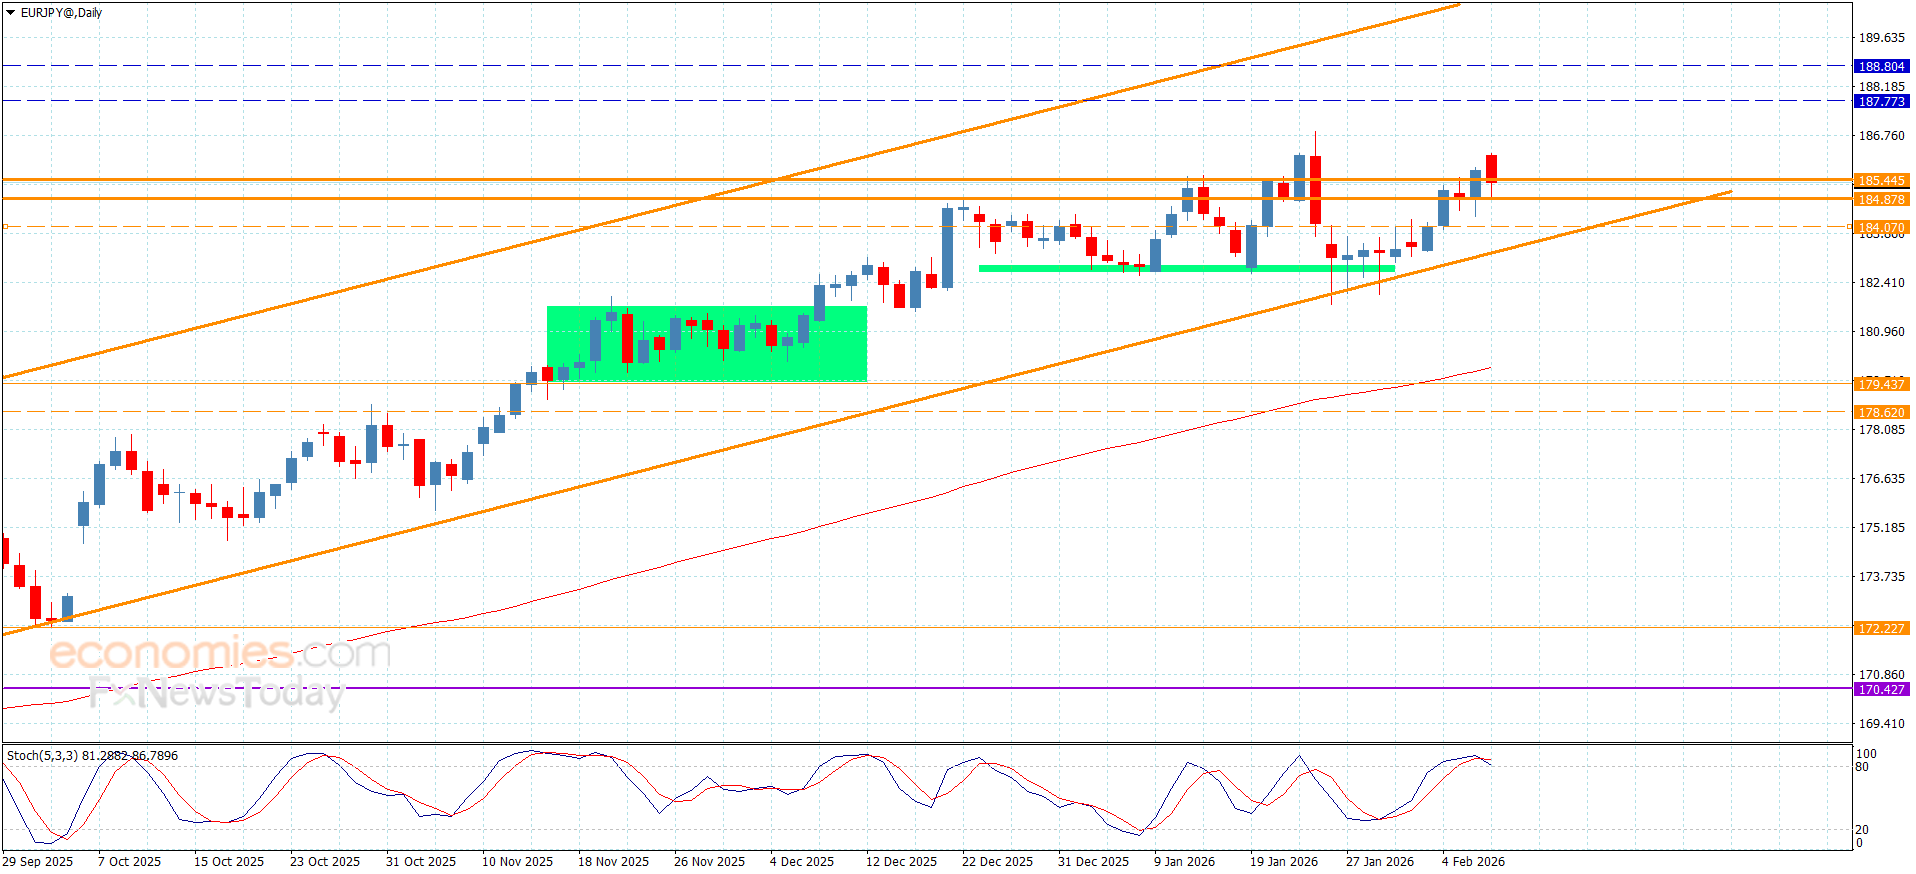
The EURJPY pair began new positivity this morning by its rally towards 186.22, but its neediness to negative momentum that pushed it to retest 184.85 level, to begin forming sideways waves as appears in the above image.
In general, we will keep preferring the bullish bias by the stability of the trading within the bullish channel’s levels and its main support settles near 183.40, therefore, we recommend waiting for gathering bullish momentum in the near period, reinforcing the chances of reaching 186.85, and surpassing it will form next main target at 187.75 in the upcoming trading.
The expected trading range for today is between 184.90 and 186.85
Trend forecast: Bullish
Gold price (XAU/USD) rises to near $5,035 during the early Asian session on Monday. The precious metal extends its recovery amid a weaker US Dollar (USD) and rising demand from central banks. The delayed release of the US employment report for January will be in the spotlight later on Wednesday.
US Treasury Secretary Scott Bessent on Thursday refused to rule out the possibility of a criminal investigation of Kevin Warsh, President Donald Trump’s nominee for US Federal Reserve (Fed) chair, if Warsh ends up refusing to lower the interest rates. Concerns over the Fed’s independence continue to drag the Greenback lower and provide some support to the USD-denominated commodity price.
The People’s Bank of China (PBOC) extended its gold buying reserve for a 15th consecutive month in January. The Chinese central bank’s gold holdings rose to 74.19 million fine troy ounces by the end of January, up from 74.15 million the previous month. Rising demand from China, the world’s largest gold consumer, might contribute to the Gold’s upside.
Iran’s President Masoud Pezeshkian described the Friday nuclear talks with the United States (US) as “a step forward,” even as he pushed back against any attempts at intimidation. Meanwhile, Iranian Foreign Minister Abbas Araghchi underlined that any dialogue required refraining from threats.
Trump said another meeting would be held early this week, adding that “If they don’t make a deal, the consequences are very steep.” Traders will closely monitor the developments surrounding US-Iran talks. Any positive signs of negotiations could undermine the precious metals in the near term.
Gold has played a key role in human’s history as it has been widely used as a store of value and medium of exchange. Currently, apart from its shine and usage for jewelry, the precious metal is widely seen as a safe-haven asset, meaning that it is considered a good investment during turbulent times. Gold is also widely seen as a hedge against inflation and against depreciating currencies as it doesn’t rely on any specific issuer or government.
Central banks are the biggest Gold holders. In their aim to support their currencies in turbulent times, central banks tend to diversify their reserves and buy Gold to improve the perceived strength of the economy and the currency. High Gold reserves can be a source of trust for a country’s solvency. Central banks added 1,136 tonnes of Gold worth around $70 billion to their reserves in 2022, according to data from the World Gold Council. This is the highest yearly purchase since records began. Central banks from emerging economies such as China, India and Turkey are quickly increasing their Gold reserves.
Gold has an inverse correlation with the US Dollar and US Treasuries, which are both major reserve and safe-haven assets. When the Dollar depreciates, Gold tends to rise, enabling investors and central banks to diversify their assets in turbulent times. Gold is also inversely correlated with risk assets. A rally in the stock market tends to weaken Gold price, while sell-offs in riskier markets tend to favor the precious metal.
The price can move due to a wide range of factors. Geopolitical instability or fears of a deep recession can quickly make Gold price escalate due to its safe-haven status. As a yield-less asset, Gold tends to rise with lower interest rates, while higher cost of money usually weighs down on the yellow metal. Still, most moves depend on how the US Dollar (USD) behaves as the asset is priced in dollars (XAU/USD). A strong Dollar tends to keep the price of Gold controlled, whereas a weaker Dollar is likely to push Gold prices up.
Silver price (XAG/USD) gains ground for the second successive session, trading around $80.80 per troy ounce during the Asian hours on Monday. The grey metal advances amid market caution ahead of key US economic data that could provide clearer guidance on the Federal Reserve’s (Fed) interest-rate outlook. The January jobs report, due Wednesday, is expected to signal stabilization in the labor market, with the US economy forecast to add 70,000 jobs, while the Unemployment Rate is seen holding steady at 4.4%.
Markets currently expect the Fed to keep interest rates unchanged in March, with potential rate cuts anticipated in June and possibly September. San Francisco Fed President Mary Daly said in a LinkedIn post on Friday that the economy may remain in a low-hiring, low-firing environment, though it could also shift toward a no-hiring, higher-firing phase.
Fed Governor Phillip Jefferson said future policy decisions will be guided by incoming data and assessments of the economic outlook, adding on Friday that the labor market is gradually stabilizing. Meanwhile, Atlanta Fed President Raphael Bostic noted that inflation has remained elevated for too long, stressing in a Bloomberg interview on Friday that the Fed cannot lose sight of inflationary risks.
Silver, a traditional hedge against inflation, finds support following the landslide victory of Prime Minister Sanae Takaichi’s ruling coalition in Japan’s weekend elections. This result strengthens the case for expansionary fiscal policies. Such policies tend to lift inflation expectations, underpinning demand for the precious metal.
Safe-haven demand for Silver also remains resilient despite the United States (US)–Iran talks held in Oman on Friday aimed at easing regional tensions. However, Tehran reiterated that it would not suspend nuclear fuel enrichment, with Foreign Minister Abbas Araghchi noting that further negotiations depend on consultations in Washington and Tehran and must proceed without threats. Meanwhile, US President Donald Trump said another round of talks is planned this week, warning of “very steep” consequences if an agreement is not reached.
(The story was corrected on February 9 at 2:40 GMT to say in the title that XAG/USD holds gains near $80.50 due to market caution and due to the Japanese election.)
Silver is a precious metal highly traded among investors. It has been historically used as a store of value and a medium of exchange. Although less popular than Gold, traders may turn to Silver to diversify their investment portfolio, for its intrinsic value or as a potential hedge during high-inflation periods. Investors can buy physical Silver, in coins or in bars, or trade it through vehicles such as Exchange Traded Funds, which track its price on international markets.
Silver prices can move due to a wide range of factors. Geopolitical instability or fears of a deep recession can make Silver price escalate due to its safe-haven status, although to a lesser extent than Gold’s. As a yieldless asset, Silver tends to rise with lower interest rates. Its moves also depend on how the US Dollar (USD) behaves as the asset is priced in dollars (XAG/USD). A strong Dollar tends to keep the price of Silver at bay, whereas a weaker Dollar is likely to propel prices up. Other factors such as investment demand, mining supply – Silver is much more abundant than Gold – and recycling rates can also affect prices.
Silver is widely used in industry, particularly in sectors such as electronics or solar energy, as it has one of the highest electric conductivity of all metals – more than Copper and Gold. A surge in demand can increase prices, while a decline tends to lower them. Dynamics in the US, Chinese and Indian economies can also contribute to price swings: for the US and particularly China, their big industrial sectors use Silver in various processes; in India, consumers’ demand for the precious metal for jewellery also plays a key role in setting prices.
Silver prices tend to follow Gold’s moves. When Gold prices rise, Silver typically follows suit, as their status as safe-haven assets is similar. The Gold/Silver ratio, which shows the number of ounces of Silver needed to equal the value of one ounce of Gold, may help to determine the relative valuation between both metals. Some investors may consider a high ratio as an indicator that Silver is undervalued, or Gold is overvalued. On the contrary, a low ratio might suggest that Gold is undervalued relative to Silver.
Gold starts the week of February 9, 2026, in a tense period of consolidation. Earlier this month, prices dropped sharply from a record $5,600 to a low near $4,400, but have now settled at $4,968 per ounce.
When markets reopen tomorrow, attention will move from selling to a contest between short-term sellers and long-term buyers. With the Chinese Lunar New Year on February 16 and a more aggressive Federal Reserve, high volatility is very likely.
The main reason for the recent $1,200 price swing is the nomination of Kevin Warsh as the next Federal Reserve Chair.
XAU/USD
Even after the sharp drop, gold is still seen as a safe investment because of rising trade and physical conflicts.
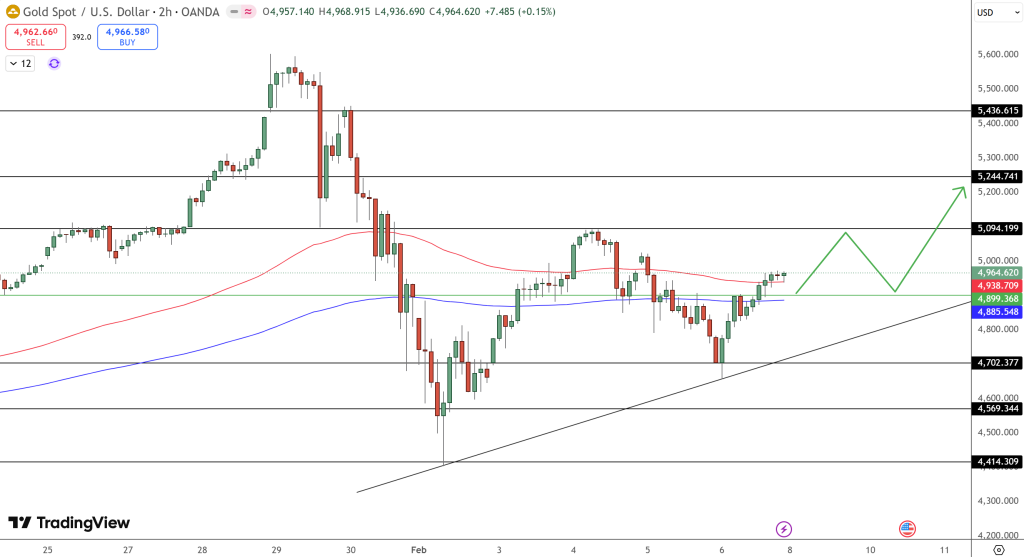
On the two-hour chart, gold is starting to form a base near $4,965. The strong rebound from the $4,718 support area, shown by heavy buying, suggests a local bottom might have formed.
| Level Type | Price Target | Significance |
| Resistance 2 | $5,170 | 61.8% Fibonacci retracement level. |
| Resistance 1 | $5,057 | Immediate psychological barrier and 50 EMA. |
| Pivot Zone | $4,940 – $4,980 | Current consolidation range; must hold for bullish continuation. |
| Support 1 | $4,831 | First line of defense for the week ahead. |
| Support 2 | $4,718 | Major trendline support from January lows. |
Indicators Update:
Trade Strategy for Feb 9 – Feb 13
The long-term trend is still positive, with J.P. Morgan expecting prices above $6,000 by year-end. However, short-term trading needs careful timing.
Risk Management: Tight stops are essential. A daily close below $4,700 invalidates the recovery thesis and suggests a deeper correction toward $4,400.

Arslan Butt
Lead Markets Analyst – Multi-Asset (FX, Commodities, Crypto)
Arslan Butt serves as the Lead Commodities and Indices Analyst, bringing a wealth of expertise to the field. With an MBA in Behavioral Finance and active progress towards a Ph.D., Arslan possesses a deep understanding of market dynamics.
His professional journey includes a significant role as a senior analyst at a leading brokerage firm, complementing his extensive experience as a market analyst and day trader. Adept in educating others, Arslan has a commendable track record as an instructor and public speaker.
His incisive analyses, particularly within the realms of cryptocurrency and forex markets, are showcased across esteemed financial publications such as ForexCrunch, InsideBitcoins, and EconomyWatch, solidifying his reputation in the financial community.
The prospect of an LDP-JIP supermajority in the Lower House supports the bullish short-term outlook for USD/JPY. However, yen intervention threats are likely to continue capping the upside below 160 as seen in January.
Meanwhile, a supermajority would remove the need for Prime Minister Takaichi to make concessions with smaller coalition parties. Over the longer term, this is likely to give the LDP greater control over legislation and ensure prudent fiscal spending, supporting a bearish medium-term outlook for USD/JPY.
While the election result will be key to near-term price trends, Japanese economic data will influence the BoJ’s policy stance. On Monday, February 9, wage growth will fuel speculation about a BoJ rate hike. Economists expect average cash earnings to rise 3% year-on-year in December, following a 0.5% increase in November.
A sharp upswing in wage growth would align with the BoJ’s outlook on wages and growing support for rate hikes.
For context, higher wages could boost households’ purchasing power, offsetting the effects of rising import prices. Increased purchasing power, coupled with improving consumer sentiment, would indicate a pickup in spending. Higher spending would fuel demand-driven inflation and bolster the economy, given that private consumption accounts for around 55% of GDP.
Crucially, these scenarios would align with the BoJ’s hawkish quarterly projections, which sent USD/JPY down 1.64% on January 23.
However, leading inflation indicators will also be key given Tokyo’s softer consumer prices in January. Economists expect producer prices to rise 2.3% year-on-year in January, down from 2.4% in December. Holding above the BoJ’s 2% target may revive bets on an H1 2026 rate hike, boosting demand for the yen. A stronger yen would send USD/JPY lower, supporting the bearish medium-term price outlook.
Follow real-time updates to stay ahead of USD/JPY market developments.
While Japan’s election and Japanese economic data will affect the yen, US economic indicators and Fed rhetoric will influence buying interest in the US dollar.
On Tuesday, February 10, retail sales data will reflect consumer sentiment and economic momentum. Economists forecast retail sales will rise 0.5% month-on-month in December, down from 0.6% in November.
While resilient consumer spending may ease immediate fears of a US recession, the jobs report will be key on Wednesday, February 11.
Economists expect unemployment to remain at 4.4% in January, and wage growth to slow from 3.8% YoY in December to 3.6% YoY in January. Softer wage growth would indicate a drop in consumer spending, dampening demand-driven inflation. A cooler inflation outlook would suggest a more dovish Fed rate path, reaffirming the bearish medium-term price outlook for USD/JPY.
Beyond the data, traders should closely monitor Fed chatter for clues on the timing of a rate cut.
According to the CME FedWatch Tool, the chances of a March 2026 Fed rate cut increased from 13.4% on January 30 to 23.2% on February 6. Additionally, the probability of a June cut rose from 67.3% to 75%. Shifts in the chances of March and June cuts will be key for US dollar trends.
In my opinion, USD/JPY would likely fall toward 150 on market bets on multiple Fed rate cuts and a hawkish BoJ policy stance. Narrowing US-Japan rate differentials would affirm the bearish medium-term (4-8 weeks) outlook. A drop below 150 would reaffirm the longer-term (8-16 weeks) 145-140 range.
Upside risks include:
Despite the upside risks, yen intervention threats are likely to cap upside around 160. Given the upside risks, a breakout above 158 would pave the way toward January’s high of 159.453. A move toward 159.453 would invalidate the medium-term bearish structure.
On the daily chart, USD/JPY traded above its 50-day and 200-day Exponential Moving Averages (EMAs). The EMA positions signaled a bullish bias. However, favorable yen fundamentals continue to counter technicals, supporting the negative outlook for USD/JPY.
A drop below the 50-day EMA would expose 155. If breached, the 200-day EMA would be the next key technical support level. Crucially, a sustained fall through the EMAs would indicate a bearish trend reversal, bringing the 150 support level into play. A break below 150 would enable the bears to target the 145-140 range, aligning with the longer-term price projection.
I wrote on the 1st February that the best trades for the week would be:
A summary of last week’s most important data in the market:
The only two elements here which really affected the markets last week was the continued bullish performance of the US economy, which keeps rate cut expectations low, and the RBA’s rate hike which kept the Australian Dollar performing as the strongest major currency.

The other two relevant issues are
The coming week’s most important data points, in order of likely importance, are:
Wednesday will be a public holiday in Japan.
Currency Price Changes and Interest Rates
For the month of February, I forecasted that the EUR/USD currency pair would rise in value.

February 2026 Monthly Forecast Performance to Date
Last week saw one cross with excessive volatility, so I made the following weekly forecast:
The Australian Dollar was the strongest major currency last week, while the Japanese Yen was the weakest. Directional volatility rose significantly last week, with one third of all major pairs and crosses changing in value by more than 1%.
Next week’s volatility is likely to be similar.
You can trade these forecasts in a real or demo Forex brokerage account.
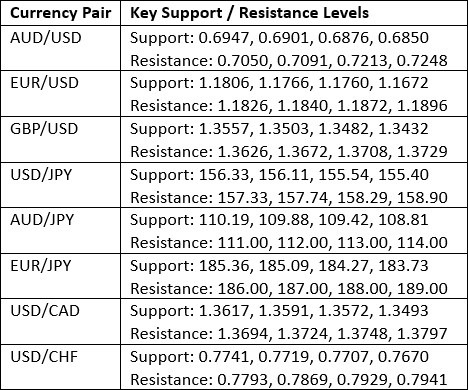
Key Support and Resistance Levels
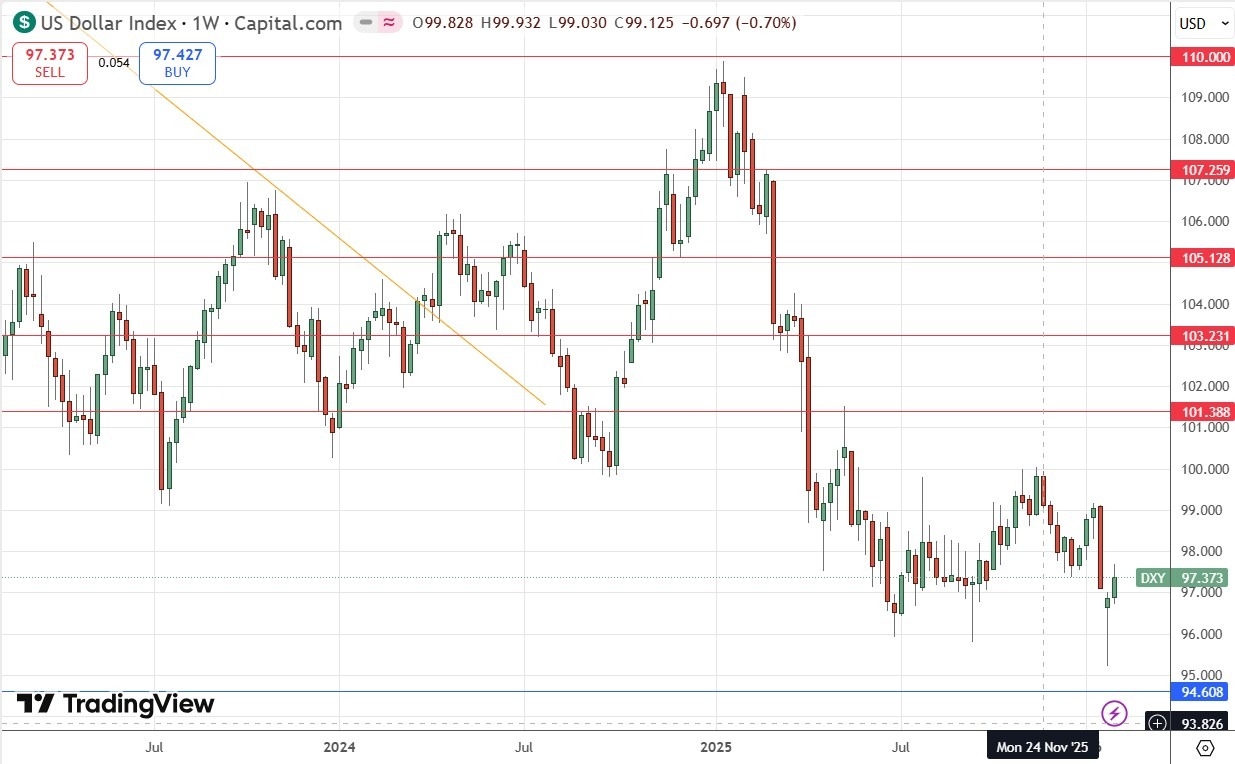
Last week, the US Dollar Index printed a bullish candlestick which closed higher but with a significant upper wick, signifying some indecision. This is weakly bullish by itself, but we also have a long-term bearish trend with the price below its levels of both 13 and 26 weeks ago. This gives us a conflicted technical picture about the US Dollar.
So, I see the outlook now as uncertain and the best market opportunities will probably not be US Dollar-dependent.
US Dollar Index Weekly Price Chart
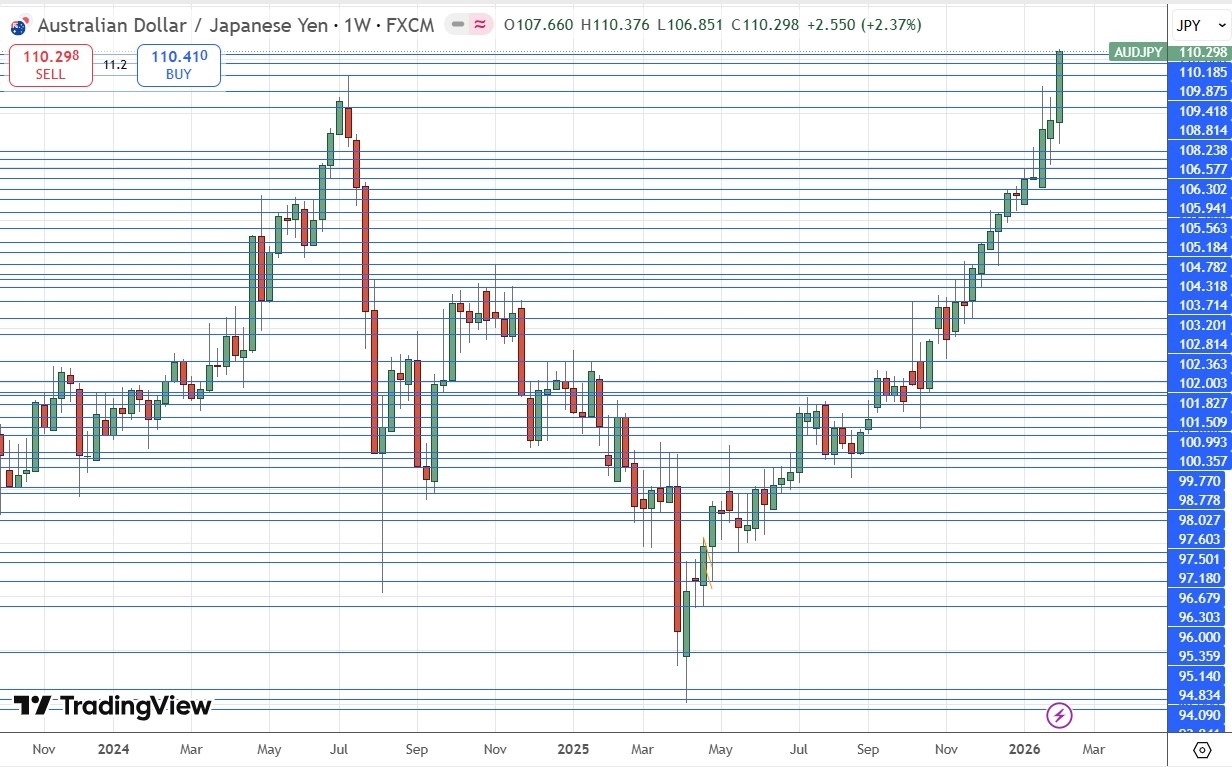
The AUD/JPY currency cross made a very strong upwards move, with the weekly close almost right at the high of the range, with unusually high volatility. The price made a bullish breakout to a new 30+ year high.
These are very bullish signs, as are the facts that the Australian Dollar was the strongest major currency last week, backed by an RBA rate hike, while the Japanese Yen continues to depreciate against most currencies as part of its long-term bearish trend, driven by the massive level of Japanese debt.
While this may look like the perfect bullish storm, an excessive weekly move like this is often followed by a retracement for at least a few days, so a drop in price over the next week would not surprise me.
This pair is likely to see the most action in the Forex market next week, at least until the US CPI data is released, so it might be interesting for swing traders on the long side or day traders on the short side.
AUD/JPY Weekly Price Chart
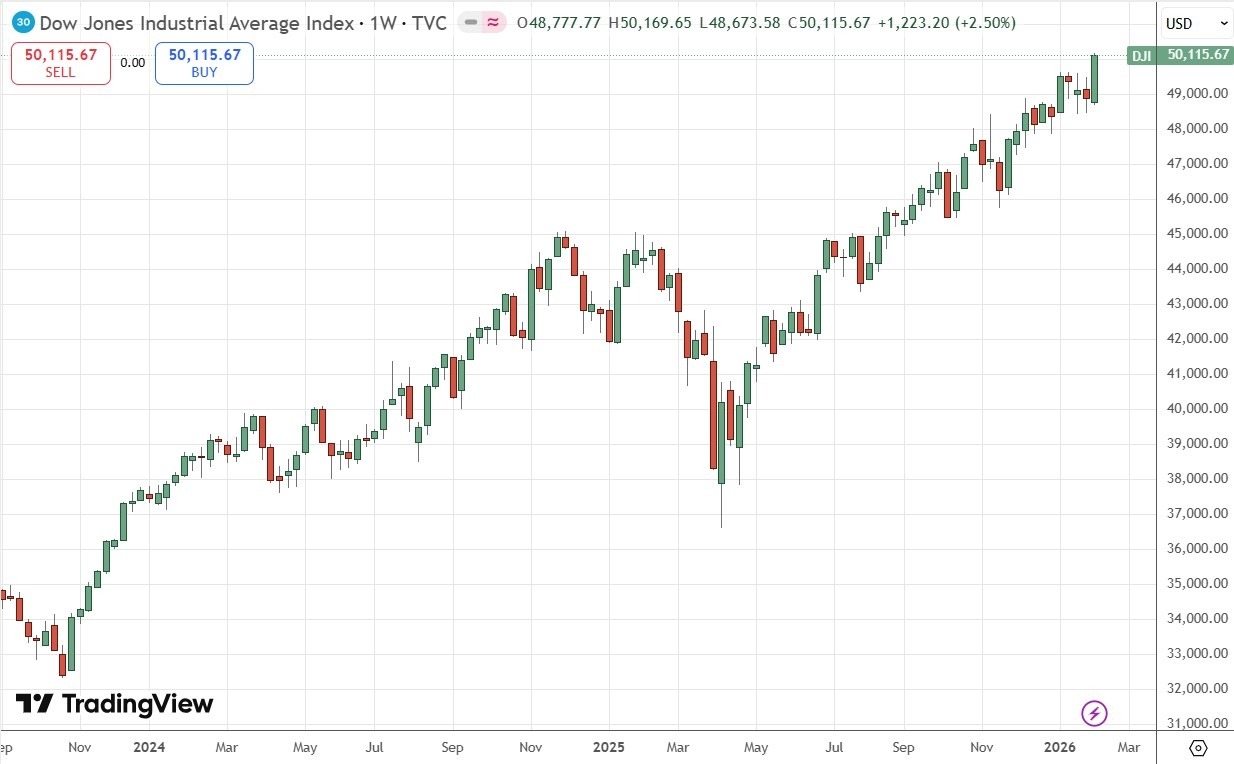
The major US equity indices like the S&P 500 Index and the tech-focused NASDAQ 100 Index are looking very choppy as they struggle to make new highs, showing swings with high volatility. This suggests an unstable market which, although bullish, may be about to reverse.
Yet, the old fashioned, old economy Dow Jones Industrial Average had a very strong week, closing right on its high at a new record, and breaking the big round number at 50,000 too. These are bullish signs, suggesting that it is the big tech firms which dominate the major indices which are causing poor price action. Away from the big tech giants, we see the basic sectors of the old economy doing well enough to make new record highs.
I am not strongly confident of this trade, but I think a long trade here with a trailing stop loss, due to the US economy’s historically strong track record, is worth taking. You might want to use a smaller than usual position size, like 50% for example.
Dow Jones Industrial Average Weekly Price Chart
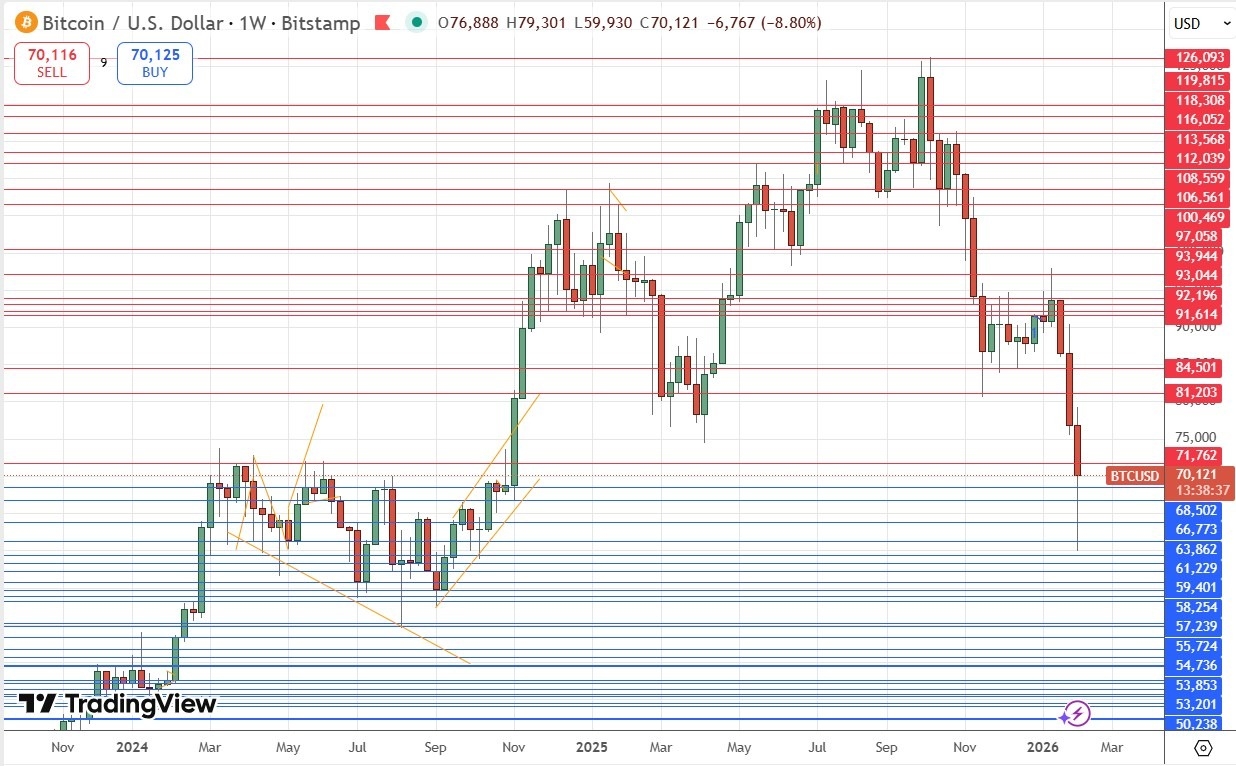
BTC/USD has continued to make significant bearish breakdowns below a few long-term support levels from just above $81,000 and has recently reached a new 16-month low. This is technically very significant in a bearish way.
While stocks and precious metals were rising strongly over recent months, Bitcoin fell from a record high a few months ago and continued to decline. It is clear the crypto sector is in decline, and that Bitcoin is in serious trouble. Bitcoin was meant to change the world, but outside of Africa, is just has not – you still can’t use it and it is unclear what value it really holds.
I do not like shorting assets, and Bitcoin now seems to be staging a recovery, with a significantly long lower wick now showing on the current weekly candlestick.
I think the price to watch is the support level at about $68,500. If the price action settles above this support, the fall will likely at least pause for a while. If the price action settles below this level, we will likely see a further drop towards the $50,000 area soon.
Bitcoin Weekly Price Chart
Gold, like Silver, saw a massive drop in just a day or two at the end of January. The drop is Silver was stronger, but Gold fell quickly from a record high at about $5,600 to a low at $4,400 by the end of the week, which is shown within the daily price chart below.
Applying a Fibonacci retracement study, we can see that the halfway level of this movement is very confluent with a major round number at $5,000 and this has held firmly as resistance.
The price action suggests we are going to get a consolidation now on gradually declining volatility, like a struck tuning fork playing itself out.
I think short trades from rejections of the $5,000 level as this plays out, provided they are handled skillfully as short-term trades on lower timeframes, is probably going to be the best strategy for trading Gold over the coming week.
If the price gets established above $5,000 that will be a contradictory bullish sign.
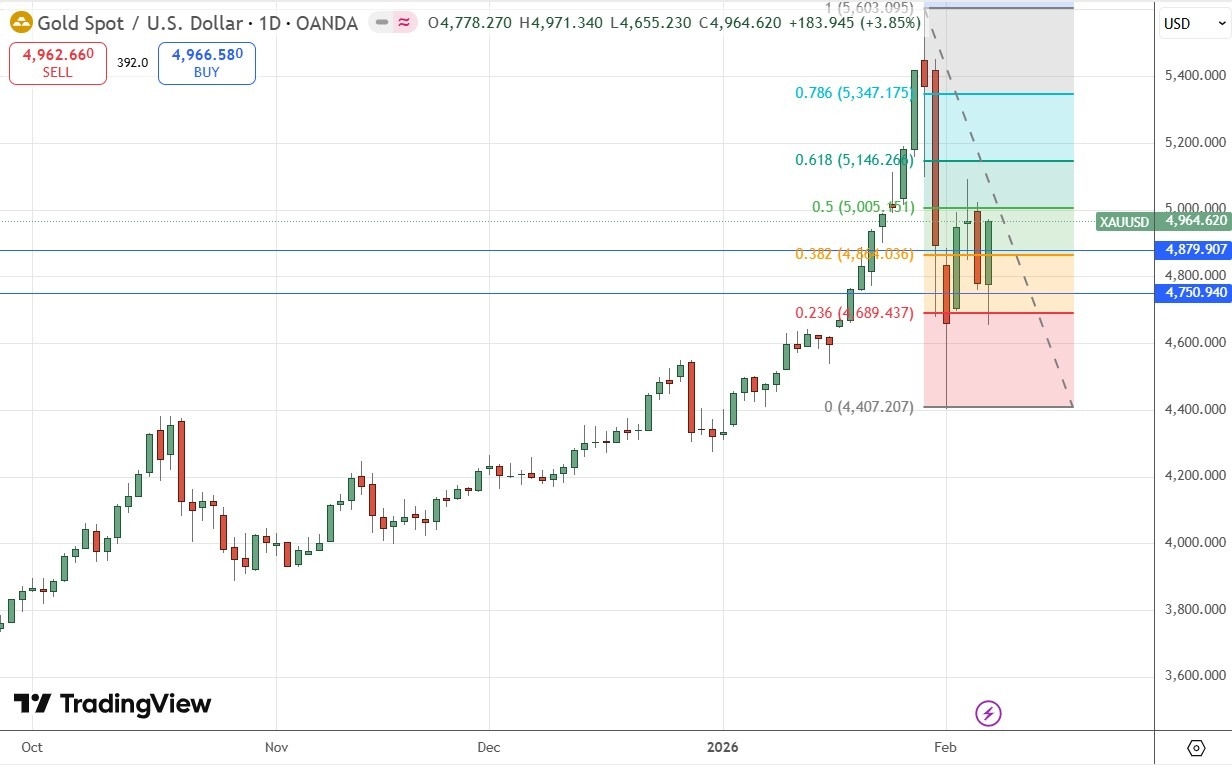
Gold Daily Price Chart
I see the best trades this week as:
Ready to trade our Forex weekly forecast? Check out our list of the best Forex brokers.
Silver (XAG/USD) is trimming some losses during Friday’s early European session, trading right above $74.00 at the time of writing, after hitting fresh seven-month lows near $64.00 earlier on the day. The pair, however, remains capped below a previous support area, in the vicinity of $75.00.
The white metal has dropped nearly 30% over the last two weeks, weighed down by investors’ relief after US President Trump appointed Kevin Warsh as the replacement for Jerome Powell as the central bank’s chairman, and by easing geopolitical tensions, as the US and Iran opened negotiations to avoid a conflict.
XAG/USD is picking up from lows, with the technical picture showing a bearish scenario. The 50-period Simple Moving Average (SMA), which acted as a dynamic support during the bullish cycle, extends its decline, with the pair holding beneath it. The Moving Average Convergence Divergence (MACD) line has slipped back below the zero line, and the Relative Strength Index (RSI) remains below 50, indicating weak traction.
Silver’s recovery found resistance at the $75.00 area, which is holding bulls for now. Further up, the pair might find resistance at an intraday level around $81.00. Key resistance is at Wednesday’s high in the area of $92.00.
Immediate support is at the daily low of $64.08, below that level, the $60.00 round level, and early December lows, in the $56.00 area, might come into focus
(The technical analysis of this story was written with the help of an AI tool.)
Silver is a precious metal highly traded among investors. It has been historically used as a store of value and a medium of exchange. Although less popular than Gold, traders may turn to Silver to diversify their investment portfolio, for its intrinsic value or as a potential hedge during high-inflation periods. Investors can buy physical Silver, in coins or in bars, or trade it through vehicles such as Exchange Traded Funds, which track its price on international markets.
Silver prices can move due to a wide range of factors. Geopolitical instability or fears of a deep recession can make Silver price escalate due to its safe-haven status, although to a lesser extent than Gold’s. As a yieldless asset, Silver tends to rise with lower interest rates. Its moves also depend on how the US Dollar (USD) behaves as the asset is priced in dollars (XAG/USD). A strong Dollar tends to keep the price of Silver at bay, whereas a weaker Dollar is likely to propel prices up. Other factors such as investment demand, mining supply – Silver is much more abundant than Gold – and recycling rates can also affect prices.
Silver is widely used in industry, particularly in sectors such as electronics or solar energy, as it has one of the highest electric conductivity of all metals – more than Copper and Gold. A surge in demand can increase prices, while a decline tends to lower them. Dynamics in the US, Chinese and Indian economies can also contribute to price swings: for the US and particularly China, their big industrial sectors use Silver in various processes; in India, consumers’ demand for the precious metal for jewellery also plays a key role in setting prices.
Silver prices tend to follow Gold’s moves. When Gold prices rise, Silver typically follows suit, as their status as safe-haven assets is similar. The Gold/Silver ratio, which shows the number of ounces of Silver needed to equal the value of one ounce of Gold, may help to determine the relative valuation between both metals. Some investors may consider a high ratio as an indicator that Silver is undervalued, or Gold is overvalued. On the contrary, a low ratio might suggest that Gold is undervalued relative to Silver.
,
BitcoinWorld
EUR/GBP Forecast: UBS Reveals Crucial Range-Bound Outlook as Budget Fears Subside
LONDON, March 2025 – The EUR/GBP currency pair enters a critical consolidation phase as UBS analysts project sustained range-bound trading following the dissipation of UK budget risk premiums. This development signals a pivotal shift in cross-channel currency dynamics that will influence international trade, investment flows, and monetary policy coordination between the Eurozone and United Kingdom.
UBS Global Wealth Management recently published comprehensive analysis indicating the EUR/GBP pair will likely trade within a narrow band of 0.8550 to 0.8750 throughout 2025. This projection emerges from converging economic fundamentals between the Eurozone and United Kingdom. The Swiss financial institution bases its assessment on multiple quantitative models incorporating inflation differentials, interest rate expectations, and trade balance developments.
Market participants initially priced significant risk premiums into Sterling during the UK’s autumn budget uncertainty. However, subsequent fiscal clarity and improved debt sustainability metrics have gradually eroded these premiums. Consequently, the currency pair has stabilized around technical support and resistance levels established over the past eighteen months. This stabilization reflects broader market recognition that both economies face similar structural challenges despite different monetary policy approaches.
The concept of budget risk premium refers to the additional yield or currency depreciation investors demand when sovereign fiscal policy appears unsustainable. During the UK’s budget formulation process last autumn, markets expressed concern through Sterling weakness against major counterparts. UBS tracking data reveals this premium reached approximately 1.5% at its peak in November 2024.
Several factors contributed to the premium’s subsequent decline:
As the premium evaporated, EUR/GBP volatility declined significantly. The 30-day realized volatility metric dropped from 8.2% in December 2024 to 5.1% by February 2025. This compression created ideal conditions for range-bound behavior as directional catalysts diminished.
Currency analysts observe remarkable alignment between technical patterns and fundamental drivers. The pair has established clear support near the 0.8550 level, corresponding with the 200-day moving average and the psychological 0.8500-0.8550 zone where substantial option barriers reside. Resistance consistently emerges around 0.8750, aligning with the 61.8% Fibonacci retracement of the 2023-2024 downward move.
Fundamentally, both economies exhibit parallel characteristics:
| Metric | Eurozone | United Kingdom |
|---|---|---|
| Core Inflation | 2.8% | 3.1% |
| GDP Growth Forecast | 1.2% | 1.4% |
| Central Bank Policy Rate | 2.75% | 3.25% |
| Current Account Balance | +2.1% of GDP | -1.8% of GDP |
These converging metrics reduce the likelihood of significant divergence that would typically drive sustained directional moves. Market participants increasingly recognize that relative performance matters more than absolute outcomes for currency pair dynamics.
The European Central Bank and Bank of England maintain cautiously divergent policy stances, yet their ultimate trajectories appear more synchronized than markets previously anticipated. Both institutions have signaled a gradual normalization process rather than aggressive easing cycles. This policy parallelism reinforces the range-bound thesis.
ECB President Christine Lagarde emphasized data-dependent approach during her latest press conference, specifically noting that “monetary policy transmission remains strong but uneven across member states.” Simultaneously, Bank of England Governor emphasized the need to “see sustained evidence of inflation returning to target” before considering rate adjustments. These communications create a policy environment where interest rate differentials should remain relatively stable.
Forward rate agreements currently price approximately 50 basis points of easing from both central banks over the next twelve months. This synchronized expectation further supports the range-bound forecast, as currency markets typically respond to differentials rather than absolute rate levels.
Bilateral trade between the Eurozone and United Kingdom has stabilized following post-Brexit adjustments. Goods trade now flows through established customs procedures, while services trade has developed new regulatory frameworks. The resulting predictability reduces currency volatility associated with trade surprises.
Investment patterns reveal similar stabilization. UK-based investors continue allocating to Eurozone equities and bonds, while European investors maintain substantial UK asset holdings. These cross-border investments create natural hedging flows that dampen currency movements. Portfolio rebalancing typically occurs within established ranges unless fundamental dislocations emerge.
The current range-bound projection contrasts sharply with historical EUR/GBP behavior. The pair experienced significant volatility during several previous periods:
Present conditions differ fundamentally because both economies face similar external shocks and internal adjustments. Energy security improvements, supply chain diversification, and inflation management approaches show remarkable convergence. This synchronization reduces the probability of asymmetric shocks that would typically drive sustained currency moves.
Comparative analysis with other major currency pairs reinforces the uniqueness of current EUR/GBP dynamics. While USD pairs experience Federal Reserve-driven volatility and JPY pairs respond to Bank of Japan policy shifts, EUR/GBP benefits from regional economic integration despite political separation. This creates a distinctive market microstructure where range-trading strategies often outperform directional approaches.
The range-bound forecast carries significant implications for different market participants:
Corporate treasurers can implement more predictable hedging programs with reduced volatility premiums. Institutional investors may adjust currency overlay strategies to emphasize yield capture rather than directional positioning. Retail traders might find range-trading approaches more effective than breakout strategies that dominated previous periods.
Several specific strategies gain prominence in this environment:
Risk management considerations shift accordingly. Tail risk protection becomes less expensive as implied volatility declines, while position sizing may increase due to reduced uncertainty. However, traders must remain vigilant for potential range breaks if unexpected divergence emerges between the two economies.
Ongoing EU-UK regulatory alignment discussions create additional stability. Financial services equivalence negotiations, though progressing slowly, establish frameworks for cross-border activity. Meanwhile, the Windsor Framework implementation has reduced Northern Ireland-related uncertainties that previously affected Sterling sentiment.
Geopolitical developments affect both currencies similarly. Energy security initiatives, climate transition investments, and defense spending increases show parallel trajectories. This common exposure means external shocks typically impact both currencies in comparable magnitude, preserving their relative valuation.
The EUR/GBP currency pair appears destined for extended range-bound trading as budget risk premiums fade and economic fundamentals converge. UBS analysis correctly identifies the diminishing catalysts for sustained directional moves, pointing toward a consolidation phase where technical boundaries gain increased significance. Market participants should prepare for an environment where relative value analysis and range-trading strategies outperform directional approaches. This EUR/GBP forecast reflects broader financial market normalization following years of exceptional volatility, representing a maturation in cross-channel economic relations that benefits traders, corporations, and policymakers alike.
Q1: What does “range-bound” mean for EUR/GBP?
A range-bound market refers to a currency pair trading within established upper and lower boundaries without breaking out to new highs or lows. For EUR/GBP, UBS identifies 0.8550 as key support and 0.8750 as primary resistance.
Q2: How long might this range-bound period last?
While precise timing remains uncertain, UBS analysis suggests the range could persist throughout 2025 unless unexpected economic divergence emerges between the Eurozone and United Kingdom.
Q3: What would break the EUR/GBP out of its range?
Sustained breakout would require significant divergence in monetary policy, unexpected inflation developments, geopolitical events affecting one region disproportionately, or substantial changes in trade or capital flows.
Q4: How does budget risk premium affect currency values?
Budget risk premium represents the additional compensation investors demand when fiscal policy appears unsustainable. As this premium increases, the affected currency typically weakens. Conversely, premium reduction supports currency stabilization or strengthening.
Q5: What trading strategies work best in range-bound markets?
Range-trading approaches like buying near support and selling near resistance often prove effective. Option strategies that benefit from time decay and volatility compression also perform well, while breakout strategies typically underperform during consolidation phases.
This post EUR/GBP Forecast: UBS Reveals Crucial Range-Bound Outlook as Budget Fears Subside first appeared on BitcoinWorld.