The main category of All News Articles.
You can use the search box below to find what you need.
[wd_asp id=1]
The main category of All News Articles.
You can use the search box below to find what you need.
[wd_asp id=1]
XRP is drawing renewed market attention as technical structure, institutional product flows, and regulatory developments converge, reinforcing the view that the asset has transitioned into a higher-trend regime across multiple timeframes.
Market data shows XRP consolidating near the $2 level after breaking out from a prolonged multi-year base. At the same time, rising assets in XRP-linked exchange-traded products and improving sentiment around Ripple’s regulatory outlook have added support to the current market structure rather than undermining it
From a structural perspective, XRP has already completed a meaningful technical transition. On the daily chart, XRP has remained above its 21-day exponential moving average (EMA) near $1.80 for several consecutive weeks, a behavior historically associated with trend continuation during prior XRP expansion phases rather than late-stage rallies.
XRP shows a bullish 3–6 month outlook, consolidating above its 21 EMA near $1.80 after a multi-year breakout, with technical signals projecting 43–75% potential upside. Source: @egragcrypto via X
Crypto market analyst EGRAG CRYPTO, who focuses on long-term XRP market cycles, described the shift as structural rather than speculative. “Ignoring the percentages on the formation and focusing purely on market structure, the higher-probability scenario is up, not down,” EGRAG CRYPTO wrote on X.
The breakout above a multi-year consolidation range marked XRP’s first sustained impulsive move since its prior cycle peak. In technical analysis, such impulsive legs typically signal a transition from accumulation into expansion, with subsequent pullbacks often representing corrective pauses instead of trend reversals.
Time-cycle symmetry, comparing the duration and structure of previous XRP market phases, combined with Fibonacci extension modeling, suggests potential upside ranges of 43% to 75% from recent highs. However, this framework remains conditional. Sustained daily closes below $1.60 would weaken the bullish structure and signal that the breakout has failed to hold.
Alongside technical developments, institutional exposure to XRP-linked products has continued to expand. Data shared by ChartNerdTA, citing ETF flow tracker WhaleInsider, shows that total net assets across XRP-related exchange-traded products have reached approximately $1.18 billion following recent net inflows of more than $20 million. “$XRP ETF: Total Net Assets now sits at $1.18BN,” ChartNerdTA posted.

XRP ETF inflows surged by $20.17 million, lifting total assets to $1.18 billion as steady net inflows since mid-November highlight growing institutional demand around the $2 price level. Source: @ChartNerdTA via X
The figures primarily reflect non-U.S. exchange-traded products, including regulated ETPs listed in select international jurisdictions. Visual data from SoSoValue, a platform that tracks digital asset fund flows, shows net inflows remaining positive since mid-November, with cumulative assets trending steadily higher.
While these products differ structurally from U.S. spot ETFs approved for Bitcoin and Ethereum, the growth in assets nonetheless signals rising institutional participation and demand for regulated XRP exposure amid improving regulatory clarity.
Short-term price action continues to reflect consolidation rather than directional breakdown. According to TradingView analyst ZACKFX7, who focuses on range-based market structures, XRP is currently trading within a clearly defined zone following a rebound from established demand levels.
“XRPUSDT is currently trading inside a well-defined range after a strong move from the demand zone,” the analyst noted.
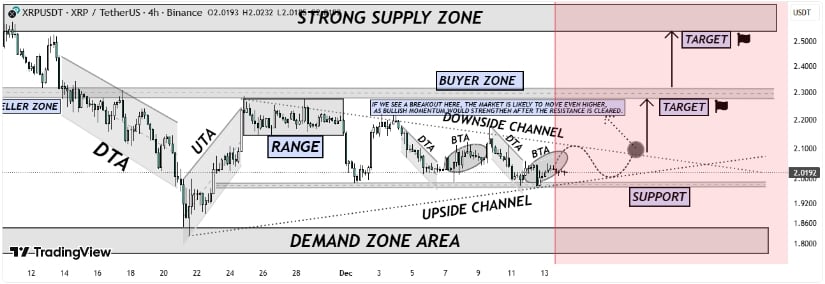
XRP consolidates within a tight range above key support, signaling building bullish pressure as traders await a confirmed breakout for the next directional move. Source: ZACKFX7 on TradingView
Within this range, price reactions have continued to form higher lows, indicating that buyers remain active on pullbacks. This behavior is commonly associated with accumulation phases, where the market absorbs supply before attempting continuation.
A confirmed break above the range high and buyer-controlled zones would likely open the path toward upper supply targets. Conversely, failure to maintain support could result in another controlled retest of demand without necessarily invalidating the broader structure.
Regulatory developments continue to serve as an important backdrop rather than an immediate catalyst. Ongoing progress in the Ripple vs. SEC case has gradually reduced uncertainty for institutional participants assessing XRP exposure, even though no new legal milestones were announced during the period.
While regulatory clarity has improved relative to previous years, legal outcomes remain a variable. Any adverse developments could still influence sentiment, liquidity, and product availability across regulated markets.
XRP’s current price behavior reflects consolidation within a broader bullish framework rather than signs of structural exhaustion. The combination of a confirmed long-term breakout, sustained participation in XRP-linked investment products, and steady technical support suggests the market is absorbing supply rather than distributing it.
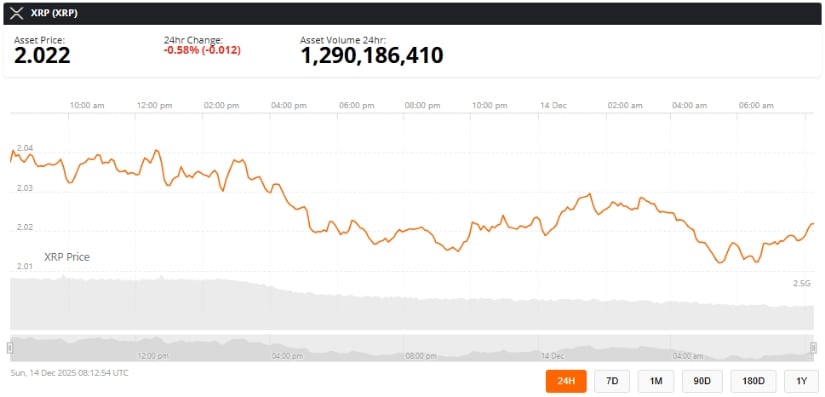
XRP was trading at around 2.02, down 0.58% in the last 24 hours at press time. Source: XRP price via Brave New Coin
That said, the outlook remains conditional. Macro volatility, regulatory uncertainty, and failures to hold key support levels would alter the trend narrative. For now, analysts broadly emphasize confirmation and structure over speculation, positioning XRP within a constructive but closely watched market regime heading into 2025.
Finding the perfect gift can be tough — especially during the holidays.
Between your algorithm’s penchant for everything that’s too expensive and the picked-over products still in stores, this time of year can feel like you’re driving the struggle bus straight into Boring Slippersville. Or worse — CrappyHolidaySweater City.
But before you proceed to payment with that meh cart, check out our list of unique, exciting finds from women-owned companies. From puzzles for art lovers to statement jewelry to candles for your brain — there’s something cool for everyone on your list.
And don’t stop with the holidays. There are more than 14 million women-owned businesses in the U.S., which means you can find awesome gifts and support women 365.
Happy gifting!
Apostrophe Puzzles
Rosie No. 1 puzzle (Photo/Courtesy of Apostrophe Puzzles)
Apostrophe Puzzles founder Mandi Masden grew up an avid puzzler — like puzzle-table-in-her-bedroom puzzler — but her interest waned as she got older and couldn’t find themes that spoke to her as a Black woman.
Fast forward to 2019 when Masden’s friends made her a custom puzzle of original artwork she’d been wanting to purchase but couldn’t afford. Like two corner pieces clicking together, Masden knew she wanted to bring fine art, culture and the art of puzzling to the table for anyone to enjoy.
Apostrophe’s collection of jigsaw puzzles features a wide range of vibrant, modern, original artwork by artists of color. And extra Earth bonus: All puzzles are made with 100% recycled chipboard and printed with eco-friendly, non-toxic ink.
Great gift: Rosie No. 1 ($36)
Other women-owned companies to consider: Jiggy Puzzles, eeBoo
Big Night

Big Night shop (Photo/McGuire McManus)
Big Night is a one-stop shop for the hostess with the mostess. A serving set that looks like a giant olive? Check. Vintage owl salt and pepper shakers? Hoooo doesn’t want that loveable duo?
Founder Katherine Lewin opened her first Big Night location in 2021 as a go-to for everything you need for a fantastic dinner party or gathering. From flashy flatware to barware to edible goodies, Big Night has party goers and party throwers covered.
Great gift: Jars of edible toppings, Crunchy, Roasty Glitter ($28): Original, A Little Sweet or A Little Spicy — to add a little extra flavor to any dish
Other women-owned companies to consider: Caskata, Salt & Sundry
Susan Alexandra

Oy Vey ring, Susan Alexandra (Photo/Emma Cheshire)
If colorful, quirky, handmade accessories are your jam, Susan Alexandra is your new BFF.
The brand is known for its hand-beaded accessories, jewelry and whimsical Judaica. Custom, hand-painted dreidels, elaborately beaded menorahs and bronze rings that say “Chutzpah” are among the gems.
Designer Susan Korn started the company in her bedroom in 2014, making “Made in NYC” beaded handbags. The bags were a hit and allowed the brand to grow to include more unique pieces like custom lockets and “Oy vey” bracelets.
Today, most items on the Susan Alexandra website are made by hand in New York City. If you’re shopping online, look for Susan icons to hear stories behind the items.
Note: If you’re looking for holiday delivery, that ship has sailed. However, there is a spot for inquiries on the site if you’re “hoping for a Christmas miracle.”
Great gift: Oy Vey Ring ($138)
Other women-owned companies to consider: The Pink Locket, Little Words Project
The Big Dill Pickleball Co.

Original Carbon Fiber Pickleball Paddles Set (Photo/Courtesy of Big Dill Pickleball Co.)
Katy Luxem grew up playing pickleball way before celebrities like the Kardashians started posting their dinks on social media. The one problem: Luxem couldn’t find any cool gear. Everything was blah — and expensive blah to boot. So, she created her own line of paddles and accessories featuring — what else? — pickles.
The Big Dill Pickleball Co. paddles meet the USA Pickleball requirements for tournament play and the cheerful design will help distract your opponents so you can crush your grandma and her “friend” Dorothy during your next match. Game on!
Great gift: Original Carbon Fiber Pickleball Paddles Set ($139)
Other women-owned companies to consider: Pep Pickleball, Recess
The Qi

(Photo/Courtesy of The Qi)
The Qi’s company mission is “to empower you to feel more joy, beauty and life everywhere.” You had us at empower.
The Qi’s unique line of whole flower teas are an experience: After you submerge the flower in hot water, you watch it bloom. Like a beautiful Little Shop of Horrors you drink.
Founder Lisa Li started the company after experiencing burnout from work. She took a trip to Shangri-la, discovered the soothing benefits of rose tea and went to work tasting and testing more 100 blooming herbs for The Qi’s line of floral teas.
All flowers are hand-picked, organically grown and sustainably cultivated from small family-owned farms across Asia.
Great gift: Floral Collection variety box ($36)
Other women-owned companies to consider: Flowerhead Tea, Bigelow
Caftari

Caftari Signature Gift Set (Photo/Courtesy of Caftari)
Happiness and better sleep are a lot to ask from a candle, but who are we to argue with science?
Caftari candles are infused with different essential oils that may help influence mood and well-being. For example, the Scent of Nirvana candle is made with agarwood essential oil, which studies show can help calm the mind and treat insomnia when used during aromatherapy.
The team works with neuroscientists to study how essential oils influence brain waves and then creates fragrances to channel a state of mind.
Founder Shreya Aggarwal came up with the idea for Caftari after incorporating essential oils in her own treatment plan for insomnia and anxiety.
Each candle is vegan, hand-poured, and when the candle is gone, you can recycle the container. Your move, French vanilla.
Great gift: Caftari Signature Gift Set ($150)
Other women-owned companies to consider: Bonita Fierce Candles, Prosperity Candle
Cuyana

Oversized Paloma Bag (Photo/Courtesy of Cuyana)
Hellooo, purse! Cuyana handbags are chic on the outside and customizable with snap-on accessories for organization on the inside. The Oversized Paloma Bag, for example, is deceptively roomy for all your essentials and is made with Italian double-faced leather that gets better with age.
All fabrics and leathers are responsibly sourced, made by hand and designed to stay strong and carry on as part of co-founder Karla Gallardo’s mission to help people buy “fewer, better things.”
From clothing to hats to handbags, everything in the Cuyana collection is crafted from sustainable materials and made by expert craftsmen and craftswomen. Check out the Cuyana Revive pieces for pre-loved bags and accessories at a discount.
Great gift: Oversized Paloma Bag ($528)
Other women-owned companies to consider: Sabrina Zeng, Dagne Dover
Mooncat
![]()
Avatar: The Last Airbender collection (Photo/Courtesy of Mooncat)
Mooncat founder and CEO Michelle Lin wasn’t allowed to wear nail polish growing up. So, naturally, she became obsessed with painting her nails and nail polish as a form of wearable art. When she couldn’t find the quality of polish she wanted, she made her own.
Mooncat’s unique nail lacquers are next level: Some are filled with holographic glitter and others change color depending on your body temperature. They’re definitely a vibe. All lacquers are vegan, cruelty-free and made in the U.S. by women.
Also very cool: A portion of every purchase goes to organizations that help cats find forever homes.
Great gift: Lacquers from the Avatar collection (starting at $17)
Other women-owned companies to consider: Liberation nails, Olive & June
Milène Jardine Chocolatier

International Chocolate Bar Library (Photo/Courtesy of Milène Jardine Chocolatier)
Milène Jardine’s passion for chocolatey goodness started when she was a kid. But it wasn’t until she left her corporate job in 2016 that she began to go all in on her dream of creating her own chocolate brand.
Milène Jardine Chocolatier treats are all handcrafted in small batches in New York City. The artisanal truffles and chocolate bars are infused with herbs, fruits, nuts and spices — zero artificial flavors or extracts — inspired by Jardine’s travels. Think ginger, turmeric and black pepper for a taste of Japan and India and whiskey and sea salt for Ireland.
Also in good taste: The company works with B-Corp-certified cacao partners that implement sustainable practices, add economic value to local farmers and promote gender equality.
Great gift: International Chocolate Bar Library ($40)
Other women-owned companies to consider: Maeve, Conexión Chocolate
From Your Site Articles
Related Articles Around the Web
The coming winter (yes, it is still officially fall until Dec. 21) will have more of an impact on household and business energy expenses than the government initially predicted. In other words, get ready to throw another log on the fire!
The U.S. Energy Information Administration has changed its Winter Fuels Outlook forecast of the impact on electrical and gas bills, a forecast made in mid-October.
“We now expect a colder winter, and our retail energy price forecasts have risen, especially for natural gas and propane,” stated the EIA in a recent update.
As a result, it means higher thermostats resulting in higher electrical and natural gas bills.
Each October, we publish a Winter Fuels Outlook with forecasts for energy consumption, prices, and expenditures for U.S. households. We categorize homes based on their main heating fuel: natural gas, electricity, propane, or heating oil. Almost all U.S. homes use one of these four fuels as their main heating source.
In each month from November through March, we update these forecasts based on actual weather and prices and the most recent Short-Term Energy Outlook (STEO) forecasts for future weather and prices. As the winter progresses, we update our Winter Fuels Outlook forecasts concurrently with each STEO release through April 2026.
Weather is a key source of uncertainty in our forecasts, so we provide three forecasts with different weather assumptions. Retail energy prices—especially for propane and heating oil—are sensitive to weather-related effects on energy demand, supply, and wholesale prices.
Our weather assumptions are partially based on the National Oceanic and Atmospheric Administration’s (NOAA) forecast for the current month. NOAA now expects that this December will be about 8% colder than the average of the previous 10 Decembers. In our October Winter Fuels Outlook forecast, we expected this winter would be slightly warmer than last winter; we now expect generally similar weather to last winter.
Retail natural gas and propane prices for the residential sector have also surpassed our initial forecasts. For natural gas, our retail price forecast has increased concurrently with a change in wholesale natural gas prices. When we formed our October STEO forecast, the spot price of natural gas at Henry Hub was near $3.00 per million British thermal units (MMBtu). By late November, that price had increased to more than $4.00/MMBtu.
Revised forecasts for retail propane prices are attributable to new information from our Heating Oil and Propane Update, which collects data on a weekly basis in October through March. Retail propane prices in October and November have largely followed the previous winter’s price patterns despite wholesale propane prices that have been at least 10% less than the previous winter’s values.
The USD/JPY exchange rate has hovered at its highest level since July 17, after the latest Japanese wage income data. The pair, which is the third most popular forex cross, traded at 158.05, up by 13.25% from its lowest point in September 24. So, what next for the USD to JPY price ahead of the US NFP data?
According to Japan’s statistics agency, the average wage income data jumped from 2.2% in October to 3.0% in November.
Another report showed that the overtime pay rose from 0.70% to 1.60. These are important numbers because wages often has an impact on inflation, which then impacts the central bank’s decision.
The rising wages mean that Japan’s inflation may remain high in the coming months. Recent data showed that Japan’s inflation rose from 2.3% in October to 2.9% in November, the highest increase in three months. That figure was much higher than the Bank of Japan’s target of 2.0%.
Therefore, the strong wage numbers, high inflation rate, and the falling yen means that the Bank of Japan (BoJ) may continue to diverge from the Federal Reserve.
The BoJ raised interest rates twice in 2024, helping it exit negative rates. It pushed the benchmark rate to 0.25%, the highest number in years.
Therefore, there are rising odds that the bank will continue hiking interest rates later this year. Analysts see it hiking by 0.25% either in the January 24 meeting or later this year.
The main hindrance to BoJ hikes is Japan’s economy. A report released last month showed that the country’s GDP expanded by 0.7% in Q3, and analysts expect it to grow by 0.4% this year.
High interest rates hurts an economy by making the cost of borrowing capital for consumers and businesses higher.
The USD/JPY pair also reacted to Wednesday’s Federal Reserve minutes. These minutes provided more details about last month’s meeting in which officials had a hawkish tilt.
Fed officials are mostly concerned about inflation, which may increase soon after Donald Trump becomes president. Trump has made many promises, including raising tariffs on goods entering the US.
Fed officials expect to deliver just two interest rates cuts this year instead of the previous four. And analysts anticipate that the first cut will happen in July this year.
The next important USD/JPY news will be the upcoming US nonfarm payrolls (NFP) data scheduled on Friday. While these numbers are important, their impact on the greenback may be muted since the Fed now focuses on inflation.
Economists expect the upcoming data to show that the economy added over 150k jobs in December, while the jobless rate remained at 4.2%. ADP’s report released on Wednesday showed that the private sector added just 122,000 jobs, lower than expected. Another report on Tuesday showed that job vacancies increased to over 8 million in November, the highest level in months.

The daily chart shows that the USD to JPY exchange rate has been in a tight range in the past few days. It has constantly remained slightly above the important support level at 156.78, its highest swing on November 5.
The pair has moved above the 78.6% Fibonacci retracement level and the 50-day moving average. It has also formed a bullish flag pattern, often leading to a strong bullish breakout. Therefore, barring any interventions by the Bank of Japan, there is a risk that the USD/JPY pair will have a strong bullish breakout as buyers target the psychological point of 160.
The post USD/JPY forecast: Will the Japanese yen crash to 160 soon? appeared first on Invezz
A proposed rule change regarding the placement of DSHEA disclaimers on dietary supplement labels has been seen as a welcome clarification by industry sources. FDA has rarely if ever enforced the existing rule, but the issue has given rise to class action lawsuits.
The Dietary Supplement Health and Education Act (DSHEA) specifically requires that the standard disclaimer relating to claims be printed on every panel of a product label on which a health claim appears.
The standard verbiage is: “These statements have not been evaluated by the Food and Drug Administration. This product is not intended to diagnose, treat, cure or prevent any disease.”
Over the years the practice in the industry has become to refer to a lone disclaimer, often but not always located on the back panel of the product label, via asterisks appended to each appearance of a claim. While that does not fulfill the letter of the law, in a statement announcing the proposed rulemaking procedure, FDA said it “recognizes that we have rarely, if ever, enforced this requirement.”
FDA’s proposed rule change would allow the currently accepted industry practice to be formally codified in the law. At least one appearance of the disclaimer would still be required, however.
That de facto enforcement discretion on FDA’s part hasn’t stopped the plaintiff’s bar from seeking to capitalize on this perceived lapse on the part of dietary supplement companies. As the Council for Responsible Nutrition (CRN) noted in a recent press statement, “[A] recent uptick in class-action lawsuits has relied on an alternative interpretation, arguing that the full disclaimer must be placed on every panel where a structure/function claim is used on a product label. These legal challenges have created confusion, prompted unnecessary litigation, and imposed costly and disproportionate burdens on responsible manufacturers — without improving consumer understanding.”
Ivan Wasserman, partner in the law firm Amin Talati Guarani, was effusive in his praise of the move.
“This development is certainly welcome news to all of us in the industry. It is public acknowledgement of the enforcement discretion that we all know FDA has been unofficially exercising for decades, and we hope FDA will ultimately revise the regulation. It provides peace of mind to everyone trying to label supplements correctly, and will hopefully help put an end to at least this one labor of whack-a-mole class actions. Our firm was thrilled to be part of the catalyst for this by assisting CRN in drafting its submission to FDA advocating for this change,” he told SupplySide Supplement Journal.
Wasserman noted that the change was announced via a “letter to industry” rather than a guidance document. He speculated that this is in response to the first Trump administration’s executive order against using guidance documents rather than rulemaking procedures as standard regulatory tools.
The practice has grown in recent years because of the many months to years required to conclude a formal rulemaking procedure. The argument in favor of rulemaking is that the rule can be challenged in court, giving some potential redress if stakeholders believe the process has gone awry.
The Natural Products Association (NPA) and the American Herbal Products Association (AHPA) had collaborated on a similar submission to FDA, and NPA’s president and chief executive officer Daniel Fabricant, Ph.D., said the change will ease burdens for industry.
“NPA appreciates that FDA carefully considered the concerns of industry over the requirement for the DSHEA disclaimer to appear on each panel of a dietary supplement product label where an applicable claim is made. Our association will continue to advocate for dietary supplement rules that ease undue burdens on our members, reduce frivolous litigation and protect the integrity of DSHEA,” he said.
Bitcoin (BTC), Ethereum (ETH) and Ripple (XRP) are trading under pressure on Tuesday as bearish sentiment in the broader cryptocurrency market lingers.
Despite Bitcoin trading above $86,000, up from an intraday low of $85,266, the overall outlook remains bearish, characterised by “extreme fear”, according to the Crypto Fear & Greed Index.
Solana (SOL) remains under bearish pressure, extending its decline for the third consecutive day with over 1% loss at press time on Tuesday. An ongoing Distributed Denial of Service (DDoS) attack on the Solana blockchain, peaking at 6Tbps, remains ineffective so far but continues to add pressure on traders’ sentiment. Additionally, the derivatives market sentiment is bearish, as Open Interest falls and funding rates turn negative.

The United Kingdom’s Financial Conduct Authority (FCA) launched a series of consultations on proposed rules for digital asset markets, marking the next phase in the government’s effort to establish a comprehensive regulatory framework for crypto assets.
DeFi Technologies Inc. finds its equity caught in a complex tug-of-war. The firm announced a significant strategic advancement in South America today, yet its share price continues to grapple with substantial legal overhangs and a softening cryptocurrency market. The central question for investors is whether this operational progress can outweigh persistent financial and legal concerns.
Investor sentiment remains dampened by recent financial disclosures. The company’s third-quarter results, released in November, included a dramatic revision to its full-year 2025 revenue forecast. Management slashed its projection from $218.6 million to approximately $116.6 million—a near-halving of expectations. This guidance cut precipitated an immediate 27% decline in the stock price to $1.05, an impact that continues to linger.
Compounding this financial pressure, several law firms are currently mobilizing shareholders for class action lawsuits. The deadline to join these collective actions is January 30, 2026. Furthermore, the broader digital asset sector is providing little support. Bitcoin corrected into the $85,000 range today, triggering sector-wide liquidations. As DeFi Technologies’ business model is directly tied to digital asset performance, such market downturns affect it acutely. Even positive fundamental news, such as today’s announcement from Visa regarding USDC settlement on the Solana blockchain, is largely lost amid prevailing market risk aversion.
Should investors sell immediately? Or is it worth buying DeFi Technologies?
On the operational front, the company marked a decisive step forward. Its subsidiary, Valour, secured official approval from the B3 exchange on December 16 for the Valour Solana (VSOL) Exchange-Traded Product (ETP). Trading is scheduled to commence tomorrow. This move substantially deepens the firm’s presence in its first major market outside of Europe. The VSOL ETP will join an existing portfolio of already-approved products tracking Bitcoin, Ethereum, XRP, and Sui.
In a parallel development, the Canadian company obtained approval for Brazilian Depositary Receipts (BDRs). These instruments, set to trade under the ticker DEFT31 starting December 17, will provide Brazilian institutional investors with their first opportunity for direct access to the company’s equity.
Market participants now face the challenge of evaluating two divergent narratives. One storyline highlights the concrete execution of the company’s roadmap, evidenced by tomorrow’s launch of new products on a key international exchange. The opposing narrative emphasizes the considerable constraints imposed by the slashed revenue forecast and ongoing legal uncertainties, which significantly cap the potential for a near-term share price recovery. The balance between these operational gains and financial liabilities will likely determine the equity’s trajectory in the coming months.
Ad
DeFi Technologies Stock: Buy or Sell?! New DeFi Technologies Analysis from December 16 delivers the answer:
The latest DeFi Technologies figures speak for themselves: Urgent action needed for DeFi Technologies investors.
Is it worth buying or should you sell? Find out what to do now in the current free analysis from December 16.
DeFi Technologies: Buy or sell?
Read more here…
Copper prices eased on Tuesday, December 16, 2025, extending the market’s pullback from last week’s record highs as traders weighed weaker signals from China’s economy, year-end liquidity conditions, and shifting expectations around U.S. trade policy.
After surging to an all-time high of $11,952 per metric ton on the London Metal Exchange (LME) last Friday, copper has turned more volatile—moving sharply on every new data point and headline about inventories, tariffs, and demand from AI-related infrastructure. [1]
Copper is traded globally across several benchmarks, and prices can differ by exchange and contract month. Here are the key reference points from today’s coverage:
Why the numbers don’t perfectly match: LME “three‑month copper” is typically quoted in $/ton, SHFE in yuan/ton, and COMEX in $/lb. On top of that, outlets reference different timestamps (Asian open vs. London morning vs. close), and some feeds are delayed or contract-specific. [7]
The day’s dominant macro driver was renewed concern about demand in China, the world’s largest copper consumer.
Reuters reporting cited slower factory output growth to a 15‑month low in November, with new home prices continuing to decline—a reminder that the property sector remains a persistent drag. [8]
At the same time, copper’s pullback is not just about China. The market has been wrestling with a second narrative: whether part of the late‑2025 rally has become overly “crowded” and speculative, tied to the idea that AI data centers and electrification will overwhelm supply. Reuters noted that renewed fears of an “AI bubble” contributed to a sharp sell-off after the recent record high. [9]
In plain terms: copper is being traded as both a growth metal and a theme trade. When investors feel confident about global growth and AI capex, copper can behave like a momentum asset. When doubts emerge—about China, tech valuations, or macro conditions—the market can snap back quickly.
Another important piece of today’s copper story is market structure rather than fundamentals.
A separate Reuters update described cautious trading ahead of U.S. jobs data and thinning year‑end liquidity, warning that reduced depth can exaggerate intraday moves. [10] In that report, analysts flagged that base‑metals price action is becoming more jumpy into late December—making copper especially vulnerable given how far it has run this year.
That same Reuters dispatch also highlighted a key “real economy” indicator watched closely by metals desks: the Yangshan copper premium (often used as a proxy for Chinese import demand) has stabilized around $42, described as a two‑month high. [11] This doesn’t erase the weak macro prints from China, but it does suggest that physical market signals are not uniformly bearish.
Even after today’s dip, copper remains one of the standout performers of 2025.
Reuters reporting said copper is up about 33% year-to-date, on track for its biggest annual rise since 2009, driven by a mix of mine disruptions, U.S.-linked inventory flows, and expectations for AI and energy-transition demand. [12]
Those drivers matter because they help explain why copper has been able to set records even while some traditional demand signals (like parts of China’s property market) remain weak.
If there is one theme that repeatedly shows up in today’s copper news cycle, it is this: U.S. tariff risk is influencing real-world copper flows—and, by extension, the price discovery process.
A Reuters item published today said Goldman Sachs raised its 2026 copper price forecast to $11,400 per metric ton(from $10,650). [13]
The same report described the bank’s view that the market is increasingly centered on the timing and design of potential U.S. copper import tariffs. Goldman discussed a scenario framework including:
Goldman also noted that the possibility of future tariffs can keep U.S. copper prices at a premium to the LME benchmark and encourage stockpiling, tightening availability outside the U.S. [15]
Reuters reported that daily inflows to COMEX copper stocks have continued, with inventories already at record highs, a dynamic linked to the price premium and tariff uncertainty. [16]
A Business Insider analysis published today makes a similar point in plain language: large U.S. inventories can become effectively “stuck” in-country, leaving the rest of the world with a tighter tradable pool—one reason the market can feel squeezed even when broader forecasts point to surplus conditions. [17]
One reason copper is so volatile right now is that major institutions disagree on the 2026 balance.
In the same Reuters piece on Goldman’s forecast, the bank lifted its forecast for the 2026 global market surplus to 300,000 tons (from 160,000 tons). [18]
That combination—a higher price forecast alongside a larger surplus estimate—sounds contradictory at first glance. But it becomes more coherent if you think in terms of regional dislocations: copper can be “surplus” globally while still feeling tight in the places that matter most for deliverable exchange stocks and spot premiums, especially if U.S. flows continue to distort availability elsewhere.
A separate Reuters excerpt on Morgan Stanley said the bank expects copper to post a 260,000‑ton deficit in 2025 and a much larger 600,000‑ton deficit in 2026. [19]
Morgan Stanley also flagged that copper inventories outside the United States are low and could shrink further if U.S. imports continue and data-center demand outpaces supply growth. [20]
Bottom line: On Dec. 16, the market is being pulled between two coherent—but different—stories:
Copper’s record pricing is also feeding back into corporate strategy and politics.
A Financial Times report today said the Canadian government has approved the $60 billion merger between Anglo American and Teck Resources, creating one of the world’s biggest copper producers (with the merged entity set to be headquartered in Vancouver, according to the report). [23]
M&A of this scale matters for price watchers because it reflects a broader reality: high-quality copper assets are scarce, project timelines are long, and governments increasingly treat copper supply as strategic—especially with electrification, grid buildouts, and data-center expansion all competing for the same material.
Copper’s direction into late December is likely to depend on a short list of fast-moving variables:
Copper price today is not being set by one single driver—it’s being set by the intersection of China’s uneven recovery, tight supply narratives, AI- and electrification-linked demand expectations, and a uniquely powerful swing factor: U.S. trade policy and stockpiling.
That mix helps explain why copper can sit near record territory while still selling off hard on a weak China print, and why 2026 forecasts can disagree so widely—even among top-tier institutions—without either side sounding unreasonable. [28]
1. www.tradingview.com, 2. www.tradingview.com, 3. www.brecorder.com, 4. www.lme.com, 5. www.tradingview.com, 6. www.investing.com, 7. www.brecorder.com, 8. www.tradingview.com, 9. www.tradingview.com, 10. www.brecorder.com, 11. www.brecorder.com, 12. www.brecorder.com, 13. www.tradingview.com, 14. www.tradingview.com, 15. www.tradingview.com, 16. www.tradingview.com, 17. www.businessinsider.com, 18. www.tradingview.com, 19. www.tradingview.com, 20. www.tradingview.com, 21. www.tradingview.com, 22. www.tradingview.com, 23. www.ft.com, 24. www.tradingview.com, 25. www.reuters.com, 26. www.tradingview.com, 27. www.brecorder.com, 28. www.tradingview.com
The US dollar initially tried to rally against the Japanese yen but then rolled over to show signs of hesitation on the bullish side. That being said, the 155 yen level does look like it’s trying to offer a little bit of support. And therefore, I think this could end up being a small buying opportunity. I recognize that there are a lot of questions right now about the Federal Reserve and what’s happening next. But at this point, the one thing that I do know is that the interest rate differential will continue to favor the US dollar.

Therefore, over the longer term, it should favor this pair going higher. Even if we were to break down from here, the 50-day EMA comes into the picture at just about 154 yen to offer support and then again at 152 yen, which I think is more likely than not, we do get a little bit of a pullback, but I think it ends up being a buying opportunity. That’ll be especially true once we get through the Bank of Japan later this week.
And therefore, I think a little bit of choppy sideways volatility makes a certain amount of sense. But as I’ve been saying for months, I’ve been holding this pair. I get paid every day to hold this pair. That’s the power of the carry trade. And the carry trade is expected to be a big thing again, especially if the United States remains a little more hawkish than originally thought.
And most of the leading economic numbers in the United States do suggest that 2026 may not be a bad year for the US economy at all. With this, and the fact that the Japanese have a structural problem with the ability to really tighten monetary policy, I think these dips continue to offer buying opportunities if you’re patient enough, probably a much longer-term one, but even shorter-term traders are jumping on this train.
Want to trade our USD/JPY forex analysis and predictions? Here’s a list of forex brokers in Japan to check out.
Christopher Lewis has been trading Forex and has over 20 years experience in financial markets. Chris has been a regular contributor to Daily Forex since the early days of the site. He writes about Forex for several online publications, including FX Empire, Investing.com, and his own site, aptly named The Trader Guy. Chris favours technical analysis methods to identify his trades and likes to trade equity indices and commodities as well as Forex. He favours a longer-term trading style, and his trades often last for days or weeks.
FDA approves drug for women’s sexual health concerns, a new study examines nail fungus impact on athletic performance while supplement labeling rules reviewed.
CLEVELAND — The Food and Drug Administration has approved expanded use of Addyi, a medication designed to address low sexual desire in women, now including post-menopausal women under age 65.
Sprout Pharmaceuticals, the drug’s manufacturer, said the approval represents a significant development in understanding women’s sexual health. Addyi treats hypoactive sexual desire disorder, a condition characterized by persistently low sexual desire. The FDA initially approved the medication in 2015 for premenopausal women. Six years later, Health Canada approved its expanded use for post-menopausal women, paving the way for this U.S. approval.
In separate FDA news, the agency is considering changes to dietary supplement labeling requirements that could affect how consumers see safety warnings. Currently, supplement packages must display a disclaimer next to every health claim stating the FDA has not evaluated the statement and the product is not intended to diagnose, treat, cure or prevent disease. The proposed change would require this warning only once per package rather than repeating it with each claim.
The FDA says the modification would reduce label clutter and costs for manufacturers. However, some medical experts express concern that consolidated warnings could be easier for consumers to overlook. The change carries particular significance given that more than three-quarters of Americans take dietary supplements, and unlike prescription drugs, these products are not reviewed for safety and effectiveness before reaching store shelves. Approximately 100,000 supplement products are currently available nationwide.
Meanwhile, researchers at Case Western Reserve University and University Hospitals have launched the first comprehensive study examining nail fungus in athletes. The condition affects athletes at rates 2.5 times higher than the general population, according to research published in the Journal of the American Academy of Dermatology.
Dr. James Voos, chairman of Orthopedic Surgery at University Hospitals, explained that nail fungus can alter athletic performance by affecting gait, reducing training consistency and impacting competitive outcomes. The six-month study will survey 100 to 200 collegiate and professional athletes across multiple sports, gathering data on how the fungal infections affect daily activities, confidence and athletic function.
Dr. Mahmoud Ghannoum, director of the Center for Medical Mycology at Case Western Reserve and the study’s lead researcher, noted there is limited data showing prevalence rates across different sports despite high-risk factors. Athletes face increased exposure due to warm, moist environments created by intense training, restrictive footwear and shared facilities. Initial results are expected by June, with findings potentially benefiting military personnel and other groups facing similar risk factors.


")
