The main category of All News Articles.
You can use the search box below to find what you need.
[wd_asp id=1]
The main category of All News Articles.
You can use the search box below to find what you need.
[wd_asp id=1]
Spot Gold extended its advance on Thursday, trading just below the December peak at $4,264.62. The XAU/USD advances for a third consecutive day on the back of a weaker US Dollar (USD), the latter weighed by the Federal Reserve (Fed) December monetary policy decision.
The central bank announced a 25 basis points (bps) interest rate cut on Wednesday, but maintained an overall hawkish stance, as the Summary of Economic Projections (SEP) showed policymakers are unwilling to move on with steeper interest rate cuts, despite United States (US) President Donald Trump’s pressure on the matter.
Indeed, Federal Open Market Committee (FOMC) member Stephen Miran voted for a larger cut, but two other officials opted to keep interest rates on hold. Even further, the SEP maintained the view of just one interest rate cut for 2026, and anticipated another one in 2027. Market players initially considered buying the USD, yet by the end of the day, the Greenback was on the back foot, as investors still hope for a change in monetary policy coming next year.
Early Thursday, the US published Initial Jobless Claims for the week ended December 6, which unexpectedly jumped to 236K. The discouraging figure further fueled hopes for additional rate cuts, pushing USD lower across the FX board.
Friday will bring little of interest in terms of data, with sentiment likely to keep ruling financial boards.
In the 4-hour chart, XAU/USD trades at $4,258.05, up for the day, and hinting at additional gains ahead. The 20-period Simple Moving Average (SMA) rises above the 100- and 200-period SMAs, and all three slope modestly higher, underscoring a bullish trend. Price holds above these gauges, with the 20 SMA at $4,209.49 offering nearby dynamic support and the 100 SMA at $4,170.32 underpinning the structure. At the same time, the Momentum indicator remains within positive levels, easing from a recent spike yet maintaining bullish pressure. Finally, the Relative Strength Index (RSI) indicator stands at 65, leaving room for a continuation before momentum stretches.
In the daily chart, XAU/USD trades above all bullish moving averages, in line with another leg north. The 20-day SMA at $4,159.19 offers nearby dynamic support. Meanwhile, the Momentum indicator expands above its midline, while the RSI advances at around 65. The trend structure remains favorable while the shorter averages stay stacked above the longer ones.
(The technical analysis of this story was written with the help of an AI tool)
Vitamin D deficiency is incredibly common, with one study estimating that 20% of Americans don’t get enough of this essential nutrient, which supports bone health as well as proper nerve, muscle, and immune function.
While supplements can help fill the gap, certain foods—and, of course, exposure to the sun’s ultraviolet rays—also contribute to daily intake. Adults need about 600 international units (IU) of vitamin D per day until age 71, when the recommendation increases to 800 IU. Here are five foods or drinks that can help you meet your vitamin D needs.
Fatty fish, such as salmon, mackerel, and sardines, are among the richest natural sources of vitamin D3, the form most easily used by the body, Morgan Walker, MS, RD, LDN, a sports nutritionist and adjunct professor at Lebanon Valley College, told Health.
One 3-ounce serving of rainbow trout contains 645 IU of vitamin D, while the same amount of sockeye salmon has 570 IU. Canned tuna and salmon are convenient and economical options as well; you can add them to salads and sandwiches or use them to make fish “burger” patties.
Egg yolks contain vitamin D3, though not nearly as much as fatty fish. One large egg has 44 IU.
There are plenty of ways to enjoy eggs, but deviled eggs put the yolks front and center, said Jen Hernandez, RDN, CSR, a registered dietitian nutritionist focusing on renal health and founder of Plant-Powered Kidneys. They’re traditionally made with mayo (which also contains eggs), but Hernandez swaps in low-fat Greek yogurt for more protein.
Omelets, fried rice, and baked goods are other easy ways to incorporate more eggs into your diet.
There aren’t many plant-based foods that naturally contain vitamin D, but mushrooms that have been exposed to ultraviolet light do. A 1/2 cup of sliced white UV-exposed mushrooms provides about 366 IU. Look for labels that say “High Vitamin D” or “UV-Exposed.”
Shiitake, button, oyster, and other mushrooms contain a precursor to vitamin D called ergosterol. When UV rays hit the mushrooms, ergosterol converts to vitamin D2—a process similar to how sunlight triggers vitamin D production in our skin.
Hernandez likes roasting mushrooms or using them in a risotto. But make sure to include some healthy fats along with them. “With all of the vitamin D foods, because vitamin D is fat-soluble, it is important to include some type of fat to help absorb the vitamin D,” she told Health.
Fortified dairy products, such as cow’s milk and yogurt, typically provide vitamin D3, while most fortified plant-based milks and non-dairy yogurts are fortified with vitamin D2, Walker said.
One cup of fortified 2% reduced-fat milk contains 120 IU. Meanwhile, a cup of fortified soy, almond, or oat milk has between 100 and 144 IU, depending on the type.
Many breakfast cereals are fortified with vitamin D. While the amount varies by brand, they typically provide around 80 IU per serving.
Dumont doesn’t recommend getting the bulk of your vitamin D intake through processed fortified cereals. But they can be a good way to tick up those numbers, especially for kids who might shy away from mushrooms, eggs, or fish.
If you regularly spend time outdoors (research suggests that sunscreen doesn’t block vitamin D production) and have a diet full of foods rich in vitamin D, you probably don’t need a supplement, Dumont said.
However, experts noted that people who live in areas with limited sun exposure, spend most time indoors, have darker skin, or follow a vegan or vegetarian diet may benefit from supplementation. Many people with a vitamin D deficiency don’t have symptoms, but possible signs include muscle weakness, bone pain, and fatigue. A simple blood test—which Hernandez recommends people get twice a year, around daylight savings time—can confirm your levels.
Before taking vitamin D, it’s a good idea to consult your physician to ensure it won’t interact with other medications or existing health conditions.
Dogecoin Price Prediction often comes back into focus whenever meme coins start moving, but many traders are now questioning what can drive the next move higher. In the short term, most Dogecoin price prediction views centre on whether the price can reclaim the $0.16 level and hold above it with consistent volume.
At the same time, some holders now look at utility-based projects for new upside. This is where Remittix enters the picture, with many investors treating it as a payment-focused alternative that might capture wandering DOGE investors while Dogecoin Price Prediction debates continue.
Dogecoin Price Prediction And The Pull Of Meme Liquidity
Dogecoin trades around $0.146, with a market cap of $22.2 billion and a 24-hour volume of about $1.7 billion. Its size and liquidity mean any Dogecoin Price Prediction needs to account for a long trading history and steady market participation. In the short term, price continues to move within the $0.14 to $0.16 range, with many analysts watching a clear break above $0.16 as a signal for further upside.
Longer-term outlooks remain broad. Some forecasts place 2026 targets between $0.20 and $0.50 https://www.btcc.com/en-IN/amp/square/coincentral/1036741, highlighting how much Dogecoin still depends on meme demand rather than traditional valuation metrics. Overall sentiment is mixed, with DOGE seen by some as a trading asset, while others point to concentrated whale holdings as a continued source of large price swings.
Remittix Utility Case For Wandering DOGE Investors
Dogecoin Price Prediction depends mainly on sentiment, social media, and broad crypto market risk appetite. Remittix https://remittix.io, by contrast, positions itself as a Remittix DeFi project built for payments, remittance, and real transaction volume. It aims at solving real-world problems by building a bridge between on-chain value and fiat bank rails.
Remittix has already sold more than 693.2 million tokens, which are currently priced at $0.119 each, and raised over $28.5 million, which signals strong demand for this early-stage crypto investment story around payments. The core pitch is simple: DOGE offers meme strength, while Remittix aims to offer repeat usage and fee-driven value.
Here are Remittix features that can capture wandering DOGE investors:
● Tackles $19 trillion payments market with real-world solutions
● Direct crypto-to-bank transfers in 30+ countries
● Utility-first token with real transaction volume
● Backed by a working infrastructure
● Mass-market appeal beyond crypto natives
The Remittix team is now fully verified by CertiK https://skynet.certik.com/projects/remittix-labs, with a Skynet Score of 80.09 and a Grade A rating, and the project currently holds the number one slot for pre-launch tokens on the platform.
On the product side, the Remittix wallet https://apps.apple.com/app/remittix-wallet/id6747745484 is live on the Apple App Store as a full crypto wallet that already supports secure transfers and asset management, with crypto-to-fiat payout features planned for a December update https://x.com/remittix/status/1989646857090523423 that will let users send crypto and have receivers get local currency in bank accounts.
Dogecoin Price Prediction And The Rotation Toward Utility
Dogecoin Price Prediction will remain a regular theme for traders who enjoy high liquidity and strong social presence, and DOGE may still deliver sharp moves when meme flows return. Yet the same investors now look more closely at where long-term value may come from.
Utility projects that solve clear payment problems have started to gain attention from holders who once relied only on meme cycles. Remittix https://remittix.io fits this shift by lining up CertiK verification, a live iOS wallet, planned crypto-to-fiat rails, strong community support, and clear incentives that reward participation.
For anyone tracking Dogecoin Price Prediction and wondering where the next phase of growth might sit, Remittix stands out as a payment-first token that can capture wandering DOGE investors and push beyond meme-driven moves.
Discover the future of PayFi with Remittix by checking out their project here:
Website: https://remittix.io/
Socials: https://linktr.ee/remittix
$250,000 Giveaway: https://gleam.io/competitions/nz84L-250000-remittix-giveaway
Frequently Asked Questions
1. What is the current outlook for Dogecoin price prediction?
Dogecoin is trading in a tight $0.14 to $0.16 range, with most short-term Dogecoin price prediction models watching for a clean break above $0.16. Without a strong meme catalyst, upside depends largely on broader market sentiment rather than fundamentals.
2. Why are some DOGE holders looking at utility projects now?
Many DOGE investors are seeking assets with clearer long-term value beyond social hype. Utility projects tied to payments or real usage offer a different growth path than meme-driven price cycles.
3. How does Remittix differ from Dogecoin as an investment?
Dogecoin relies mostly on sentiment and community activity, while Remittix is built around payments and remittance use cases. Its value thesis is linked to transaction volume and real-world adoption rather than memes.
4. What progress has Remittix made that attracts wandering DOGE investors?
Remittix already has a live wallet on the Apple App Store, CertiK verification, and plans for crypto-to-bank transfers. It has raised over $28.5 million, showing early demand for a payment-focused model.
5. Can Dogecoin and Remittix coexist in the same portfolio?
Yes, some investors view DOGE as a high-liquidity trading asset and Remittix as a longer-term utility play. Holding both allows exposure to meme-driven moves while also targeting growth from real payment usage.
Disclaimer: This article is for informational purposes only and does not constitute financial advice. Cryptocurrency investments carry risk, including total loss of capital. Readers should conduct independent research and consult licensed advisors before making any financial decisions.
Crypto Press Release Distribution by https://btcpresswire.com
This release was published on openPR.
Currency prices moved positively against the US Dollar after the Federal Reserve cut the key US interest rate for the third consecutive time on Wednesday, though it signaled the possibility of keeping it unchanged in the coming months—a move that could anger President Donald Trump, who has demanded sharp reductions in borrowing costs. According to reliable trading platforms, the EUR/USD pair rebounded to the 1.1680 resistance level at the time of writing this analysis. These gains may push the EUR/USD trend out of the neutral zone that dominated trading recently while awaiting the Fed announcement.
The bullish scenario for EUR/USD requires more work to confirm the strength of the bulls’ control. On the daily chart, the psychological resistance of 1.1800 remains the key to a confirmed bullish shift. The pair’s recent gains pushed the Relative Strength Index (RSI) to the 61 level, which supports a technical correction upward, but it still has more room for stronger gains before reaching the overbought zone. The MACD indicator is also moving positively. The echoes of the Fed’s decisions, its policy statement, and updated projections will continue to influence EUR/USD trading in the coming days.
The scenario for a EUR/USD pullback over the same timeframe is linked to the bears bringing the currency prices back toward the vicinity of the psychological support of 1.1500 once again.

Be cautious. The EUR/USD’s upward trend is still in its early stages. We await confirmation of this and recommend buying from the 1.1500 support level again, but never take unnecessary risks.
Following the widely anticipated announcement of a US interest rate cut, the Federal Reserve’s interest rate-setting committee indicated in a statement released after a two-day meeting that it is likely to keep US interest rates unchanged in the coming months. In a series of quarterly economic projections, Federal Reserve officials indicated they expect to cut US interest rates only once next year. Overall, yesterday’s rate cut brought the federal funds rate down by a quarter of a percentage point to around 3.6%, its lowest level in nearly three years. Lower interest rates by the Federal Reserve can reduce borrowing costs for mortgages, auto loans, and credit cards over time, although market forces may also influence these rates.
At the final meeting of 2025, three Fed officials opposed the move, the most dissenting votes in six years, indicating deep divisions within a committee that traditionally operates by consensus. Two officials voted to keep the U.S. interest rate unchanged, while Stephen Miran, appointed by Trump in September, voted for a half-point cut.
The December meeting may well signal a more tense period for the Fed. Officials are divided between those who favor lowering U.S. interest rates to stimulate employment and those who favor keeping them unchanged because inflation remains above the central bank’s 2% target. Unless there are clear signs of full control over inflation, or unemployment worsens, these divisions are likely to persist.
Ready to trade our daily Forex analysis? We’ve made a list of the best forex trading platforms for beginners worth trading with.
New clinical science supports NXT USA’s claims that its patent-pending herbal blend, BluNADBooster, outperforms a popular NAD+ precursor, nicotinamide riboside (NR), in raising NAD+ levels. However, combining both ingredients demonstrated synergies for improved performance, brain health, reduced inflammation, and overall quality of life.
The findings are especially timely, as consumer awareness around NAD+ and its precursors is growing and advancing research-based longevity claims. Earlier this month, the US FDA confirmed that another common precursor, nicotinamide mononucleotide (NMN), can be marketed as a dietary supplement.
As a polyphenol-rich formula blending extracts from pomegranate and marigold, BluNADBooster itself is not a precursor. “The market has been waiting for an NAD+ solution that goes beyond precursors alone,” notes Eric Anderson, managing director at NXT USA and CEO of Blue Helix Health.
“BluNADBooster represents a next-generation approach — one that strengthens the body’s ability to generate and maintain healthy NAD⁺ levels while addressing the underlying mechanisms that cause NAD⁺ to decline with age,” he adds.
“This study confirms what we’ve believed for years: polyphenols matter, and they work in ways synthetic precursors cannot.”
The new study published in the Journal of Functional Food backs BluNADBooster’s “significant improvements” in key biomarkers for mitochondrial health, energy metabolism, inflammation, cognition, physical performance, and quality of life scores.
Researchers evaluated 140 healthy aging adults who received either a placebo, 500 mg of NR, 1,000 mg of BluNADBooster alone, or a blend of 500 mg of BluNADBooster and 500 mg of NR.
 They found that BluNADBooster alone increased blood NAD+ levels by 26.48% and outperformed NR, which recorded a 22.69% increase.They found that BluNADBooster alone increased blood NAD+ levels by 26.48% and outperformed NR, which recorded a 22.69% increase. Meanwhile, the combination of both produced the largest rise (31.76%), highlighting their synergies.
Overall, the research supports BluNADBooster as a cellular energy and longevity supplement for adults seeking proactive natural NAD+ support.
BluNADBooster also inhibited CD38, a multifunctional protein on cell surfaces that drives NAD+ depletion when its levels are elevated along the aging process. As a result, BluNADBooster reduced enzymatic activity by 17.98%, according to the researchers.
“This preservation of intracellular NAD+ pools supports healthier energy balance, more efficient metabolic signaling, and broader longevity pathways,” they note.
Through its rich polyphenol profile, BluNADBooster offered anti-inflammatory support, lowering key biomarkers associated with systemic inflammation and “inflammaging,” including TNF-α, IL-6, and GDF-15.
In addition to its metabolic and inflammatory benefits, BluNADBooster also delivered cognitive support for healthy aging. Participants experienced significant improvements in cognitive performance, measured by the Mini-Mental State Evaluation system.
BluNADBooster also contributed to improved physical endurance and energy, with the combination group showing a 9.94% increase in distance during the six-minute walk test.
“Health-related quality of life scores were significantly greater in all groups after 60 days, with the combination therapy of BluNADBooster and NR having the greatest improvements in energy/fatigue, daily living, bodily pain, emotional well-being, social functioning, and general health,” NXT USA reports.
This week, botanical nutraceutical producers under the Natural Products Association (NPA) hailed a “significant victory” for the dietary supplement industry as the US FDA confirmed this month that the NAD+ precursor NMN can be marketed as a dietary supplement, reversing a 2022 determination.
“This is a significant development as it follows actions taken by the FDA in September, when the agency reversed its previous determination that the investigation of NMN as a drug precluded its use in supplements. FDA’s determination came in response to an amended citizen petition and a lawsuit against FDA brought by NPA,” states the NPA.
“FDA’s recent letters — including its response to our amended citizen petition — represent a massive U-turn, and we’re proud that we were able to help shape the outcome. NPA strongly objected when FDA made the wrong decision on NMN three years ago, and we fought it in the regulatory arena, in conversations with congressional offices, and ultimately in the courts,” says Daniel Fabricant, Ph.D., president and CEO of NPA.
Following the FDA’s response to NPA’s citizen petition in September, which resolved the NMN controversy, the association filed a notice to voluntarily dismiss (without prejudice) its lawsuit against the FDA in the Federal District Court.
“While others sat on the sidelines, NPA’s efforts delivered an unequivocal victory on this specific issue,” Fabricant adds. “Furthermore, because of our actions, the FDA has now provided extremely valuable and additional clarity on the drug preclusion clause in the Dietary Supplement Health and Education Act of 1994, so this is, in a sense, a two-fer.”
“NPA will use this opening to advance a legislative solution to the drug preclusion clause, which has been inconsistently interpreted and applied in ways that threaten lawful supplement ingredients long after they have been safely marketed to consumers.”
NPA’s successful efforts to legitimize NMN required “extraordinary investments,” including the filing of a formal citizen petition and subsequent litigation against the FDA, notes Fabricant.
“Absent congressional action, the same uncertainty now looms over peptides and other next-generation ingredients that may become entangled in investigational new drug applications, chilling research, deterring investment, undermining innovation, and limiting consumer choice,” he cautions.
“Regulatory clarity is essential to ensure that DSHEA continues to function as Congress intended by providing a predictable, science-based framework that protects consumers while allowing innovation to flourish.”
XRP price prediction discussions are heating up again, as fresh on-chain data shows crypto whales quietly accumulating large amounts of XRP. Exchange balances have dropped sharply, ETF inflows are climbing, and institutional demand appears to be returning despite broader market uncertainty.
With XRP price today holding key support levels, traders are beginning to question whether this silent buying phase is the early signal of a stronger move forming beneath the surface.
XRP Price Prediction Holds Key Levels While Whale Activity Builds Momentum
The current XRP price is at $2.09, and fresh XRP news indicates that a change is occurring in the background with the crypto whales quietly accumulating positions. According to recent data, the exchange balances https://x.com/ChartNerdTA/status/1998525990000275945 have declined drastically by dropping to 2.6 billion tokens from 3.95 billion tokens. This is an indication of a definite shift towards long-term storage and accumulation, which is favorable to a more robust XRP price prediction as supply remains low in trade platforms.
Institutional interest is also rising fast. XRP-focused ETFs have pulled in $935 million, marking 16 straight days of inflows. XRP news from SoSoValue and CoinShares shows these funds outperforming Ethereum and Solana products. Analysts point to Ripple’s legal momentum, Ripple USD (RLUSD), and Ripple Prime as catalysts reinforcing confidence in Ripple’s ecosystem.
The XRP price is technically still in the consolidation phase. Although traders believe that once it breaks above the $2.20 mark, it can be a sign of a bullish move and a gateway to $2.50. If momentum fades, key support sits around $1.65.
Despite broader market uncertainty, the steady whale accumulation and institutional buying wave remain the standout narrative. With circulating supply tightening and demand rising, many traders believe this may be the moment XRP positions itself for a stronger breakout than other large caps.
Feature / Market Signal – XRP – Remittix (RTX)
Current Narrative – Whale accumulation rises as exchange balances drop and ETFs see inflows – Investors rotate toward utility tokens, solving real-world payment problems
Key Demand Signal – 1.35 billion XRP removed from exchanges in 60 days – $28.5M raised with 693M tokens acquired by early participants
Primary Utility – Cross-border liquidity for institutions via Ripple products – Instant crypto-to-fiat PayFi transfers into 100+ bank networks
Market Drivers – ETF inflows, legal clarity, institutional interest – Real-world adoption, rapid user growth, and upcoming CEX listings
Whale Activity – Exchanges see declining supply, indicating accumulation – Strategic early accumulation ahead of liquidity events
Upcoming Catalyst – FOMC-driven volatility; ETF inflows – BitMart listing confirmed; more top-tier listings on the way
Ecosystem Expansion – Ripple USD (RLUSD), Ripple Prime adoption – PayFi rollout, global wallet integration, Android + iOS releases
Why Investors Are Watching – Potential breakout if $2.20 flips; reduced sell pressure – Clear path to mass adoption and real-world scaling potential
Adoption Trends Suggest Remittix May Be the Next Breakout Payment Token
As analysts track rising accumulation trends across major assets, Remittix https://remittix.io is emerging as one of the best cryptos to buy now for investors watching where quiet smart money is flowing. While XRP whales reduce exchange balances and institutions expand exposure across compliant payment tokens, Remittix is gaining attention for a different reason altogether: it delivers real utility today.
With more than 693.2 million tokens already in circulation and over $28.5 million raised, momentum is shifting toward projects that solve tangible problems, not narrative-driven experiments.
Remittix is becoming a standout because it offers something users actually need. Its PayFi system settles crypto-to-fiat transfers into bank accounts across 100+ countries, bridging a gap that even large-cap payment coins struggle to address. That growing relevance is why market watchers view Remittix as an early mover with meaningful long-term upside.
Investors also point to several trust signals shaping sentiment:
● Full auditing and team verification through CertiK https://skynet.certik.com/projects/remittix-labs#fundamental-health
● Ranked #1 on CertiK for pre-launch tokens
● BitMart confirmed as the first major exchange listing
● A 15% USDT referral reward is claimable every 24 hours
This combination of real adoption, security, and upcoming market access is why quiet accumulation around Remittix https://remittix.io is accelerating. As liquidity deepens and exchange listings roll out, many believe Remittix could follow the same accumulation-to-breakout pattern seen in earlier payment-focused winners.
Discover the future of PayFi with Remittix by checking out their project here:
Website: https://remittix.io/
Socials: https://linktr.ee/remittix
$250K Giveaway: https://gleam.io/competitions/nz84L-250000-remittix-giveaway
Frequently Asked Questions
1. What catalysts could push XRP higher?
Several factors could influence the upward movement in XRP price. Whale accumulation reduces exchange supply, easing sell pressure. ETF inflows signal growing institutional confidence, while Ripple’s ongoing ecosystem updates, such as RLUSD and enterprise partnerships, improve long-term utility. If XRP price today keeps its support zone intact and the market turns more positive, both catalysts could fuel a bigger rally.
2. Is XRP a good long-term investment?
According to analysts who follow XRP news, the token can be helped by increased institutional participation, reduced exchange balances, and expanding real-world use cases. Long-term investors are interested in XRP due to its long-term history and emphasis on international payments. Nevertheless, the cryptocurrency market is unpredictable, and XRP price prediction must take into account the risk tolerance and market dynamics.
Disclaimer: This article is for informational purposes only and does not constitute financial advice. Cryptocurrency investments carry risk, including total loss of capital. Readers should conduct independent research and consult licensed advisors before making any financial decisions.
Crypto Press Release Distribution by https://btcpresswire.com
This release was published on openPR.
Natural Gas Prices in 2025 showed sharp regional differences driven by LNG flows, supply constraints, and changing demand patterns. Q3 pricing revealed strong increases in the USA and India, while Germany remained the highest-cost region. The latest insights highlight evolving trade dynamics and shifting consumption across global energy markets.
Global Natural Gas Prices in 2025 showed significant regional divergence as supply conditions, LNG flows, geopolitical tensions, and seasonal demand influenced overall movement. According to the latest Natural Gas Price Trend Report, Q3 price levels across the USA, China, Saudi Arabia, Germany, and India reflected shifting consumption patterns and evolving output dynamics. With companies and investors closely monitoring the Natural Gas price index, chart trends, and forecast models, this update provides a data-backed view of current and upcoming pricing developments.
Natural Gas Price Trend Analysis
During the third quarter of 2025, Natural Gas Prices demonstrated varying momentum across major regions. The USA settled at USD 3.81/MMBtu due to balanced domestic production and stronger summer demand. China reached USD 2.72/MMBtu as LNG imports stabilized. Saudi Arabia reported USD 2.75/MMBtu under consistent output conditions. Germany recorded USD 11.6/MMBtu amid supply constraints, while India reached USD 4.70/MMBtu driven by industrial requirements and rising consumption.
Natural Gas Price Forecast 2025
Forecast models suggest Natural Gas Prices may witness moderate fluctuations through late 2025, influenced by global LNG trade patterns, storage capacity, and energy transition momentum. Stable production in the U.S. and Middle East may help maintain balanced pricing, while Europe could continue experiencing elevated values. Long-term outlooks project steady growth as renewable integration reshapes demand profiles. The Natural Gas price index remains essential for forecasting short-term volatility.
Natural Gas Price Chart & Index
The 2025 Natural Gas price chart illustrates volatility in Europe compared to relative steadiness in Asia and North America. The Natural Gas price index highlights price resilience in high-demand regions and sharper swings where supply disruptions persist.
Users can track real-time charts, indexes, and forecast updates at:👉 https://www.imarcgroup.com/natural-gas-pricing-report/requestsample
Natural Gas Price Historical Analysis Data
A review of Natural Gas price history shows strong connections between weather patterns, industrial output, and LNG shipping dynamics. Europe has historically recorded higher price averages due to import dependency. Meanwhile, supply-rich regions often maintain stable long-term pricing. Historical data from 2021–2024 points toward rising global competition for LNG volumes and increased sensitivity to geopolitical events.
What Factors Determine the Price of Natural Gas?
Key contributors shaping Natural Gas Prices include:
These factors collectively determine the price of Natural Gas across different economies.
What Changed in 2025?
In 2025, renewed LNG contracts, storage optimization strategies, and shifts in European supply routes influenced regional pricing. Asia saw improved LNG inflows, while Middle Eastern supply held firm. Germany continued to face elevated costs, reflecting infrastructure constraints and higher import reliance. These dynamics shaped the Natural Gas price today across key markets.
What This Means for Investors / Consumers
For investors, the evolving landscape of Natural Gas Prices presents opportunities in LNG logistics, storage technology, and renewable-linked gas systems. Consumers and industries depend on price forecasting to plan energy budgets and procurement cycles. Monitoring the Natural Gas price index supports long-term contract structuring and risk mitigation.
Top Natural Gas Suppliers Across Regions
Factors Influencing Natural Gas Prices
The most impactful factors include LNG freight rates, production outages, refinery activity, storage reports, government regulations, and the pace of renewable energy integration. Industrial consumption trends in petrochemicals and fertilizers also shape Natural Gas Prices across global hubs.
Regional Price Trends Variations
North America maintained moderate pricing due to abundant shale output. China and Saudi Arabia saw competitive price levels supported by secure supply chains. Germany faced elevated costs tied to LNG import dependency. India experienced price increases reflecting growing industrial energy demand.
Browse Here Fore More Other Realed Reports:
Specific Future Trends and Outlooks
Short Term
Short-term pricing may fluctuate based on winter demand, storage levels, and geopolitical developments affecting LNG routes.
Long Term
Long-term trends indicate stable growth as gas plays a bridging role in global decarbonization. Countries investing in LNG terminals and pipeline diversification may experience greater pricing stability, supporting steady Natural Gas Prices into the late 2020s.
Key Highlights of the 2025 Natural Gas Price Trend
News & Recent Development
Recent industry developments include new LNG terminal expansions, updated gas agreements in Asia, advances in renewable-gas blending technologies, and investments in hydrogen-compatible infrastructure. These updates could reshape global supply flows and influence future Natural Gas Prices.
Quarter-on-Quarter Comparison of Natural Gas Prices in 2025
Natural Gas Prices showed fluctuating patterns from Q1 to Q3, with notable increases in the USA and India. China and Saudi Arabia experienced mild variations, while Europe and Brazil previously faced significant volatility. Overall, 2025 displayed a mixed pricing landscape driven by supply shifts and seasonal demand.
About Us:
IMARC Group is a global management consulting firm that provides a comprehensive suite of services to support market entry and expansion efforts. The company offers detailed market assessments, feasibility studies, regulatory approvals and licensing support, and pricing analysis, including spot pricing and regional price trends. Its expertise spans demand-supply analysis alongside regional insights covering Asia-Pacific, Europe, North America, Latin America, and the Middle East and Africa. IMARC also specializes in competitive landscape evaluations, profiling key market players, and conducting research into market drivers, restraints, and opportunities. IMARC’s data-driven approach helps businesses navigate complex markets with precision and confidence.
Contact Us:
IMARC Group
134 N 4th St. Brooklyn, NY 11249, USA
Email: sales[@]imarcgroup.com
Tel No:(D) +91 120 433 0800
United States: +1-201971-6302
We do have the FOMC interest rate here in a couple of hours, and perhaps more importantly, we have the press conference. So, I suspect that about three hours from now, this chart will look quite a bit different. That being said, it doesn’t really matter because there are a couple of things that we can look at to determine whether or not there is going to be a continuation of the trend, or do we get some type of significant pullback. Notice how I didn’t say change in trend. And that’s because it would take a massive change in tone by the Federal Reserve to turn this thing around.
Pay attention to the press conference; he may say something along the lines of “data-dependent in our future decisions”, and that throws a bit of doubt into the market about the likelihood of continuous interest rate cuts. If that’s the case, then the US dollar should do quite well over the longer term. As a trader, I have closed my long position, and I’m waiting for an entry again. I look at this through the prism of maybe 154 yen being an excellent opportunity. But if we take off straight away and that would be a result of either Powell sounding very hesitant to cut going forward, the statement sounding very hesitant, or maybe they don’t cut at all.
Right now, the Fed watch tool at the CME suggests, I want to say it’s around 90%, I haven’t checked it in a few days, that the Federal Reserve will cut. So, I think that would catch the market so far offside that the US dollar would just slam through the 158 yen level and go to the 160 yen level very quickly. That being said, though, I do think we have an opportunity for a little bit of a pullback to take advantage of, and that’s exactly what I’m going to do. I’m watching this area right around 155, down to 154, and then again at 153.
What I am looking for on a shorter timeframe, not the daily chart necessarily, is some type of move like this. The V pattern on the hourly chart. Once we start to bounce and pick up a little bit of momentum, I’m willing to go long, and that’s because I am okay with owning this pair longer term. That being said, if we break down below 153 in the next several days, then the game’s up at least for a while. I don’t think that happens. Truthfully, I’d be a bit concerned if we broke down below 154, at least in the short term.
Longer term, I do think we’d go higher because the Bank of Japan has a whole litany of problems it has to deal with as well. And really, at this point in time, I think this ends up being a continuation of the carry trade, but I recognize that you may get an opportunity to pick up cheap US dollars.
Want to trade our USD/JPY forex analysis and predictions? Here’s a list of forex brokers in Japan to check out.
This story was written in collaboration with L.A. TACO’s Media Lab class at USC, an incubator for emerging journalists aimed at forging a new path for the future of journalism. Keep a look out for our ongoing series of stories from L.A. TACO Media Lab students.
This viral $36 matcha tin just got more expensive.
Ashley Alexander, a popular YouTube influencer and founder of the matcha brand Nami Matcha, posted a TikTok in late October announcing that Nami would have to raise prices due to the “matcha shortage.”
Her most expensive product, Yame First Harvest Matcha powder, used to cost $36. Now, it costs $42.
Alexander’s TikTok caught the matcha community’s attention, receiving 423.2K views—the most Nami Matcha’s TikToks have ever received. Her comments were flooded with negativity, the top comments reading, “Insane bc ur matcha is alr SO expensive,” and, “More than $40 that’s just insane ur matcha is already expensive enough yeah goodluck!!”
Nami Matcha is just one business affected by the matcha shortage, or the high global demand for matcha, met by its low supply, but what is fueling the matcha shortage? And why can’t suppliers keep up with the demand?
Over the past few years, matcha, a high-quality green tea finely ground into powder form, has gone viral all over the internet.
This is attributed to several factors, one being its beautiful, vibrant green aesthetic. Green matcha lattes or delicious matcha pancakes, for example, make for eye-catching Instagram posts or TikToks. Matcha recipes, reviews and drinks, in effect, gained millions of views.


The increase in tourism in Japan also increased the popularity of matcha online. As more and more people traveled to Japan to take advantage of the country’s cheap currency, more tourists tried or bought matcha and posted about it.
However, most of all, matcha gained an online presence because of its health benefits, which became prevalent following the pandemic. People were looking to become the healthiest versions of themselves, and matcha is known to be a healthy alternative to coffee.
Harvard Medical School published a study last year that lists all of matcha’s possible nutritional advantages.
They noted that catechins, antioxidants found in green tea, help lower blood pressure and cholesterol levels. Polyphenols, a plant-based chemical compound, have anti-inflammatory effects. Most notably, the amino acid L-theanine has been associated with improved concentration and alertness. Coffee, which does not contain L-theanine, may give drinkers the jitters instead.
All of these factors have fed the social media craze surrounding our favorite green drink, and as a result, demand has increased dramatically.
Miles Bothwell, a matcha educator for Den’s Tea, said, “The last year has been wildly different. In 2024, from the period of January to July, compared with 2025 January to July, the import [for matcha powder] is roughly a little more than 50% higher, which is a crazy number.”
Because of this spike in demand, suppliers in Japan are struggling to keep up.
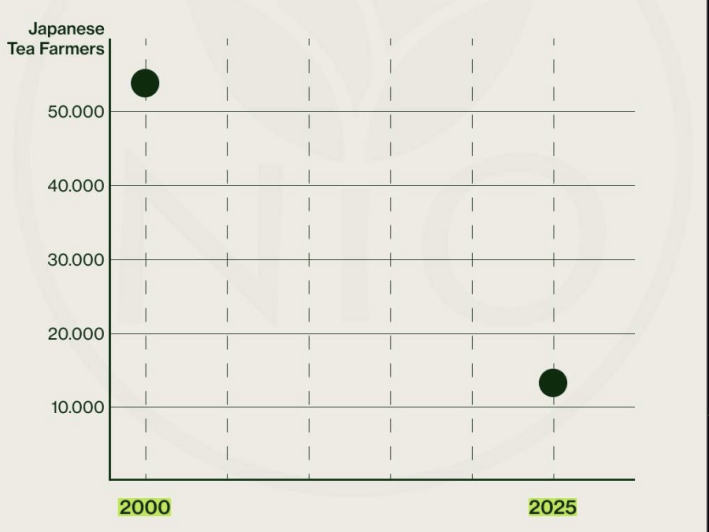
Farmers are aging, and younger populations are unwilling to take over.
According to Nio Japanese Green Tea, “In 2000, there were 53,000 tea farmers in Japan, and in the last 25 years that number has shrank 75% down to 12,353. Farmers are retiring quickly, and the younger generations aren’t willing to continue their work.”
To make matters worse, record-breaking heatwaves have led to lower-yielding harvests. Tea plants are highly sensitive to weather conditions. Extreme temperatures, irregular rainfall, and unexpected frost, worsened by climate change, can damage tea leaves or disrupt harvest times.
Even if enough tea leaves were being cultivated, there are still not enough stone mills to grind the matcha. Each mill spins slowly, producing 40 grams of powder—only enough for 10 to 12 matcha lattes—per hour. This is to ensure that the matcha is not damaged by friction-generated heat. Manufacturers would need many stone mills to produce enough matcha to meet current demand.
However, stone mills take time to construct as they are carved in a specific way to ensure the matcha is ground finely. There are only a few certified masters who create traditional Japanese stone mills, limiting matcha production.
The combination of all of these factors is preventing matcha suppliers from meeting the demand. As a result, matcha tins, like Nami’s, are costing people around $40 to $50 to get their hands on the limited supply.
As shown by Alexander’s TikTok comments, consumers are frustrated, to say the least. They are all of a sudden paying a higher cost for the same product. Several matcha powder retailers have had to increase their prices to stay afloat.
However, the effects of the matcha shortage are not necessarily all bad. Ryan Ahn, founder and CEO of Sanko Matcha Products and the co-host of the Specialty Matcha Podcast, acknowledges that there are pros.
“I actually think it’s a good thing for the industry because it’s putting everyone in an exploratory state, where you can search for little pockets of value where you might have never thought to buy matcha from this region, or processed in this way, or from this particular cultivar,” he says.
In order to remedy the matcha shortage and thereby drive down prices, experts are actually encouraging consumers to do just as Ahn said, explore other options.
Matcha is traditionally grown in Japan, but China and Korea are also major producers of matcha tea leaves. Jules Reyes, a cafe matcha educator who led marketing for Jade Leaf, the #1 Matcha Seller in the U.S., is attempting to educate people on alternatives and destigmatize matcha grown in other countries.
“What people don’t know is that, for example, in Chinese facilities that produce matcha, they are consulting with Japanese tea farmers,” she says. “They are helping them. Tea fields in Korea, planted by Japanese tea farmers.”
“I think that there’s an opportunity for matcha consumers to broaden our scope and try to appreciate the matcha for what it is. If we want to see the industry thrive, we have to open our minds.”
Bitcoin’s price recently dipped to $90,364, marking a 2.53% decrease from the previous day. This decline has generated interest in what the future holds for BTCUSD, especially with technical indicators now signaling potential trend shifts.
As of Friday, Bitcoin is trading at $90,364, following a notable -2.53% decline. The day’s range saw lows of $89,646 and highs of $92,038, reminding traders of the asset’s volatility. Presently, Bitcoin’s market cap stands at an imposing $1.82 trillion.
The RSI currently sits at 46.90, indicating that Bitcoin is neither overbought nor oversold. Meanwhile, the MACD shows a -3283.40 with a histogram of 981.27, hinting at possible bullish divergence despite recent price movements. The Bollinger Bands have the upper and lower bands at $99,365 and $83,478 respectively, suggesting current consolidation within this range.
Forecasting models predict a monthly target of $94,394, with a more aggressive quarterly forecast at $136,190. Interestingly, the yearly prediction slightly drops to $89,387, indicating potential short-term challenges. Higher long-term targets of $146,652 in five years are also on the horizon. Meyka AI, known for its data-driven insights, suggests monitoring macroeconomic conditions and regulatory changes, which could influence these forecasts.
Recent news highlighted green inflows into BTCUSD, with Ethereum breaking its downtrend following a 12% rally. This movement might provide a psychological boost to Bitcoin traders, though its immediate price effect appears limited. Analysts suggest more stable conditions could emerge if Bitcoin absorbs these market shifts.
Bitcoin remains a dynamic asset, fluctuating between $89,646 and $92,038 recently. With critical indicators like RSI and MACD hinting at potential reversals and long-term forecasts remaining positive, traders should be watchful of both technical signals and market news. Remember, forecasts can change due to macroeconomic shifts, regulations, or unexpected events affecting the crypto market.
The RSI is at 46.90, indicating Bitcoin is neither overbought nor oversold, hinting at a potential trend reversal soon if momentum increases.
Read more on our BTCUSD page.
The Bollinger Bands show upper and lower limits at $99,365 and $83,478. Bitcoin’s price within this range suggests stabilization before the next significant move.
Long-term forecasts project Bitcoin could reach $146,652 in five years, based on current data trends and market conditions provided by Meyka AI insights.
Recent news of green inflows and Ethereum’s break from its downtrend creates potential positive sentiment, potentially stabilizing Bitcoin in the short term.
Bitcoin’s recent dip to $90,364 is attributed to ongoing market volatility, with a 2.53% decrease highlighting possible investor caution amidst broader market conditions.
Disclaimer:
Cryptocurrency markets are highly volatile. This content is for informational purposes only.
The Forecast Prediction Model is provided for informational purposes only and should not be considered financial advice.
Meyka AI PTY LTD provides market data and sentiment analysis, not financial advice.
Always do your own research and consider consulting a licensed financial advisor before making investment decisions.

:max_bytes(150000):strip_icc()/Health-GettyImages-1281404261-9bef481bd59e452fb751be01905b5555.jpg "6 Foods You Should Eat Instead of Taking a Vitamin D Supplement")

")


")
