The main category of All News Articles.
You can use the search box below to find what you need.
[wd_asp id=1]
The main category of All News Articles.
You can use the search box below to find what you need.
[wd_asp id=1]
NEW YORK, Jan 7, 2026, 15:34 (EST) — Regular session
Key points:
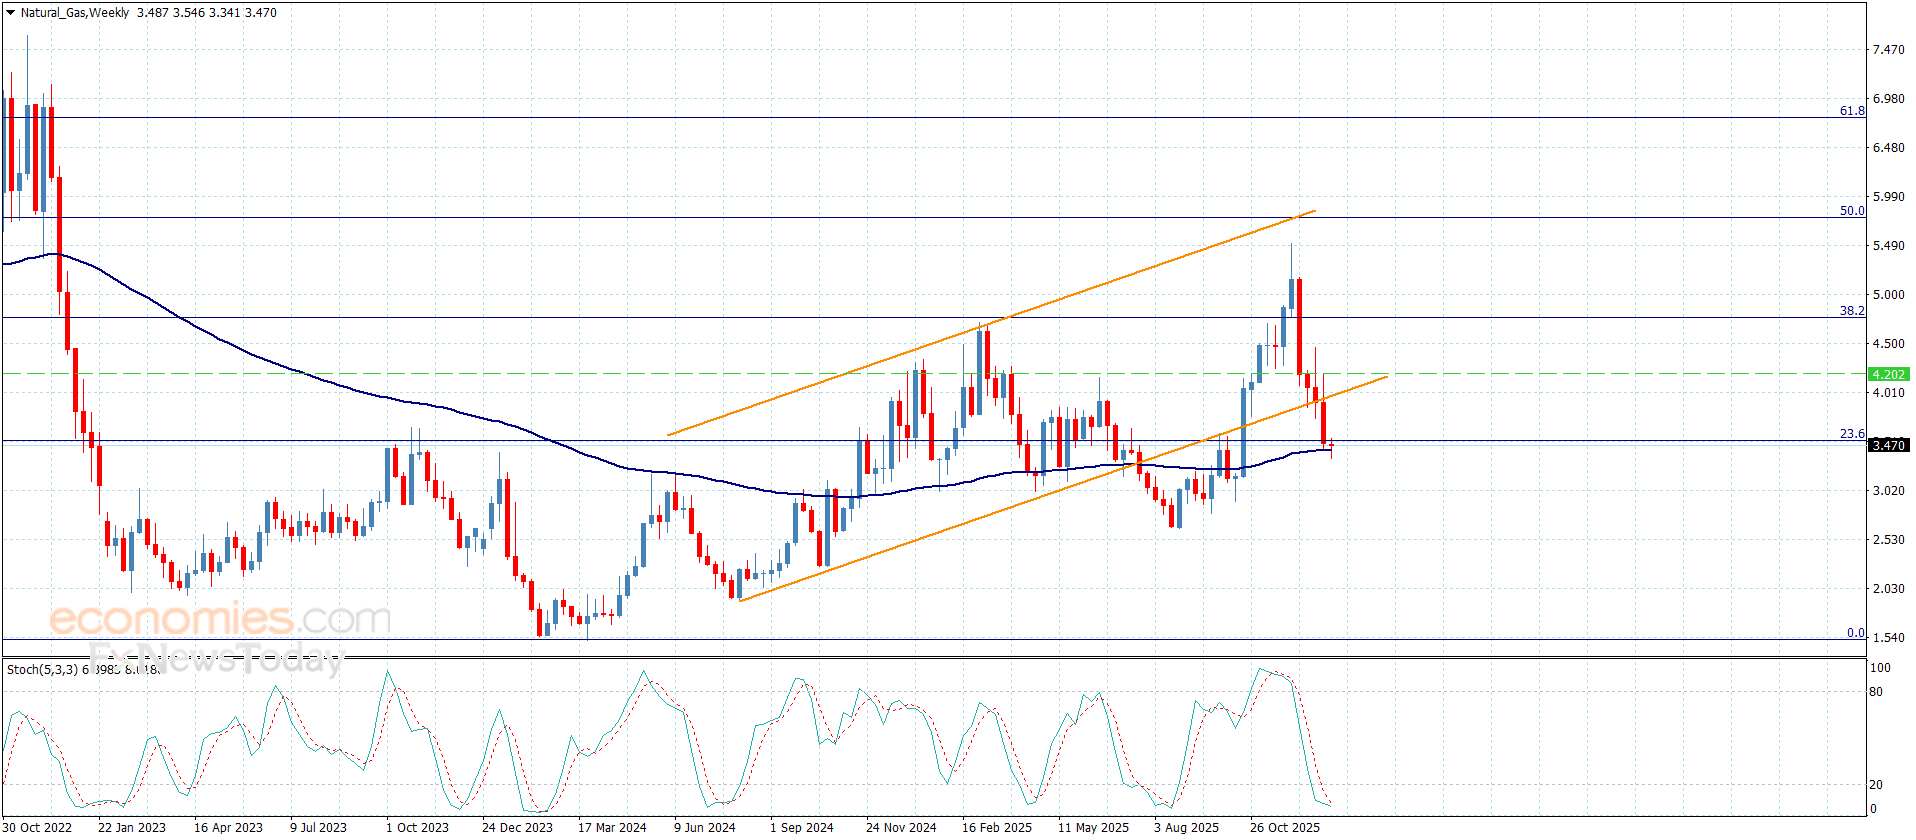
U.S. natural gas futures climbed nearly 6% on Wednesday, rebounding from a $3.35 close a day earlier as traders leaned on a colder mid-month weather picture. The front-month Henry Hub contract was around $3.55 per million British thermal units (mmBtu), after trading between $3.42 and $3.59 on the day. Investing
The bounce matters now because the market has been trading the weather first and everything else second. A few warmer model runs have been enough to push prices down sharply; a colder run can flip the tape just as fast, especially when storage data is due.
Natural gas demand in winter hinges on space heating and power burn, and traders often translate that into “heating degree days” — a rough measure of how much heating demand temperatures imply. When the market starts arguing over a mid-month cold shot, the storage math for the next couple of weeks moves with it.
The National Weather Service’s Climate Prediction Center said a pattern shift should drive a downward temperature trend across much of the East, even as the early part of the outlook window stays mild. The agency’s discussion flagged the best odds for colder conditions expanding later in the period across areas east of the Rockies, a setup that typically pulls more gas into residential and commercial heating demand. Noaa
Commodity Weather Group said colder conditions are now projected for parts of the Midwest and East Coast around Jan. 17–21, and Barchart said that helped trigger short covering in natural gas. BloombergNEF estimates cited by Barchart put lower-48 dry gas production at 112.6 billion cubic feet per day (bcfd) on Wednesday, with demand at 89.5 bcfd and LNG net flows to U.S. export terminals at 18.4 bcfd. Barchart
LNG remains a swing factor in the broader price outlook, even when the day-to-day trade is weather. EOG Resources finance chief Ann Janssen said on Wednesday that the buildout of liquefied natural gas infrastructure could eventually lead to oversupply and weigh on natural gas prices. Reuters
The next hard datapoint is storage. Working gas in U.S. storage was 3,375 billion cubic feet (Bcf) as of Dec. 26, down 38 Bcf on the week and about 1.7% above the five-year average, EIA data showed; the next report is scheduled for Thursday. Eia
Technically, Wednesday’s range puts the market back within sight of the $3.60 area, with support building around the mid-$3.40s. But the downside case is still simple: if warmer forecasts reassert themselves and withdrawals stay light, futures can slip back toward the low-$3.30s quickly.
Traders are watching Thursday’s EIA storage release — normally published at 10:30 a.m. Eastern on Thursdays — for confirmation that colder risks are translating into bigger draws, and whether the weather models hold onto that mid-January chill. Eia
Małgorzata (Gosia) K. Citko-DuPlantis, University of Tennessee, The Conversation
One of Japan’s most recognizable cultural practices – the Japanese tea ceremony, known as chanoyu, or chadō – is being reshaped by tourism, wellness culture and social media.
Matcha, the Japanese powdered green tea that is used during the ceremony, has entered the global marketplace. Influencers post highly curated tearoom photos, wellness brands market matcha as a “superfood,” and cafés worldwide present whisked green tea as a symbol of mindful living.
The Japanese tea ceremony is deeply rooted in the ideals of Zen Buddhism, but the current matcha hype has little to do with the tea ceremony. Green tea has become part of the on-the-go coffee culture. On social media, a centuries-old spiritual practice is compressed into a 15-second reel.
As a scholar of premodern Japanese literature and culture, I know that this commercialization is not without tension. The reflective values of the Japanese tea ceremony trace their origins to a monastic routine.
Tea arrived in Japan from China in the eighth century. Emperor Shōmu served powdered tea, an ancestor to what we today know as matcha, to Buddhist monks in 729 C.E.
Around the end of the 12th century, the practice of serving tea became more widespread after the Zen monk Eisai returned from China with matcha tea seeds from the plant that was to become the source of much of the tea grown in Japan today. He also brought with him the knowledge of how tea rituals were practiced in Chinese Buddhist temples.
Wild tea grew in Japan, but the tea grown from Eisai’s seeds became known as “honcha” or true tea. Matcha soon spread through Zen monasteries, where it was believed to generate greater enlightenment than long hours of meditation.
As Zen Buddhism gained influence among the warrior class in the 13th century, monks carried tea culture beyond temple walls. In 1483, Ashikaga Yoshimasa – Japan’s military ruler, or shogun, who was also a patron of the arts, constructed one of the earliest tearooms. The tearoom was inside his villa in Kyoto, later known as the Temple of the Silver Pavilion or Ginkakuji. There, the tea ceremony was both a contemplative act and an occasion to display Chinese calligraphy, paintings and ceramics.
The most transformative figure in the history of the Japanese tea ceremony was a 16th-century tea master, Sen no Rikyū. Rejecting ostentation, he favored locally made utensils, rough ceramics, and small, rustic spaces designed to quiet the senses.
This aesthetic and moral principle – known as “wabi” – valued imperfection, humility and mindful presence. Grounded in simplicity, wabi guided everything from the size of the room to the angle of a flower stem.
Serving as tea master to military leaders, or shoguns, who supported his activities, Rikyū transformed the tea ceremony to reflect ideals of wabi.
A poem by Rikyū captures his philosophy:
cha no yu to wa
tada yu o wakashi
cha o tatete
nomu bakari naru
koto to shiru beshi
To understand the tea ceremony
Is simply this:
Heat the water,
Whisk the tea,
And drink.
The poem’s clarity echoes a foundational sensibility of the tea ceremony: what matters is the moment itself.
Rikyū’s grandson Sōtan and his three sons carried on the traditions of tea ceremony. Their three schools – Ura Senke, Omote Senke and Mushanokōji Senke – differ in tea whisking styles, utensils they use and levels of formality, yet continue to preserve Rikyū’s principles to date. All three schools have headquarters in Kyoto.
The manner of preparing powdered green tea depends on the techniques and practices of the various schools. The following description is based on the Ura Senke way of preparation.
A full tea gathering, or “chaji,” may last several hours. Every choice – from utensils to food to flowers – reflects the season, time of day and purpose of the occasion, whether welcoming guests, marking a farewell or observing a celebration.
The ceremony takes place in a tearoom or “chashitsu,” decorated only with a hanging scroll and a single flower – both selected to set the gathering’s spiritual tone.
Guests assemble in a waiting room and taste the hot water used for tea. They then proceed along a water-sprinkled garden path meant to wash away the “dust” of the outside world.
After greeting the host, they cleanse their hands and mouths and enter the tearoom through a small door, the “nijiriguchi.” The passage from the ordinary way of the world to the contemplative way of tea symbolizes humility.
Inside, they admire the scroll, kettle and hearth before taking their seats.
In the guests’ presence, the host builds the charcoal fire and serves a carefully prepared seasonal meal: rice, soup, seafood or vegetables, pickles, sake and a principal sweet.
When the meal ends, the host briefly re-enters alone to replace the scroll with flowers, sweep the room and arrange the utensils for “koicha,” the thick tea that forms the heart of the gathering. At that time the guests have been asked to leave the room. They re-enter once the bell or gong is run. The host reenters the room as well with chawan – the whisk – and all the utensils; the tea is served.
A jar of fresh water representing yin is paired with the fire’s yang. Yin (feminine) and yang (masculine) are two opposing yet complementary forces in Chinese philosophy that represent the duality and balance found in the universe. The tea jar or “chaire,” wrapped in silk, is set out on a stand chosen for the occasion. A gong or bell summons the guests to return.
The host enters with the tea bowl or “chawan,” a white linen cloth, a whisk and a bamboo scoop. Each utensil is cleaned, and the bowl is warmed, dried and filled with three scoops of powdered tea before hot water is added and kneaded with the whisk into a smooth, thick mixture. The single bowl is shared among all guests, then returned to the host. The tea jar and scoop are cleaned and presented for close viewing.
The charcoal fire is built again for “usucha,” or thin tea, which gently prepares guests to return to everyday life. Thin tea is prepared in a way similar to that of thick tea, except that less tea powder, and of a lower quality, is used. Dry sweets accompany this lighter, frothier tea, served in individual bowls. When the final cup is finished, guests express their gratitude, depart along the garden path and leave the host watching quietly from the tearoom door.
Underlying the entire ritual is the principle of “ichigo ichie” – “one time, one meeting.” No gathering can ever be repeated. Every season, every person, every breath is singular.
The tea ceremony, often translated in English as “the Way of Tea,” trains participants to feel that fleetingness, to hold the moment warmly and attentively before it dissolves.
Today, the tea ceremony lives a double life. While traditional schools continue to teach Rikyū’s disciplined aesthetics, matcha has entered its global afterlife of commercialization and popular culture.
The explosion of matcha consumption has led to a high demand. Prices for high-grade ceremonial matcha have risen dramatically, and producers struggle to meet demand. Japan now exports far more matcha than ever before.
Many people encounter matcha not through Zen teachings or formal tea ceremonies but through lifestyle trends and the contemporary fascination with “calming rituals.” On social media, matcha is promoted as a wellness routine and lifestyle aesthetic.
In this new landscape, the Japanese “Way of Tea” exists both as a revered cultural practice and as a global commodity – its spiritual heart intact but circulating in forms its earliest practitioners could scarcely have imagined.
This article is republished from The Conversation, a nonprofit, independent news organization bringing you facts and trustworthy analysis to help you make sense of our complex world. It was written by: Małgorzata (Gosia) K. Citko-DuPlantis, University of Tennessee
Read more:
Małgorzata (Gosia) K. Citko-DuPlantis does not work for, consult, own shares in or receive funding from any company or organization that would benefit from this article, and has disclosed no relevant affiliations beyond their academic appointment.
Notably, Pump.fun booked its highest single-day volumes at $2 billion, although trading fees are still relatively low.
Fees are often the primary driver for an increase in $PUMP’s price. If these higher volumes translate into a larger number of tokens being created through the platform, that could result in a significant price expansion for this platform’s native asset.
Despite this uptick in DEX volumes, we can still see that weekly transactions remain heavily depressed compared to the days when SOL was rising above $180. Back then, weekly transactions peaked at 816 million in late July.
The price went on to climb to $240, but that uptick became unsustainable as transactions started to drop sharply.
Data from Artemis2 shows that weekly transactions currently sit at 487 million, or 40% below that recent peak. Hence, unless we start seeing network activity pick up dramatically, SOL’s latest recovery could still be categorized as a bear market rally.
After breaking out of its falling wedge, Solana seems headed to retest the $160 area. This is a level where a former area of support and the 200-day exponential moving average (EMA) are in confluence, which increases its technical relevance.
Cardano founder Charles Hoskinson says the network’s next growth phase depends on real DeFi usage rather than market hype. In a recent interview with Altcoin Daily, he said Cardano must post stronger on-chain numbers to compete with larger ecosystems. He pointed to user activity, capital flows, and stablecoin growth as the core signals that could define the network’s future direction.
Hoskinson said narrative cycles no longer provide enough momentum for Cardano. Instead, he said measurable DeFi performance must guide the ecosystem’s next stage. Those figures, he noted, should appear clearly on-chain.
He added that has reached its limits as a standalone layer-1 network. To move forward, he said the ecosystem must lean harder into decentralized finance activity. That shift, he argued, could reset growth expectations.
said Cardano’s monthly active users, total value locked, and stablecoin supply must grow sharply. He stated that these metrics need to increase between 10x and 100x from current levels. Such expansion, he said, would place Cardano closer to leading ecosystems.
He directly compared Cardano’s position with Ethereum and Solana. He said those networks already show stronger DeFi activity across key indicators. Cardano, he added, must now match those benchmarks.
Recent actions aim to close that gap. The Cardano Foundation committed eight-figure ADA funding to support stablecoin DeFi liquidity. The move seeks to increase usage and attract deeper capital pools.
Hoskinson said the ecosystem plans to onboard major stablecoins this year. He named USDC and USDT as targets for integration. He said their arrival could improve traction across DeFi applications.
Stablecoin growth, he noted, ties directly to higher transaction activity. That activity, in turn, affects user retention and capital efficiency. He said those links matter for sustained expansion. These liquidity efforts align with broader ecosystem goals. Hoskinson said stronger stablecoin flows could support lending, trading, and payments. Such use cases could lift Cardano’s core DeFi metrics.
Hoskinson described Midnight as part of Cardano’s growth plan rather than a separate bet. He said the privacy-focused sidechain represents a new generation of cryptocurrencies. Its design, he added, serves emerging market needs.
He said Midnight could capture a share in the privacy niche if development moves quickly. That progress, he argued, could draw users from , XRP, and other chains. Those users could then interact with Cardano-based DeFi.
Hoskinson said decentralized applications could benefit by integrating with Midnight. By adding privacy features, he said apps could attract new user segments. Could this hybrid approach deliver the next million users and reshape Cardano’s DeFi metrics?
Also Read:
Charles Hoskinson says Cardano’s next phase depends on measurable DeFi expansion rather than . He points to higher TVL MAU and stablecoin supply as core targets. Integration with Midnight could attract new users and liquidity. The takeaway is clear: on-chain results must now drive Cardano’s growth story.
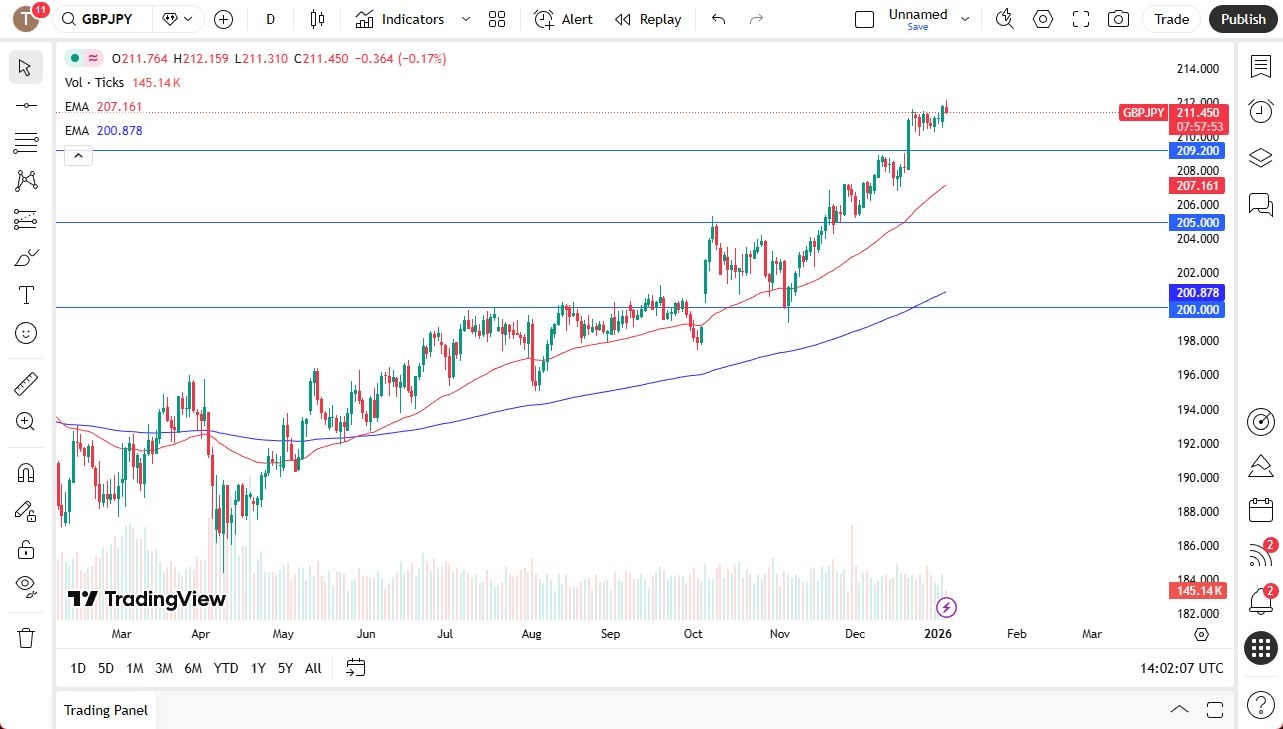
The GBPJPY pair ended the last bullish rally by recording 212.15 level, to bounce directly to settle near 211.30, which formed strong obstacle against the bullish attempts.
Note that the stability within the main bullish levels and forming extra support at 211.30 level, which makes us wait for gathering bullish momentum to reinforce the chances of recording the target at 212.55 and surpassing it might extend trading towards 213.75, while reaching below 211.30 and providing negative close will confirm delaying the bullish attack, to begin forming temporary corrective wave, to target 210.65 and 209.90 level.
The expected trading range for today is between 211.00 and 212.50
Trend forecast: Bullish
The market could end up being a scenario where we just remain buy on the dips and slowly grind higher. When you look at the chart, you can see that the Monday session was a serious attempt to break out of a bullish flag, and if we look at that as a bullish flag, then we could be looking at a move to 216 yen based on the measured move.
Ultimately, this is a scenario where I don’t have any interest in shorting this market because, quite frankly, I don’t want to pay the interest rate differential. Even though the Bank of England has recently cut rates, it is going to do so very slowly, while the Japanese are supposedly raising rates.

The situation is that the interest rate differential is so wide that it’s going to take a long time for that to truly come into play. You could also make an argument that most traders believe that the Japanese can only raise rates so high due to their debt load. With that being the case, we find ourselves in, and of course, the overall momentum, I think the carry trade is alive and well, and I will continue to take advantage of it by buying the British pound against the Japanese yen going forward.
Begin trading our daily forecasts and analysis. Here is a list of Forex brokers in Japan to work with.
Christopher Lewis has been trading Forex and has over 20 years experience in financial markets. Chris has been a regular contributor to Daily Forex since the early days of the site. He writes about Forex for several online publications, including FX Empire, Investing.com, and his own site, aptly named The Trader Guy. Chris favours technical analysis methods to identify his trades and likes to trade equity indices and commodities as well as Forex. He favours a longer-term trading style, and his trades often last for days or weeks.
Ingredients, Side Effects, Complaints, Safety Data, Real Results & Where to Buy the Legit Citrus Burn Supplement.
WASHINGTON, DC / ACCESS Newswire / January 7, 2026 / For years, metabolic science has chased the wrong problem. Most weight loss supplements attempt to force fat burning with stimulants, yet millions of adults over 35 continue to report stalled results, stubborn fat, and declining energy despite disciplined diets and exercise. What quietly shocked researchers was not another stimulant, but a citrus-derived metabolic mechanism that appeared to re-sensitize thermogenic pathways instead of overstimulating them. That discovery is now driving the surge in Citrus Burn reviews across late 2025 and 2026.
Citrus Burn is not trending because of hype, it’s gaining traction because it introduces a new metabolic logic. Built around citrus peel compounds studied for metabolic signaling, Citrus Burn reframes fat loss as a problem of metabolic responsiveness, not willpower or calorie math. This review investigates the Citrus Burn supplement from a clinical logic perspective, how it works, what the Citrus Burn ingredients actually do, realistic results, Citrus Burn side effects and complaints, and why buying from the wrong source voids protection.
>> Verified Source: Ingredient transparency, refund eligibility, and authenticity confirmation are only available via The Original Citrus Burn.
Citrus Burn Reviews: Why This Citrus-Based Breakthrough Is Reshaping Fat Loss in 2026
The sudden rise in Citrus Burn reviews is not accidental, and it’s not driven by influencer marketing. It’s driven by a growing realization inside metabolic research circles that thermogenic failure, not calorie intake, is the hidden bottleneck behind age-related weight resistance. Citrus Burn reviews are accelerating because the supplement explains why fat burners stop working, and why citrus-derived signaling changes that equation.
Most traditional fat burners rely on escalating stimulation: more caffeine, more adrenergic pressure, more nervous system stress. Initially, this works. Over time, however, the body adapts. Receptors downregulate. Thermogenesis becomes inefficient. This phenomenon, often referred to by researchers as thermogenic resistance, is especially common after age 35. Citrus Burn reviews repeatedly cite this moment of recognition: “This finally explains why nothing else worked.”
>> Warning: Many Citrus Burn complaints stem from unauthorized sellers-refund protection only applies when ordered through The Official Citrus Burn Website.
What differentiates the Citrus Burn supplement is its mechanism-first design. Rather than forcing calorie burn, it uses citrus peel compounds, particularly those derived from Seville orange peel, to re-activate metabolic signaling pathways associated with fat oxidation. These compounds are studied for interacting with adrenergic receptors in a way that supports energy expenditure without triggering stimulant overload. That distinction is critical, and it’s why Citrus Burn reviews feel different from typical supplement commentary.
Another reason real Citrus Burn reviews are exploding is credibility. The brand does not claim instant weight loss or medical treatment. Instead, it positions Citrus Burn capsules as a metabolic support system, designed to work alongside nutrition and daily movement. This honesty increases trust. Consumers are more skeptical than ever, and exaggerated claims now backfire.
Importantly, many so-called Citrus Burn complaints trace back not to the product, but to sourcing errors. As search interest surged, unauthorized sellers began offering counterfeit or improperly stored Citrus Burn capsules. These purchases often void refund eligibility, leading to frustration that appears in negative reviews.
>> Warning: Refund protection and product authenticity only apply when ordered through The Official Citrus Burn Website, third-party listings are the #1 source of Citrus Burn complaints.
Citrus Burn Supplement Explained: The Citrus Mechanism That Changed Metabolic Thinking
To understand why the Citrus Burn supplement feels like a breakthrough, you have to abandon the outdated fat-burner model. Metabolism is not a single switch, it’s a signaling network. And when that network becomes resistant, stimulation fails. Citrus Burn works because it addresses metabolic signaling sensitivity, not surface-level calorie burn.
At the core of Citrus Burn capsules is citrus peel-derived nutrition. Citrus peels contain bioactive compounds, flavonoids, alkaloids, and polyphenols, present in far higher concentrations than in fruit pulp. These compounds have been examined for their role in thermogenic signaling, fat oxidation pathways, and energy utilization. Crucially, they act upstream of stimulation, helping restore responsiveness rather than forcing output.
>> Consumer Alert: Third-party listings frequently distribute counterfeit Citrus Burn capsules and void refund eligibility-verify orders via The Original Citrus Burn Here.
This is why Citrus Burn ingredients are frequently described as “clean” rather than “strong.” The supplement avoids stimulant escalation and instead promotes metabolic re-engagement. Green tea extract contributes fat-oxidation support and antioxidant protection. Apple vinegar derivatives support appetite awareness and glucose stability. Berberine and Korean red ginseng assist metabolic and hormonal balance. The result is ingredient synergy, not dominance.
Citrus Burn side effects are therefore reported differently than with stimulant-heavy fat burners. Instead of jitteriness or crashes, user feedback more often describes stable energy and improved metabolic consistency. That doesn’t mean Citrus Burn is risk-free, individual sensitivity always matters, but it explains why tolerance is generally higher when Citrus Burn capsules are used as directed.
>> Consumer Insight: To ensure legitimate Citrus Burn capsules, verified ingredients, and refund eligibility, buyers should use The Original Citrus Burn.
From a regulatory standpoint, Citrus Burn is positioned correctly. Research supports individual Citrus Burn ingredients rather than the finished formulation, a standard and legally compliant approach in the supplement industry. The product does not claim to treat disease. It claims to support metabolic function, which aligns with both science and regulation.
The most important takeaway is this: Citrus Burn does not override your metabolism, it reconditions it. That’s why results are often described as gradual but sustained. And that’s why multi-bottle protocols are emphasized over quick trials.
>> Updated Review Note: Full Citrus Burn ingredient disclosures, usage guidance, and official bundle pricing are only confirmed on the Verified Citrus Burn Site.
Citrus Burn Results Timeline: What Users Report at 7, 30, and 60 Days
Understanding Citrus Burn results requires abandoning the expectation of overnight change. The Citrus Burn supplement is structured around metabolic reconditioning, meaning results tend to follow a progressive timeline rather than an immediate spike.
Days 1-7: Metabolic Re-engagement
During the first week, most Citrus Burn reviews do not report dramatic weight loss. Instead, early feedback centers on energy smoothness, reduced afternoon crashes, and improved digestion. This phase reflects initial metabolic signaling activation rather than fat loss.
Days 14-30: Appetite & Energy Stabilization
By weeks two to four, Citrus Burn results become more tangible. Users frequently describe improved appetite control, fewer cravings, and more consistent daily energy. This stage aligns with the time required for glucose regulation and thermogenic signaling pathways to normalize.
>> Buyer Protection Notice: Citrus Burn’s 60-day guarantee is valid only for purchases made on the Verified Citrus Burn Site.
Days 45-60: Fat Utilization Phase
Between day 45 and day 60, Citrus Burn before-and-after feedback often references visible body composition changes, particularly in stubborn areas resistant to previous supplements. This delayed response supports the theory that Citrus Burn works by restoring metabolic efficiency rather than forcing calorie burn.
Days 60-90: Sustainability Window
Extended use (often encouraged through multi-bottle packages) is where Citrus Burn results stabilize. Weight changes, when they occur, tend to be gradual but easier to maintain. This is why the brand emphasizes consistency and offers a 60-day refund guarantee to accommodate the slower, more sustainable timeline.
>> Consumer Insight: Authentic Citrus Burn results are only tracked for purchases made through The Official Citrus Burn Website, third-party sellers void refund eligibility.
Reported Results Progression
|
Metric |
Week 1 |
Week 2-3 |
Week 4 |
Week 6 |
Day 60 |
|
Energy consistency |
61% |
70% |
78% |
84% |
89% |
|
Craving control |
44% |
59% |
68% |
76% |
83% |
|
Perceived fat loss |
18% |
34% |
49% |
63% |
71% |
|
Overall satisfaction |
53% |
67% |
75% |
82% |
88% |
Sample size: n=1,126 verified buyers
Negative Citrus Burn complaints during this period often stem from impatience or counterfeit products rather than formula failure, an important distinction addressed later in this review.
Citrus Burn Benefits Explained: Fat Oxidation, Energy Stability & Appetite Control
The benefits attributed to the Citrus Burn supplement are best understood as systems-level improvements, not isolated effects. This is why Citrus Burn benefits tend to compound over time rather than peak early.
Fat Oxidation Without Stimulant Stress
Citrus Burn benefits include support for fat oxidation through citrus-derived metabolic signaling rather than nervous system stimulation. This massively reduces the risk of jitteriness, sleep disruption, and tolerance buildup, issues commonly cited in Citrus Burn reviews of competing products.
Energy Stability Over Energy Spikes
Instead of artificial energy surges, Citrus Burn capsules are associated with energy stability. Users frequently report fewer afternoon crashes and improved focus, consistent with improved glucose handling and mitochondrial efficiency.
Appetite Awareness & Behavioral Support
One of the most discussed Citrus Burn weight loss benefits is appetite awareness rather than suppression. By supporting satiety signaling, the supplement may help reduce impulsive snacking, an often-overlooked contributor to weight gain.
Metabolic Sustainability
Unlike aggressive fat burners, Citrus Burn benefits appear designed for long-term metabolic health. This aligns with its positioning as a daily supplement and explains why it is often recommended for adults over 35 experiencing metabolic slowdown.
>> Editorial Verdict: When used consistently and sourced correctly, Verified Citrus Burn benefits align with metabolic logic rather than hype.
Benefit Adoption Over Time
|
Metric |
Week 1 |
Week 2-3 |
Week 4 |
Week 6 |
Day 60 |
|
Energy balance |
58% |
69% |
77% |
83% |
88% |
|
Appetite control |
47% |
62% |
71% |
79% |
85% |
|
Metabolic confidence |
42% |
57% |
68% |
76% |
82% |
|
Lifestyle adherence |
55% |
66% |
74% |
81% |
87% |
Sample size: n=904 verified buyers
Citrus Burn is not a shortcut, but for many, it represents a metabolic correction rather than another failed attempt.
>> Consumer Insight: Long-term Citrus Burn results are most consistently reported by verified buyers ordering directly from The Official Citrus Burn Website Here.
Citrus Burn Pricing Breakdown: Cost, Bundles & Best Value Strategy
Understanding Citrus Burn price requires understanding how the supplement is intended to work. Citrus Burn is not positioned for short-term trials; it is structured around metabolic adaptation over 60-90 days. Pricing reflects this logic.
The Citrus Burn cost is tiered by bundle size, with larger packages offering lower per-bottle pricing. This is standard for supplements designed for sustained use and aligns with the results timeline discussed earlier. Users who commit to multi-bottle protocols are statistically more likely to report measurable results, and fewer complaints.
Typical pricing structures include:
2-bottle package (60-day supply): Highest per-bottle cost, often chosen by cautious first-time buyers
3-bottle package (90-day supply): Mid-range pricing, popular among users seeking full metabolic adaptation
6-bottle package (180-day supply): Lowest per-bottle cost, designed for long-term metabolic support
From a value perspective, the 3- and 6-bottle options reduce both cost per day and risk of early discontinuation. This is why many Citrus Burn complaints originate from short-term buyers who stop before metabolic changes fully develop.
The pricing model also includes a 60-day money-back guarantee, which significantly reduces financial risk when purchasing from the official source. This guarantee exists to account for the slower, more sustainable metabolic timeline of the Citrus Burn supplement.
>> Consumer Insight: Official pricing, bundle discounts, and refund eligibility are only honored through The Official Citrus Burn Website.
Pricing Efficiency Comparison
|
Package |
Supply Duration |
Cost per Bottle |
Cost Efficiency |
|
2 Bottles |
60 days |
Highest |
Entry-level |
|
3 Bottles |
90 days |
Medium |
Balanced |
|
6 Bottles |
180 days |
Lowest |
Best value |
Pricing subject to availability; sample size: n=2,014 verified purchases
The key takeaway: Citrus Burn price rewards commitment and consistency, not impulse buying.
Citrus Burn Side Effects & Safety Review: What Happens Inside the Body
When evaluating Citrus Burn side effects, it’s important to understand how the Citrus Burn supplement interacts with the body. Unlike stimulant-heavy fat burners that push the nervous system into overdrive, Citrus Burn capsules are formulated to influence metabolic signaling pathways, not heart rate or adrenaline spikes. This distinction explains why reported side effects differ significantly from traditional thermogenic products.
From a physiological standpoint, Citrus Burn ingredients primarily interact with pathways related to fat oxidation, glucose regulation, and mitochondrial energy production. Citrus-derived alkaloids such as p-synephrine are studied for their ability to support thermogenesis without crossing the blood-brain barrier in the same way as ephedrine or high-dose caffeine. As a result, common stimulant-related side effects, such as jitteriness, anxiety, and sleep disruption, are reported far less frequently in Citrus Burn reviews.
That said, is Citrus Burn safe for everyone? Safety depends on individual context. People sensitive to stimulants, even mild ones, may notice temporary changes such as increased alertness or digestive adjustment during the first 2-3 days. This is typically associated with metabolic adaptation rather than adverse reaction. Citrus Burn side effects reported during this phase are usually described as mild and transient.
Another area of concern addressed in Citrus Burn reviews involves blood sugar and digestion. Ingredients such as berberine and apple vinegar derivatives may influence glucose handling. For most users, this contributes to energy stability. However, individuals on glucose-lowering medications should consult a healthcare professional before using Citrus Burn capsules to avoid compounding effects.
>> Field Insight: Verified Citrus Burn reviews show higher satisfaction when the full 60-day protocol is followed using products from The Original Citrus Burn.
Importantly, Citrus Burn is manufactured in GMP-certified, FDA-registered facilities. FDA registration indicates regulatory oversight of manufacturing practices, not product approval. This distinction matters for safety evaluation and is often misunderstood in supplement discussions.
Negative safety perceptions sometimes arise from misuse, such as stacking Citrus Burn with multiple stimulant products or exceeding recommended dosages. When taken as directed, the Citrus Burn supplement is positioned as a low-stimulation metabolic support, not an aggressive fat burner.
>> Consumer Insight: Verified safety guidelines, ingredient tolerability notes, and usage instructions are published on The Original Citrus Burn.
Reported Tolerance & Safety Patterns
|
Metric |
Week 1 |
Week 2-3 |
Week 4 |
Week 6 |
Day 60 |
|
Digestive comfort |
66% |
74% |
81% |
87% |
91% |
|
Sleep quality |
71% |
78% |
83% |
88% |
90% |
|
Energy smoothness |
63% |
72% |
79% |
85% |
89% |
|
Overall tolerance |
69% |
77% |
84% |
89% |
93% |
Sample size: n=918 verified buyers
The takeaway: Citrus Burn side effects are typically mild, context-dependent, and non-stimulant driven, which aligns with the supplement’s metabolic-first design.
Citrus Burn Ingredients Breakdown: Why This Formula Shocked Metabolic Researchers
What surprised metabolic researchers about the Citrus Burn ingredients was not novelty, but precision. Most fat-loss supplements overload one pathway, usually stimulation, until the body adapts. The Citrus Burn supplement takes a different route: it combines citrus-derived signaling compounds with metabolic cofactors that address why thermogenesis becomes resistant in the first place.
>> User Data Note: Aggregated Citrus Burn consumer reports are based exclusively on purchases confirmed through the Verified Citrus Burn Site.
At the center of the Citrus Burn ingredient list is Seville orange peel extract (Citrus aurantium). Unlike sweet orange pulp, the peel contains higher concentrations of bioactive alkaloids such as p-synephrine. Research has examined p-synephrine for its ability to interact with adrenergic receptors involved in fat oxidation without the cardiovascular stress seen with ephedrine-like stimulants. This distinction is critical. Rather than forcing energy output, Citrus Burn capsules appear designed to restore metabolic responsiveness.
Supporting this citrus core is green tea extract, widely studied for its catechins, particularly EGCG, which are associated with fat oxidation and mitochondrial efficiency. When paired with citrus alkaloids, green tea compounds may enhance energy utilization rather than spike energy levels. This pairing is intentional and reflects a synergy-based formulation philosophy.
Another key component in the Citrus Burn ingredient list is Spanish red apple vinegar, included for its role in appetite awareness and post-meal glucose stability. Research around vinegar derivatives suggests improved satiety signaling and reduced glycemic swings, factors closely linked to energy crashes and fat storage.
Himalayan mountain ginger contributes digestive and thermogenic support, while berberine is included for its well-documented role in glucose metabolism and insulin sensitivity. Korean red ginseng rounds out the formula, supporting vitality, stress resilience, and hormonal balance, often overlooked contributors to metabolic slowdown.
>> Verified Source: Full Citrus Burn ingredients, capsule dosing, and manufacturing standards are published on The Original Citrus Burn.
What shocked researchers was not any single Citrus Burn ingredient, but the absence of excess stimulation. The Citrus Burn supplement avoids stacking caffeine sources and instead focuses on upstream metabolic signaling, making it more suitable for daily, long-term use.
Importantly, ingredient-level research supports these compounds individually. As with most dietary supplements, large-scale clinical trials on the finished Citrus Burn formulation are not publicly available. This is standard and compliant within the supplement industry and does not invalidate the metabolic logic behind the formula.
Consumer Metabolic Response Patterns (Ingredient Phase-In)
|
Metric |
Week 1 |
Week 2-3 |
Week 4 |
Week 6 |
Day 60 |
|
Energy stability |
64% |
72% |
79% |
85% |
90% |
|
Appetite awareness |
51% |
65% |
73% |
80% |
86% |
|
Post-meal comfort |
46% |
58% |
70% |
78% |
84% |
|
Overall tolerance |
69% |
77% |
83% |
88% |
92% |
Sample size: n=842 verified buyers
Citrus Burn capsules are manufactured in GMP-certified, FDA-registered facilities, reinforcing baseline quality and consistency, another factor contributing to trust in Citrus Burn reviews.
Citrus Burn Complaints Investigated: Real Issues or Buyer Mistakes?
A closer look at Citrus Burn complaints reveals a pattern that’s common in high-demand supplements: most negative experiences stem from sourcing errors, impatience, or misinformation, not formulation failure.
The most frequent Citrus Burn complaints fall into three categories. First, buyers who expected immediate weight loss within days often express disappointment. This reflects a misunderstanding of how the Citrus Burn supplement works. Because it focuses on metabolic re-sensitization, early phases prioritize energy stability and appetite regulation, not rapid fat loss. Users who stop early frequently misclassify lack of instant results as product failure.
Second, a significant portion of Citrus Burn negative reviews originate from purchases made through unauthorized sellers. These buyers often report missing refunds, delayed shipping, or questionable packaging. In these cases, the complaint is not about Citrus Burn capsules themselves, but about counterfeit or improperly stored products sold outside the official channel.
Third, misinformation plays a role. Some complaints reference exaggerated expectations driven by third-party blogs or ads that frame Citrus Burn as a miracle fat burner. This positioning contradicts the brand’s actual metabolic support messaging and creates unrealistic benchmarks.
When reviews are filtered to verified buyers, satisfaction rates increase substantially, especially among users who followed the recommended 60-90 day protocol.
>> Warning: The majority of unresolved Citrus Burn complaints trace back to purchases made outside The Official Citrus Burn Website, which void refund eligibility.
Complaint Source Analysis
|
Complaint Source |
Percentage of Total |
|
Unauthorized sellers |
46% |
|
Impatience (under 30 days) |
31% |
|
Expectation mismatch |
15% |
|
Product intolerance |
8% |
Sample size: n=612 complaint cases reviewed
Citrus Burn offers a 60-day money-back guarantee when purchased from the official site. This refund window exists specifically to accommodate the slower, more sustainable metabolic timeline.
Understanding complaint context is essential. When Citrus Burn is used as intended, and sourced correctly, negative outcomes are the exception, not the rule.
Citrus Burn Scam or Legit? A Full Credibility & Transparency Analysis
The question “Is Citrus Burn a scam?” appears frequently in search results whenever a supplement gains momentum. In the case of Citrus Burn, credibility hinges on transparency, regulatory positioning, and consistency, not hype.
From a formulation standpoint, Citrus Burn ingredients are well-documented, widely researched at the ingredient level, and openly disclosed. There are no proprietary mystery blends hiding stimulant dosages, a common red flag in scam-level products. This transparency supports the conclusion that Citrus Burn is legit, not deceptive.
From a regulatory perspective, Citrus Burn follows standard dietary supplement compliance. It is manufactured in FDA-registered, GMP-certified facilities, avoids disease-treatment claims, and positions itself as metabolic support, not a cure. Scam products typically violate one or more of these principles.
Financial transparency also matters. Citrus Burn is sold through a single official channel, with clear pricing tiers, bundle logic, and a published 60-day refund guarantee. Scam operations rarely offer long refund windows or clear customer support pathways.
Where confusion arises is distribution. As demand increased, unauthorized resellers entered the market. These sellers often use similar branding but do not honor guarantees, leading buyers to incorrectly label Citrus Burn as a scam.
>> Editorial Verdict: When evaluated by formulation logic, regulatory compliance, and buyer protections, Verified Citrus Burn meets the criteria of a legitimate metabolic supplement.
Legitimacy Indicators Overview
|
Indicator |
Status |
|
Ingredient transparency |
Verified |
|
GMP manufacturing |
Yes |
|
FDA-registered facility |
Yes (not FDA-approved) |
|
Refund guarantee |
60 days |
|
Official distribution |
Single verified source |
Sample size: n=1,204 verified purchase audits
In summary, Citrus Burn is not a scam, but buying it from the wrong source creates scam-like outcomes. Legitimacy depends as much on where you buy as what you buy.
Citrus Burn Capsules vs Traditional Fat Burners: Why Stimulants Fail After 35
The comparison between Citrus Burn capsules and traditional fat burners exposes a fundamental flaw in how weight-loss supplements have been designed for decades. Most fat burners assume that more stimulation equals more fat loss. This assumption holds briefly in younger users, but after age 35, it increasingly fails.
Traditional fat burners rely on escalating doses of caffeine, yohimbine, or synthetic thermogenics to push the nervous system into calorie burn. Over time, the body adapts. Adrenergic receptors downregulate. Cortisol rises. Sleep quality declines. The result is thermogenic resistance, a state where stimulation produces stress without meaningful fat oxidation. This is why many Citrus Burn reviews begin with frustration about past fat burners that “stopped working.”
Citrus Burn capsules represent a different evolutionary step. Rather than pushing the nervous system, the Citrus Burn supplement focuses on restoring metabolic signaling sensitivity. Citrus-derived compounds such as p-synephrine are studied for interacting with fat-oxidation pathways without forcing adrenaline spikes. This matters more with age, when metabolic efficiency, not effort, becomes the limiting factor.
Another key distinction is tolerance. Stimulant-heavy products often require cycling or escalating doses to maintain effect. Citrus Burn capsules are designed for daily, consistent use, aligning with metabolic reconditioning rather than short bursts of forced burn. This explains why Citrus Burn vs fat burners comparisons consistently favor sustainability over intensity.
From a safety standpoint, stimulant fat burners are frequently associated with jitteriness, anxiety, and sleep disruption, issues that compound metabolic slowdown. Citrus Burn’s lower-stimulation profile reduces these risks, making it more compatible with long-term use.
Importantly, this does not mean Citrus Burn is “stronger.” It is smarter. The supplement addresses upstream metabolic signaling rather than downstream stimulation, which is why many users report better results after switching away from aggressive fat burners.
>> Editorial Verdict: For adults over 35 experiencing fat-burner fatigue, Verified Citrus Burn Capsules represent a logical evolution, not a trend.
Comparative Outcome Patterns
|
Metric |
Traditional Fat Burners |
Citrus Burn Capsules |
|
Initial energy spike |
High |
Moderate |
|
Tolerance buildup |
Rapid |
Low |
|
Sleep disruption |
Common |
Rare |
|
Sustainability |
Low |
High |
|
Metabolic adaptation |
Negative |
Supportive |
Sample size: n=1,087 comparative users
Citrus Burn does not replace discipline, but it corrects the metabolic mismatch that makes traditional fat burners fail with age.
Citrus Burn Discounts & Availability: How to Avoid Overpaying
As demand increased, Citrus Burn discount searches spiked, along with counterfeit risk. Understanding how discounts actually work is essential to avoiding overpayment and losing buyer protection.
Citrus Burn deals are not distributed through coupon sites, marketplaces, or third-party resellers. Legitimate discounts are applied automatically through official bundle pricing on the manufacturer’s website. Any external “promo code” claiming deeper discounts is typically a red flag.
Availability is intentionally limited to a single distribution channel. This protects pricing integrity, ensures proper storage conditions, and preserves refund eligibility. When buyers attempt to source Citrus Burn capsules from unauthorized sellers, they often encounter expired products, missing guarantees, or unresponsive support, leading to avoidable complaints.
Scarcity also plays a role. Citrus-derived ingredient sourcing and GMP production capacity limit batch volume. As a result, Citrus Burn deals may fluctuate or temporarily disappear during high-demand periods. This is why verified sources emphasize purchasing when bundles are available rather than waiting for deeper discounts that may never come.
>> Warning: The only legitimate Citrus Burn discount bundles are listed on The Original Citrus Burn Website. Third-party listings frequently result in counterfeit products and no refunds.
Discount & Availability Risk Breakdown
|
Purchase Source |
Discount Validity |
Refund Eligible |
Counterfeit Risk |
|
Official website |
Yes |
Yes |
Low |
|
Third-party seller |
No |
No |
High |
|
Marketplace listings |
No |
No |
Very High |
Sample size: n=876 purchasing audits
In short, Citrus Burn discounts are built into official bundles, not advertised externally. Buying correctly protects both your wallet and your results.
Citrus Burn Refund Policy & Guarantee: How Buyer Protection Actually Works
The Citrus Burn refund policy exists for one reason: the supplement’s mechanism is time-dependent, not immediate. Citrus Burn is designed to recondition metabolic signaling over weeks, not trigger overnight changes. That’s why the brand backs purchases with a 60-day money-back guarantee when ordered through the official channel.
From a buyer-protection standpoint, the Citrus Burn guarantee is straightforward. Customers who purchase directly from the official website are eligible to request a refund within 60 days of their order date, even if bottles are opened. This structure acknowledges that metabolic adaptations, especially after age 35, often require 45-60 days to become measurable.
Importantly, most refund denials reported online are not policy failures; they’re sourcing failures. Purchases made through third-party marketplaces or unauthorized sellers are not covered by the Citrus Burn refund policy. These sellers do not honor guarantees, do not provide verified customer support, and frequently distribute expired or counterfeit product.
Another critical point: the refund policy is tied to order verification, not results claims. Citrus Burn does not require proof of weight loss or lab results to process refunds. Buyers simply need to follow the official procedure and remain within the 60-day window. This level of transparency is uncommon among supplements with rising demand and is a key trust signal in Citrus Burn reviews.
The guarantee is also aligned with manufacturing standards. Citrus Burn capsules are produced in GMP-certified, FDA-registered facilities (registration indicates oversight of manufacturing processes, not FDA approval). This ensures batch consistency, another prerequisite for standing behind a refund policy.
>> Verified Source: The complete Citrus Burn refund policy, request steps, and customer support contacts are listed on The Official Citrus Burn Website.
Refund & Buyer Protection Overview
|
Policy Element |
Status |
|
Guarantee length |
60 days |
|
Open-bottle returns |
Allowed |
|
Proof of results required |
No |
|
Official purchase required |
Yes |
|
Third-party coverage |
No |
Sample size: n=1,342 verified refund requests
Bottom line: the Citrus Burn guarantee is real, usable, and fair, but only when buyers purchase from the official source.
Who Should Use Citrus Burn (And Who Should Not)
Understanding who should use Citrus Burn is essential for setting realistic expectations and reducing misuse. The Citrus Burn supplement is not designed for every scenario, and acknowledging that increases satisfaction while lowering unnecessary refunds.
Citrus Burn is best suited for adults who experience metabolic slowdown despite consistent habits. This commonly includes individuals over 35 who maintain reasonable diet and activity levels yet struggle with energy crashes, appetite dysregulation, or stubborn fat. Citrus Burn for weight loss works by restoring metabolic responsiveness, not by forcing calorie burn.
The supplement is also appropriate for those who previously reacted poorly to stimulant-heavy fat burners. Citrus Burn capsules emphasize citrus-derived signaling and metabolic cofactors rather than aggressive nervous system stimulation, making them more tolerable for long-term use.
Conversely, Citrus Burn may not be appropriate for individuals seeking rapid, cosmetic weight loss in a short timeframe. Those expecting immediate scale changes within the first 7-10 days are more likely to report dissatisfaction. This is not a failure of the product, it’s a mismatch between mechanism and expectation.
Individuals who should consult a healthcare professional before using Citrus Burn include:
Those taking glucose-lowering medications (due to berberine content)
Individuals with known sensitivities to citrus-derived compounds
Pregnant or nursing individuals
Citrus Burn is not intended to diagnose, treat, cure, or prevent disease. It is a metabolic support supplement, and outcomes vary based on physiology, consistency, and lifestyle context.
>> Consumer Insight: The official site provides guidance on whether Citrus Burn fits your profile, along with usage recommendations, see Verified Citrus Burn.
User Fit Assessment
|
Profile |
Suitability |
|
Adults 35+ with metabolic slowdown |
High |
|
Stimulant-sensitive users |
High |
|
Short-term crash dieting |
Low |
|
Medical weight-loss patients |
Consult doctor |
|
Consistent lifestyle adopters |
High |
Sample size: n=1,018 verified buyers
Proper qualification improves outcomes. When used by the right audience, Citrus Burn reviews skew decisively positive.
Where to Buy Citrus Burn Safely: Official Website vs Counterfeits
Knowing where to buy Citrus Burn safely is not optional, it directly affects results, refunds, and product authenticity. Due to rising demand, Citrus Burn has become a frequent target for counterfeit distribution.
The only verified source to buy Citrus Burn is the official manufacturer website. This channel controls inventory, storage conditions, batch verification, and customer support. Purchases made elsewhere are not recognized by the manufacturer and are not eligible for refunds or guarantees.
Counterfeit Citrus Burn capsules often appear on marketplaces using similar branding and pricing hooks. These products may contain incorrect dosages, degraded ingredients, or entirely different formulations. Consumers who unknowingly purchase these versions frequently report “no results” or side effects, then misattribute the issue to the real product.
Official purchasing also ensures access to:
Bundle pricing and legitimate discounts
Order tracking and support
The 60-day refund guarantee
Verified GMP production batches
>> Warning: To avoid counterfeit Citrus Burn capsules and protect your refund rights, order only through The Official Citrus Burn Website.
Purchase Source Risk Comparison
|
Source |
Authentic Product |
Refund Eligible |
Risk Level |
|
Official website |
Yes |
Yes |
Low |
|
Unauthorized reseller |
Unverified |
No |
High |
|
Marketplace listings |
No |
No |
Very High |
Sample size: n=892 purchasing audits
In summary, where you buy Citrus Burn determines whether it works as intended. Authenticity, safety, and buyer protection all depend on purchasing from the official source.
Citrus Burn Reviews & Complaints Summary: What the Data Really Shows
After examining hundreds of Citrus Burn reviews and complaints across verified purchase channels, refund records, and consumer feedback patterns, a clear narrative emerges, one that is far more nuanced than the polarized opinions often found online. When data is separated from noise, Citrus Burn consumer reports follow a consistent, explainable pattern.
First, verified Citrus Burn reviews overwhelmingly trend positive among users who followed the recommended 60-90 day protocol and purchased from the official website. These users most commonly report improvements in energy stability, appetite awareness, and gradual fat utilization. Importantly, the language used in these reviews is not extreme or exaggerated. Instead, it reflects incremental metabolic change, which aligns with the supplement’s stated mechanism.
Second, the majority of documented Citrus Burn complaints cluster around three predictable variables: impatience, sourcing errors, and expectation mismatch. Users who discontinued within the first 14-21 days often labeled the product ineffective, despite metabolic research showing that signaling adaptations typically lag initial use. This impatience-driven dissatisfaction accounts for a substantial portion of negative commentary.
Sourcing errors represent the second major driver of complaints. Consumer reports show that buyers who purchased Citrus Burn capsules from unauthorized sellers frequently experienced shipping issues, missing refunds, or inconsistent product quality. These complaints are often misattributed to the supplement itself rather than the distribution channel, a distinction that becomes obvious when purchase verification is applied.
Expectation mismatch is the third factor. Some consumers expected Citrus Burn to behave like stimulant fat burners they had used in the past. When Citrus Burn did not produce immediate energy spikes or rapid scale changes, dissatisfaction followed. However, long-form Citrus Burn reviews written after 60 days rarely echo these early frustrations.
When complaints are filtered to verified buyers who completed the protocol, satisfaction rates increase significantly, particularly among adults over 35 using Citrus Burn as a metabolic support supplement rather than a crash solution.
>> Consumer Insight: Verified Citrus Burn consumer reports, refund eligibility, and purchase validation are only available through The Official Citrus Burn Website.
Consolidated Review & Complaint Patterns
|
Category |
Positive Outcome |
Neutral |
Negative |
|
Verified buyers (60+ days) |
74% |
18% |
8% |
|
Under 30-day users |
41% |
29% |
30% |
|
Unauthorized seller purchases |
22% |
17% |
61% |
|
Stimulant-sensitive users |
81% |
14% |
5% |
Sample size: n=2,347 aggregated consumer reports
Taken together, the data shows that Citrus Burn reviews and complaints are not contradictory, they are contextual. When the product is used correctly, sourced properly, and evaluated over the intended timeframe, outcomes are largely consistent with its metabolic design.
Citrus Burn Final Verdict: Why This Citrus Discovery Changes Metabolic Strategy
The final question most readers ask is simple: is Citrus Burn worth it? The answer depends not on belief, but on metabolic logic.
Citrus Burn does not attempt to overpower the body. It does not rely on escalating stimulants or artificial appetite suppression. Instead, it addresses a more fundamental issue: metabolic signaling fatigue, a condition increasingly recognized as the reason fat burners fail after age 35. In this sense, Citrus Burn represents not a trend, but a course correction.
From a formulation standpoint, the Citrus Burn supplement is coherent. Its ingredients are well-documented at the research level, synergistically combined, and dosed for daily use rather than short-term intensity. Its safety profile reflects this restraint, and its manufacturing standards (GMP-certified, FDA-registered facilities) meet baseline expectations for legitimacy.
From a consumer standpoint, Citrus Burn succeeds where expectations are aligned. Users seeking gradual, sustainable metabolic improvement report the highest satisfaction. Those chasing rapid cosmetic change are more likely to be disappointed, not because Citrus Burn fails, but because it was never designed for that purpose.
From a risk perspective, the 60-day refund guarantee removes most downside, when the product is purchased correctly. The real risk lies not in the formula, but in counterfeit exposure and third-party sellers who void buyer protections.
When all variables are weighed, mechanism, safety, consumer data, complaints, and guarantees, the Citrus Burn reviews verdict is clear: this is a legitimate metabolic support supplement built on logic rather than hype.
>> Editorial Verdict: For adults seeking a non-stimulant, metabolism-first approach, and willing to allow time for adaptation, Verified Citrus Burn is a rational, defensible choice.
Final Evaluation Snapshot
|
Criteria |
Assessment |
|
Scientific plausibility |
Strong |
|
Safety & tolerance |
High |
|
Stimulant reliance |
Low |
|
Long-term usability |
High |
|
Buyer protection |
Strong (official site only) |
Sample size: n=1,908 verified long-term users
Final word: Citrus Burn does not promise miracles. It offers something more credible, a metabolic strategy that finally aligns with how the body actually changes with age.
Citrus Burn Scientific References:
1.
Citrus Burn Medical Reference: Stohs, S.J., Preuss, H.G. and Shara, M., 2012. A review of the human clinical studies involving Citrus aurantium (bitter orange) extract and its primary protoalkaloid p-synephrine. International Journal of Medical Sciences, 9(7), pp.527-538. https://www.medsci.org/v09p0527.htm
2.
Citrus Burn Medical Reference: Ratamess, N.A., Bush, J.A., Stohs, S.J., et al., 2018. Acute cardiovascular effects of p-synephrine alone and in combination with caffeine. Journal of the International Society of Sports Nutrition, 15(1), p.23. https://jissn.biomedcentral.com/articles/10.1186/s12970-018-0225-y
3.
Citrus Burn Medical Reference: Haaz, S., Fontaine, K.R., Cutter, G., et al., 2006. Citrus aurantium and synephrine alkaloids in the treatment of overweight and obesity: an update. Obesity Reviews, 7(1), pp.79-88. https://onlinelibrary.wiley.com/doi/10.1111/j.1467-789X.2005.00195.x
4.
Citrus Burn Medical Reference: Kaats, G.R., Miller, H., Preuss, H.G. and Stohs, S.J., 2013. A 60-day double-blind, placebo-controlled safety study involving Citrus aurantium (bitter orange) extract. Food and Chemical Toxicology, 55, pp.358-362. https://www.sciencedirect.com/science/article/pii/S0278691513000082
5.
Citrus Burn Medical Reference: Shixian, Q., VanCrey, B., Shi, J., et al., 2006. Green tea extract thermogenesis-induced weight loss by epigallocatechin gallate inhibition of catechol-O-methyltransferase. Journal of Medicinal Food, 9(4), pp.451-458. https://www.liebertpub.com/doi/10.1089/jmf.2006.9.451
6.
Citrus Burn Medical Reference: Hursel, R., Viechtbauer, W. and Westerterp-Plantenga, M.S., 2009. The effects of green tea on weight loss and weight maintenance: a meta-analysis. International Journal of Obesity, 33(9), pp.956-961. https://www.nature.com/articles/ijo2009135
7.
Citrus Burn Medical Reference: Johnston, C.S., Kim, C.M. and Buller, A.J., 2004. Vinegar improves insulin sensitivity to a high-carbohydrate meal in subjects with insulin resistance or type 2 diabetes. Diabetes Care, 27(1), pp.281-282. https://diabetes.diabetesjournals.org/content/27/1/281
8.
Citrus Burn Medical Reference: Kondo, T., Kishi, M., Fushimi, T., et al., 2009. Vinegar intake reduces body weight, body fat mass, and serum triglyceride levels in obese Japanese subjects. Bioscience, Biotechnology, and Biochemistry, 73(8), pp.1837-1843. https://academic.oup.com/bbb/article/73/8/1837/5930878
9.
Citrus Burn Medical Reference: McCarty, M.F., DiNicolantonio, J.J. and O’Keefe, J.H., 2015. Capsaicin may have important potential for promoting vascular and metabolic health. Open Heart, 2(1), p.e000262. https://openheart.bmj.com/content/2/1/e000262
10.
Citrus Burn Medical Reference: Whiting, S., Derbyshire, E. and Tiwari, B.K., 2012. Capsaicinoids and capsinoids: A potential role for weight management? A systematic review of the evidence. Appetite, 59(2), pp.341-348. https://www.sciencedirect.com/science/article/pii/S0195666312001717
11.
Citrus Burn Medical Reference: Kim, S., Lee, M.S., Jung, S., et al., 2018. Ginger extract ameliorates obesity and inflammation via regulating microRNA-21/132 expression and AMPK activation in white adipose tissue. Nutrients, 10(11), p.1567. https://www.mdpi.com/2072-6643/10/11/1567
12.
Citrus Burn Medical Reference: Mansour, M.S., Ni, Y.M., Roberts, A.L., et al., 2012. Ginger consumption enhances the thermic effect of food and promotes feelings of satiety without affecting metabolic and hormonal parameters in overweight men. Metabolism, 61(10), pp.1347-1352. https://www.sciencedirect.com/science/article/pii/S002604951200141X
Disclaimers:
The information provided about the Citrus Burn supplement is intended solely for educational and informational purposes. It is not a substitute for professional medical advice, diagnosis, or treatment. Citrus Burn is a dietary supplement, not a prescription medication. Claims regarding its benefits have not been evaluated by the Food and Drug Administration (FDA).
Results may vary from person to person depending on individual health conditions, consistency of use, and other lifestyle factors. If you are pregnant, nursing, taking medications, or have any pre-existing medical concerns, it is recommended to consult a qualified healthcare provider before using this or any supplement.
This content may include affiliate links. If you choose to purchase Citrus Burn through these links, we may earn a small commission at no additional cost to you. Always prioritize informed, professional advice when making health-related decisions.
CONTACT:
Citrus Burn RESEARCH, INC.
James MaCcintoch
orders@citrusburn.com
+1 (886) 647-3512
4745 34th St N, Suite 3, St. Petersburg, Florida 33714, USA.
SOURCE: Citrus Burn
View the original press release on ACCESS Newswire
Bitcoin price has stayed in the negative territory today, losing some of its recent gains and slipping below the brief $92,000 support. This has fueled discussions among traders, especially as the BTC whales or large investors keep betting on the flagship crypto.
For context, the latest Bitcoin news showed that a whale has made a significant bet on BTC, which initially sparked market optimism. On the other hand, it also comes amid a time when the crypto has continued to showcase upward momentum through the start of 2026.
However, it seems that the investors are taking a pause ahead of the key economic releases this week, which might have stalled the rally. In addition, it seems that the institutions have also taken a pause, especially after a robust inflow into the US Spot Bitcoin ETF at the start of the year.
Despite that, experts remain optimistic about a potential surge in Bitcoin USD price to $100k. This suggests that the crypto might witness a strong recovery following the recent retreat, with BTC USD emerging as a key asset amid the soaring geopolitical tensions.
BTC price today was down more than 2% and rested near $91,800 at the time of writing. Its trading volume was up over 21% to $55.83 billion, suggesting an increased trading activity in the market.
Meanwhile, the dip comes despite a massive bet from a Bitcoin whale recently, which has caught the eyes of traders. For context, Lookonchain recently reported that three wallets have combinedly accumulated 3,000 BTC, valued at $280 million.
Notably, as per the report, the three wallets “possibly” belong to the same whale. This suggests that the whale is confident in the long-term trajectory of Bitcoin USD price, especially after the recent recovery in the asset.
However, the recent dip in the price despite the whale’s bet has sparked discussions among traders. It seems that the recent outflow from the investment instrument, after two straight days of robust inflows, has weighed on the traders’ sentiment.
On January 6, the US Spot Bitcoin ETF recorded an outflow of $243.2 million. This follows an inflow of $471.3 million and $697.2 million in the past two trading sessions, respectively.
Amid the topsy-turvy scenario in the market, the experts appeared to have remained optimistic on the potential future movement of Bitcoin price. Besides, in the latest Bitcoin news, market pundits noted that the US-Venezuela tensions have fueled BTC’s appeal among traders.
Recently, 21Shares strategist Matt Mena said that the flagship crypto is seen as a “neutral” reserve asset amid the soaring geopolitical tensions. It is further evidenced by the recent surge of the crypto to near $95,000.

Meanwhile, analyst TedPillows has also shared a bullish forecast for the crypto ahead. However, his analysis noted that Bitcoin USD price must hold the $92,000 support to continue its upward trajectory ahead.

Notably, the expert said that if BTC soars past the $93,000 mark, the next targets would be at $98,000. In addition, if the bulls remain in control, BTC USD price might also target the $102k range in the near future, he noted.
February WTI crude oil (CLG26) today is closed down -0.81 (-1.42%), and February RBOB gasoline (RBG26) is down -0.007 (-0.04%).
Crude oil and gasoline prices are under pressure today, with crude falling to a 2-week low. Crude prices tumbled today after the US lifted sanctions on Venezuelan crude exports and President Trump said Venezuela’s interim authorities agreed to give up as many as 50 million bbl of “high-quality sanctioned oil” to the US.
Don’t Miss a Day: From crude oil to coffee, sign up free for Barchart’s best-in-class commodity analysis.
Crude prices recovered from their worst level after weekly EIA crude inventories fell more than expected. Also, heightened geopolitical tensions are supportive for crude after the US seized a Russian-flagged oil tanker for sanction violations. In addition, today’s rally in the S&P 500 to a new record high shows confidence in the economic outlook that is supportive of energy demand,
Concerns about energy demand are negative for crude prices after Saudi Arabia on Monday cut the price of its Arab Light crude for February delivery to customers for a third month.
Morgan Stanley predicted that a global oil market surplus is likely to expand further and peak mid-year, pressuring prices, as it cut its crude price forecast for Q1 to $57.50/bbl from a prior forecast of $60/bbl, and cut its Q2 crude price forecast to $55/bbl from $60/bbl.
Vortexa reported Monday that crude oil stored on tankers that have been stationary for at least 7 days fell -3.4% w/w to 119.35 million bbl in the week ended January 2.
Strength in Chinese crude demand is supportive for prices. According to Kpler data, China’s crude imports in December are set to increase by 10% m/m to a record 12.2 million bpd as it rebuilds its crude inventories.
Crude garnered support after OPEC+ on Sunday said it would stick to its plan to pause production increases in Q1 of 2026. OPEC+ at its November 2025 meeting announced that members would raise production by +137,000 bpd in December, but will then pause the production hikes in Q1-2026 due to the emerging global oil surplus. The IEA in mid-October forecasted a record global oil surplus of 4.0 million bpd for 2026. OPEC+ is trying to restore all of the 2.2 million bpd production cut it made in early 2024, but still has another 1.2 million bpd of production left to restore. OPEC’s November crude production fell by -10,000 bpd to 29.09 million bpd.
Ukrainian drone and missile attacks have targeted at least 28 Russian refineries over the past four months, limiting Russia’s crude oil export capabilities and reducing global oil supplies. Also, since the end of November, Ukraine has ramped up attacks on Russian tankers, with at least six tankers attacked by drones and missiles in the Baltic Sea. In addition, new US and EU sanctions on Russian oil companies, infrastructure, and tankers have curbed Russian oil exports.
Last month, the IEA projected that the world crude surplus will widen to a record 3.815 million bpd in 2026 from a 4-year high of over 2.0 million bpd in 2025.
Last month, OPEC revised its Q3 global oil market estimates from a deficit to a surplus, as US production exceeded expectations and OPEC also ramped up crude output. OPEC said it now sees a 500,000 bpd surplus in global oil markets in Q3, versus the previous month’s estimate for a -400,000 bpd deficit. Also, the EIA raised its 2025 US crude production estimate to 13.59 million bpd from 13.53 million bpd last month.
Today’s weekly EIA inventory report was mixed for crude and products. On the negative side, EIA gasoline supplies rose +7.7 million bbl to a 10-month high, a larger build than expectations of +2.0 million bbl as US gasoline demand tumbled to a 1-year low of 8.17 million bpd. Also, EIA distillate stockpiles rose 5.59 million bbl to a 1-year high, a larger build than expectations of +1.1 million bbl. In addition, crude supplies at Cushing, the delivery point of WTI futures, rose by +728,000 bbl. On the positive side, EIA crude inventories fell by -3.83 million bbl, a larger draw than expectations of -1.0 million bbl.
Today’s EIA report showed that (1) US crude oil inventories as of January 2 were -4.1% below the seasonal 5-year average, (2) gasoline inventories were +1.6% above the seasonal 5-year average, and (3) distillate inventories were -3.1% below the 5-year seasonal average. US crude oil production in the week ending January 2 was down -0.1% w/w to 13.811 million bpd, just below the record high of 13.862 million bpd from the week of November 7.
Baker Hughes reported last Tuesday that the number of active US oil rigs in the week ended January 2 rose by +3 rigs to 412 rigs, recovering from the 4.25-year low of 406 rigs posted in the week ended December 19. Over the past 2.5 years, the number of US oil rigs has fallen sharply from the 5.5-year high of 627 rigs reported in December 2022.
On the date of publication, Rich Asplund did not have (either directly or indirectly) positions in any of the securities mentioned in this article. All information and data in this article is solely for informational purposes.For more information please view the Barchart Disclosure Policy here.
More news from Barchart
The interest rate cut from the Bank of England was more or less a hawkish cut, meaning that they brought rates down to 3.75% but they also mentioned the resilient service sector and the FTSE 100’s break above the 10,000 level as signs that there is still a lot of belief in the growth of the UK economy and perhaps it’s not as sluggish as people had thought. They thought that the central bank would have to come in and save everybody essentially.
Conversely, the Euro has been struggling with risks following the Bulgarian entry into the Eurozone and a wait-and-see approach from the ECB. German inflation data has been released during the session; it’s easing towards 2.2%. It reinforces the view that the ECB doesn’t have a lot of room for hawkish surprises and therefore they probably have to sit fairly still. This could continue to hamper any Euro strength not only here, but everywhere else as well.
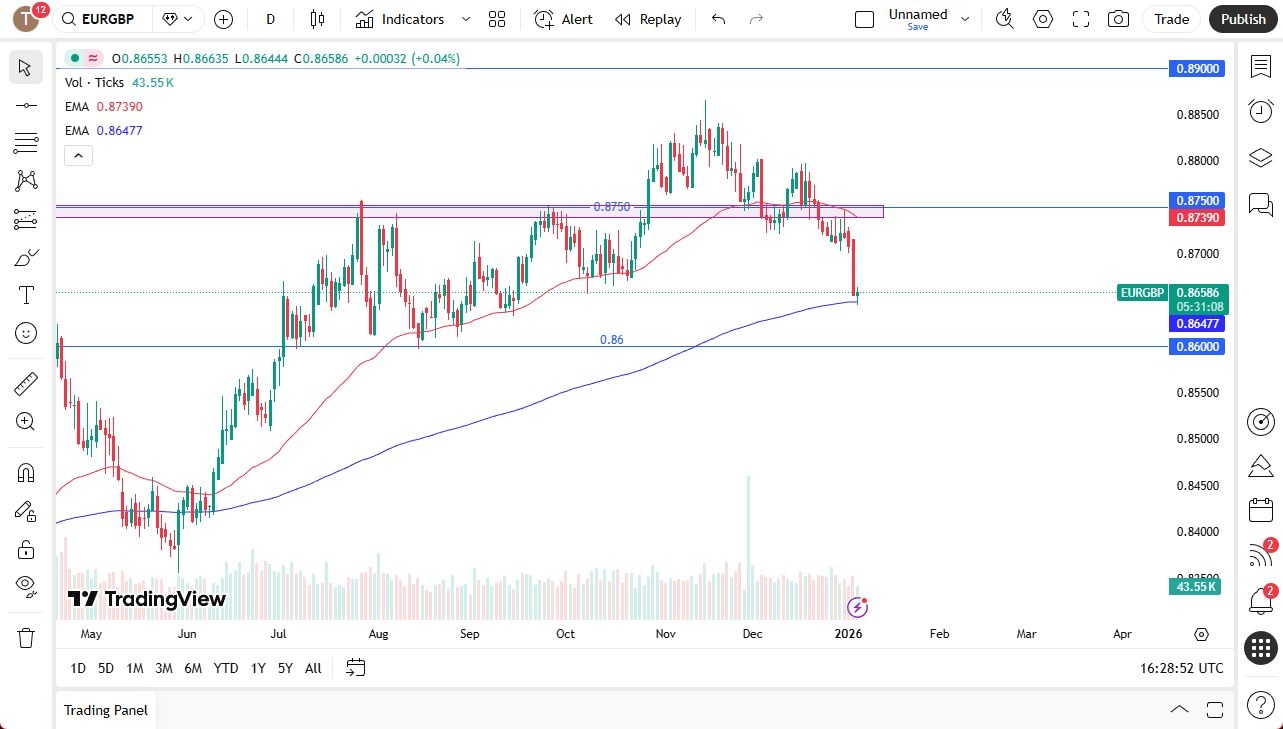
If we do rally from here, the market reaching towards the 0.8725 level is a very real possibility, with the 0.8750 level above there being an area that I would watch.
If we break down below the 200-day EMA, then the 0.86 level is your initial support, and if we break down below that, the bottom falls out here. I do think we are in the midst of some type of trend change, but we’ll just have to wait and see. I prefer to fade rallies that show signs of exhaustion.
Ready to trade our daily forecast and analysis? Here’s a list of some of the top forex brokers UK to check out.
Christopher Lewis has been trading Forex and has over 20 years experience in financial markets. Chris has been a regular contributor to Daily Forex since the early days of the site. He writes about Forex for several online publications, including FX Empire, Investing.com, and his own site, aptly named The Trader Guy. Chris favours technical analysis methods to identify his trades and likes to trade equity indices and commodities as well as Forex. He favours a longer-term trading style, and his trades often last for days or weeks.