The main category of All News Articles.
You can use the search box below to find what you need.
[wd_asp id=1]
The main category of All News Articles.
You can use the search box below to find what you need.
[wd_asp id=1]
The EUR/USD pair attracts fresh buyers near the 1.1710 area during the Asian session on Tuesday and builds on the previous day’s solid bounce from the 1.1660 area, or a nearly four-week low. Spot prices currently trade around the 1.1735 region, up 0.10% for the day, and seem poised to climb further amid a supportive fundamental backdrop.
The US Dollar (USD) drifts lower for the second straight day and moves further away from its highest level since December 10, touched on Monday, amid dovish US Federal Reserve (Fed) expectations. Furthermore, bets that the European Central Bank (ECB) is done cutting rates seem to support the shared currency and act as a tailwind for the EUR/USD pair.
An intraday strength beyond the 1.1735 confluence – comprising the 100-hour Simple Moving Average (SMA) and the 50% Fibonacci retracement level of the 1.1808-1.1660 fall – validates the positive outlook. Moreover, the Moving Average Convergence Divergence (MACD) has turned positive and edges higher, hinting at improving upside momentum.
Adding to this, the Relative Strength Index (RSI) at 59 supports further gains, with the 61.8% Fibo. retracement level, around mid-1.1700s, forming the next resistance. A push through these barriers would strengthen the corrective tone, whereas failure to clear them would leave EUR/USD vulnerable to renewed consolidation within the recent range.
(The technical analysis of this story was written with the help of an AI tool)
The Euro is the currency for the 20 European Union countries that belong to the Eurozone. It is the second most heavily traded currency in the world behind the US Dollar. In 2022, it accounted for 31% of all foreign exchange transactions, with an average daily turnover of over $2.2 trillion a day.
EUR/USD is the most heavily traded currency pair in the world, accounting for an estimated 30% off all transactions, followed by EUR/JPY (4%), EUR/GBP (3%) and EUR/AUD (2%).
The European Central Bank (ECB) in Frankfurt, Germany, is the reserve bank for the Eurozone. The ECB sets interest rates and manages monetary policy.
The ECB’s primary mandate is to maintain price stability, which means either controlling inflation or stimulating growth. Its primary tool is the raising or lowering of interest rates. Relatively high interest rates – or the expectation of higher rates – will usually benefit the Euro and vice versa.
The ECB Governing Council makes monetary policy decisions at meetings held eight times a year. Decisions are made by heads of the Eurozone national banks and six permanent members, including the President of the ECB, Christine Lagarde.
Eurozone inflation data, measured by the Harmonized Index of Consumer Prices (HICP), is an important econometric for the Euro. If inflation rises more than expected, especially if above the ECB’s 2% target, it obliges the ECB to raise interest rates to bring it back under control.
Relatively high interest rates compared to its counterparts will usually benefit the Euro, as it makes the region more attractive as a place for global investors to park their money.
Data releases gauge the health of the economy and can impact on the Euro. Indicators such as GDP, Manufacturing and Services PMIs, employment, and consumer sentiment surveys can all influence the direction of the single currency.
A strong economy is good for the Euro. Not only does it attract more foreign investment but it may encourage the ECB to put up interest rates, which will directly strengthen the Euro. Otherwise, if economic data is weak, the Euro is likely to fall.
Economic data for the four largest economies in the euro area (Germany, France, Italy and Spain) are especially significant, as they account for 75% of the Eurozone’s economy.
Another significant data release for the Euro is the Trade Balance. This indicator measures the difference between what a country earns from its exports and what it spends on imports over a given period.
If a country produces highly sought after exports then its currency will gain in value purely from the extra demand created from foreign buyers seeking to purchase these goods. Therefore, a positive net Trade Balance strengthens a currency and vice versa for a negative balance.
The timing of when you take some supplements matters. Get the most out of your supplement by taking it at the times that maximize absorption and effectiveness.
You can better maximize your iron supplement’s benefits when you take it at certain times, such as:
Understanding when and how to take vitamin B12 can help you optimize absorption and benefits:
Taking vitamin D in the morning is recommended to achieve the best results. This is because evening intake may reduce melatonin production. Melatonin and vitamin D work in opposition, so taking your vitamin D too late may impact your sleep quality.
Your body produces vitamin D when you are exposed to sunlight. Since it’s challenging to get sufficient vitamin D from food alone, consider supplementing during the winter months when sunlight is limited, especially if you have limited sun exposure.
Silver price (XAG/USD) gains nearly 4%, trading around $75.50 during the European hours on Monday. The technical analysis of the daily chart timeframe suggests the price of the precious metal remains within an ascending channel pattern, suggesting a persistent bullish bias.
The 14-day Relative Strength Index (RSI) at 66.57 remains bullish without entering overbought territory. RSI has turned higher again, reinforcing improving bullish pressure.
The nine-day Exponential Moving Average (EMA) rises well above the 50-day EMA, and the XAG/USD pair holds over both, preserving an upward bias. Both averages maintain positive slopes after a sustained advance. Momentum stays supportive while the metal consolidates above the rising nine-day EMA, keeping the path of least resistance to the upside.
The short-term average remains bullish and keeps the topside in focus, and opens a path toward resistance at the upper boundary of the ascending channel around $83.10. A break above the channel would help the Silver price to approach the record high of $85.87, which was recorded on December 29, 2025.
On the downside, the immediate support aligns at the nine-day EMA of $72.38, followed by the lower ascending channel boundary around $72.10. A daily close below the channel would open a correction toward the 50-day EMA at $60.85.
Silver is a precious metal highly traded among investors. It has been historically used as a store of value and a medium of exchange. Although less popular than Gold, traders may turn to Silver to diversify their investment portfolio, for its intrinsic value or as a potential hedge during high-inflation periods. Investors can buy physical Silver, in coins or in bars, or trade it through vehicles such as Exchange Traded Funds, which track its price on international markets.
Silver prices can move due to a wide range of factors. Geopolitical instability or fears of a deep recession can make Silver price escalate due to its safe-haven status, although to a lesser extent than Gold’s. As a yieldless asset, Silver tends to rise with lower interest rates. Its moves also depend on how the US Dollar (USD) behaves as the asset is priced in dollars (XAG/USD). A strong Dollar tends to keep the price of Silver at bay, whereas a weaker Dollar is likely to propel prices up. Other factors such as investment demand, mining supply – Silver is much more abundant than Gold – and recycling rates can also affect prices.
Silver is widely used in industry, particularly in sectors such as electronics or solar energy, as it has one of the highest electric conductivity of all metals – more than Copper and Gold. A surge in demand can increase prices, while a decline tends to lower them. Dynamics in the US, Chinese and Indian economies can also contribute to price swings: for the US and particularly China, their big industrial sectors use Silver in various processes; in India, consumers’ demand for the precious metal for jewellery also plays a key role in setting prices.
Silver prices tend to follow Gold’s moves. When Gold prices rise, Silver typically follows suit, as their status as safe-haven assets is similar. The Gold/Silver ratio, which shows the number of ounces of Silver needed to equal the value of one ounce of Gold, may help to determine the relative valuation between both metals. Some investors may consider a high ratio as an indicator that Silver is undervalued, or Gold is overvalued. On the contrary, a low ratio might suggest that Gold is undervalued relative to Silver.
(The technical analysis of this story was written with the help of an AI tool.)
Dogecoin (DOGE) has been one of the top performers in the crypto market since the beginning of the new year. The number one memecoin gained nearly 30% over the past four days, outperforming major cryptos amid a rise in the broader market sentiment.
The move is reflected in the 21Shares 2x Dogecoin ETF (TXXD), which is one of the best-performing ETFs to start 2026, according to Bloomberg ETF analyst Eric Balchunas.
The speculative interest in Dogecoin also improved slightly in the traditional crypto market, with its open interest (OI) rising to 13.47 billion DOGE on January 2 — its highest level since the October 10 leverage flush, per Coinglass data. However, that figure has slightly retreated to 12.68 billion DOGE despite a steady price rise, indicating some scepticism among traders.
Meanwhile, the rise isn’t limited to Dogecoin as the broader memecoin category has seen its market capitalization rise over 30% to $47.8 billion in the past four days.
The move follows months of underperformance, with the memecoin to altcoin dominance ratio plunging to historic lows of 0.032 in December. This means that memecoins accounted for only 3% of the general altcoins market cap. However, a massive memecoin season kicked off following the last time the metric reached such levels.
With recent gains across several memecoins, the sector could be hinting at a comeback, according to CryptoQuant contributor Darkfost.
DOGE has risen above the 50-day Exponential Moving Average (EMA) and is looking to tackle the $0.166 resistance near the 100-day EMA. A rise above could push the top memecoin to tackle the $0.181 hurdle near the 200-day EMA.
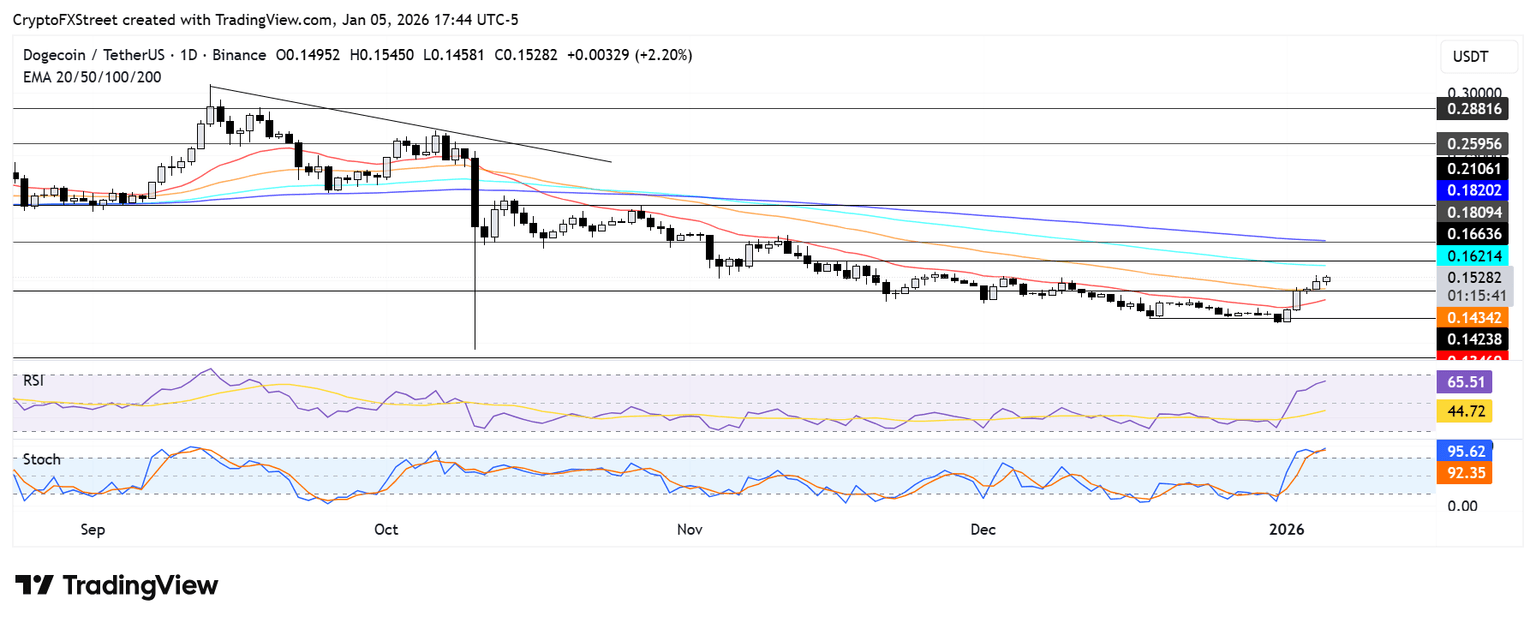
On the downside, Dogecoin could find support at $0.142. A decline below $0.142 and eventually the 20-day EMA could push its price toward $0.121.
The Relative Strength Index (RSI) is above its neutral level, while the Stochastic Oscillator (Stoch) is in its overbought region, indicating a rising bullish momentum. Sustained overbought conditions in the Stoch could spark a pullback.
Spot Gold trades around the $4,450 level on Monday, sharply up on a daily basis amid broad US Dollar (USD) weakness. The bright metal found support throughout the first half of the day on geopolitical turmoil, extending its advance afterwards on the back of poor United States (US) data.
The world found out on Saturday that US President Donald Trump ordered a strike on Venezuela, capturing President Nicolás Maduro and his wife and bringing them to the US to be judged on narco-terrorism, among other charges. The news triggered global noise and boosted demand for the safe-haven metal, as caution rules.
Early in the American session, the USD suffered a setback following the release of the December Institute for Supply Management (ISM) Manufacturing Purchasing Managers’ Index (PMI). The index came in at 47.9, below the expected 48.3, and worse than the 48.2 posted in November. The report also showed that the Employment Index improved slightly to 44.9 from 44 in November, while the Prices Paid Index, the inflation component, remained unchanged at 58.5.
The US labor market will take centre stage this week, as the country will release multiple employment-related figures. The ADP employment Change report for December and November JOLTS Job Openings will be out on Wednesday, while weekly unemployment data will be released on Thursday, and the all-mighty Nonfarm Payrolls (NFP) report will be out on Friday.
From a technical point of view, the 4-hour chart shows XAU/USD trades at $4,445.56, roughly $45.50 up for the day. The same chart shows the 20-period Simple Moving Average (SMA) has turned higher but still trails the rising 100-period SMA, both around the $4,370 level. The 200-period SMA, in the meantime, advances at $4,267 underpinning the broader structure. Also, the Momentum indicator stands above 0 and expands, signaling strengthening buying interest. Finally, the Relative Strength Index (RSI) indicator is heading north around 60, in line with the dominant bullish trend.
In the daily chart, XAU/USD bounced after testing a bullish 20-day SMA at $4,343, which also rose above the bullish 100- and 200-day SMAs, all of which reinforce the bullish bias. The Momentum indicator advances above its midline, while the RSI indicator has partially lost its upward strength at around 63, underpinning the broader uptrend.
(The technical analysis of this story was written with the help of an AI tool)
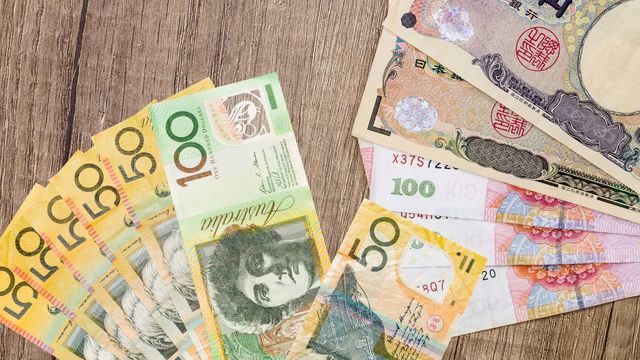
The Australian dollar spent the first part of the session on Friday rallying against the Japanese yen and even piercing the 105 yen level yet again. That being said, this is a market that continues to see a lot of noise above there, and it should be no surprise that we have, in fact, turned right back around after that move.

All things being equal, this is a market that I still believe in the upside, and it is worth noting that you get paid to hold onto it at the end of every session. We’ve been in an uptrend for a while, and despite the fact that we have flipped the calendar into 2026, I don’t think anything has truly changed.
Short-term pullbacks are buying opportunities as we wait for some type of value. Keep in mind that the Japanese yen is considered to be a safety currency, and the Australian dollar, of course, is considered to be more of a risk-on commodity type of currency.
The 104 yen level should continue to be support and with that being said, I think we have a buy on the dip scenario. The 50-day EMA is all the way down at the 102.26 yen level and rising, so I think that is also dynamic support.
To the upside, if we can finally clear the 105 yen level, it’s likely that we go much higher, perhaps looking to the 107 yen level based on a measured move of the recent consolidation. Keep in mind that the Bank of Japan did recently raise rates, but they can only tighten monetary policy so much as the debt level in Japan is dire, to say the least. With that being the case, I look at this as a market that should continue to pay you over time if you hold it to the long side. I’ve got no interest in getting short, unless of course we get some type of external factor.
Ready to trade our Forex daily analysis and predictions? Check out the largest forex brokers in Australia worth using
Christopher Lewis has been trading Forex and has over 20 years experience in financial markets. Chris has been a regular contributor to Daily Forex since the early days of the site. He writes about Forex for several online publications, including FX Empire, Investing.com, and his own site, aptly named The Trader Guy. Chris favours technical analysis methods to identify his trades and likes to trade equity indices and commodities as well as Forex. He favours a longer-term trading style, and his trades often last for days or weeks.
When I arrived in China to teach law, I didn”t expect to come home with so much tea. Nor did I expect what the tea would come to mean.
In my first week at China University of Political Science and Law in Beijing, my teaching assistant handed me a small package. It was tea from her home province of Yunnan. Later, a student gave me tea her parents had just mailed from Zhejiang province. And on my final day at East China University of Political Science and Law in Shanghai, a student brought me tea from Henan province, specially sourced by her grandfather’s friend and sent overnight by her father so she could present it before I returned to the United States. These weren’t performative gestures. Classes were over. Grades had been turned in. These were gifts from the heart — students offering pieces of their heritage, linking their present to their past.
In a country where so many students live and study far from home, tea becomes more than a beverage. It becomes a bridge. A thread to childhood and family and place. A portable form of belonging. And so, in classrooms and train stations, offices and airport lounges, I drank tea not as a tourist, but as a guest.
Some of the most memorable moments of my time in China happened with a teacup in hand. In Chengdu, Sichuan province, two students had won the prize I donated to a public-interest charity auction: a day trip with me anywhere in China that we could reach and return from in 24 hours. They chose Chengdu for the pandas and the spice, but before lunch we sat for tea in Daci Temple. The students brewed it carefully, performing each step from memory. When I asked why they rinsed the cups and discarded the first brew — what looked to me like perfectly good tea — they hesitated. It’s what their parents and grandparents do, they said. And they learned it from their parents, and so on. The ritual wasn’t about cleanliness or flavor. It was about continuity — performing a gesture as countless hands had done before. A quiet ceremony of connection.
In Beijing, Professor Ding Wenwen took me to a traditional teahouse and asked the hostess to lead me through the full ceremony. She explained every step with patience. When it was my turn to take over, I fumbled a little, spilled a little, forgot the sequence. No one corrected me. The point, I realized, wasn’t mastery — it was mindfulness. It was being present, paying attention, offering your full self to the moment.
In Quanzhou, Fujian province, I was exploring the historical district with a teaching assistant from the Peking University School of Transnational Law, when we wandered into a tiny studio. Inside, a husband and wife made porcelain teapots and cups so fine they were nearly translucent. They invited us to sit for tea, and we talked for more than an hour — not about the wares or prices, but about life, family, travel, and dreams. It was a reminder that tea, in China, is as much a language of friendship as it is a drink.
You don’t rush it. You let it steep.
And then there are the teahouses themselves. You find them not just in scenic areas or historical quarters, but in the heart of cities. In a culture that moves fast — where workdays are long and public transit is swift — teahouses offer something rare: a reason to slow down. No one checks their phone. Conversations unfold without interruption. The layout helps: guests sit beside each other rather than across a table. No one plays host. The tea does that.
Over time, tea has become my go-to gift for friends and family on every trip I make to China. Before I even board the plane home, I receive text messages with requests — Longjing (Dragon Well green tea) from Hangzhou, Zhejiang province, jasmine pearls from Fujian, Pu’er from Yunnan. What began as something I didn’t understand has become something I am trusted to curate. These are no longer just souvenirs. They’re tokens of a shared journey.
In all these moments, I saw something I rarely encounter in the US — a beverage that commands respect not just because of its flavor, but because of its meaning. In the West, we often treat tea as functional: something to energize or soothe. In China, tea is relational. It is ancestral. It is ceremonial. Even when shared casually between friends, it carries an unspoken reverence.
And this brings me to the larger point: it’s time for the rest of the world to catch up. For too long, tea has been reduced in global consciousness to a commodity — leaf grades, caffeine levels, steeping temperatures. But Chinese tea is a cultural treasure, deserving the same reverence given to French wine or Scotch whisky. It has terroir. It has lineage. It has rules and rituals and regional identities. It is not a mere export. It is a heritage.
As China becomes more central to global cultural conversations, its tea traditions — long appreciated domestically — deserve the same global attention. Not just as a drink, but as an expression of history, hospitality, and human connection. When a student gives you tea from their home province, what they’re really giving you is a glimpse of who they are, where they’re from, and how they stay connected to it.
And so, I’ve learned to accept tea slowly. Not just to sip it, but to listen to it. To share its stories, one cup at a time.
The author is a law professor at Ohio Northern University in the United States, and a visiting faculty member at CUPL in Beijing and ECUPL in Shanghai.
Dogecoin (DOGE) price opened 2026 with signs of stabilization following a volatile correction in late 2025. Multiple technical studies suggest downside pressure is easing as price holds key support zones. Analysts now point to recovery structures that could guide Dogecoin toward higher levels if momentum continues to build.
According to analyst Trader Tardigrade, the three-month Dogecoin price against USD chart outlines a clear cyclical structure. Price action moved through alternating phases of advances, recoveries, and declines between July 2025 and January 2026. The most recent segment shows a mild upward shift after the drop toward $0.12.
This phased behavior reflects Dogecoin’s tendency to rotate through sentiment-driven cycles. The latest green recovery bars indicate reduced downside pressure compared to prior red phases. Stabilization near $0.125 suggests buyers are beginning to absorb the remaining supply.
Moreover, the structure implies a potential transition toward an uptrend if support remains intact. Sustained price action above the current range could open the door to a move toward $0.15. Failure to hold the range would instead extend consolidation.
Additionally, analyst BitGuru analyzed the DOGE price chart covering mid-2025 through early 2026. The chart highlights a sharp liquidity sweep in November that pushed the price briefly below $0.12. That move was followed by a tight consolidation range into the new year.
 SOURCE: X

This consolidation phase shows narrowing candles and fading selling pressure. Such behavior often points to accumulation after forced liquidations. Price has continued to respect the $0.12 to $0.13 band, suggesting a balance between buyers and sellers.
In addition, the structure reflects a classic reset following a strong rally earlier in the cycle. A confirmed break above $0.13 would indicate renewed upside momentum. A move below $0.115 would reopen downside risk.
Meanwhile, according to analyst Berke Oktay, the long-term Dogecoin price chart places current price action within a descending wedge spanning more than a decade. DOGE price has compressed into a major support zone between $0.10 and $0.12. This zone has historically acted as a defensive level.
 SOURCE: X
The chart also highlights developing divergences as price holds support despite prior declines. Such conditions often precede trend shifts when selling momentum weakens. Holding this zone prevents a deeper structural breakdown.
Furthermore, the wedge formation suggests energy is building as price compresses. A sustained defense of support could allow Dogecoin to challenge higher resistance levels over time. A breakdown below the zone would invalidate the reversal scenario.
There are two indicators to note when looking to see if there is some significance to Monday’s new retracement low. An internal uptrend line was close to Monday’s low and marked potential dynamic support. More significant is the relationship to the 78.6% Fibonacci retracement at $3.45. It was broken to the downside earlier in Monday’s session but has since been recovered. Natural gas is on track to end the day with a bull hammer candle and a recovery of the 78.6% retracement, which will confirm with a daily close above the level. So, the daily close is set to show support near the Fibonacci level.
Despite the minor short-term signs of strength, today’s decline put natural gas below the 200-day moving average for the first time since late October, and it is set to close in a similar, relatively bearish position. Signs of strong support was possible near the 200-day line since it had not been tested as support after it was reclaimed at the end of October. The bearish failure confirmed by a daily close below the 200-day average today will suggest that downside pressure may yet remain.
The 200-day line is now at $3.57, and Friday’s lower daily high is at $3.70. Although a reclaim of the 200-day average will show improving demand, a sustained breakout above a lower daily high will provide greater assurance that demand is continuing to improve and that the reclaim of the 200-day line may be sustainable.
If sellers remain in charge before a bounce, there is another potential target a little lower than what has been seen so far, at $3.26. That target is the 78.6% projection for a falling ABCD pattern that defines the measured moves of the bearish correction that followed the $5.50 peak in early-December.
For a look at all of today’s economic events, check out our economic calendar.

:max_bytes(150000):strip_icc()/VWH-GettyImages-2226009055-ccef149c7f5a4aee942d8977fb4505e2.jpg "3 Supplements You Should Take at the Right Time for Better Results")