The main category of All News Articles.
You can use the search box below to find what you need.
[wd_asp id=1]
The main category of All News Articles.
You can use the search box below to find what you need.
[wd_asp id=1]
The interest rate differential between the two currencies is negligible at best now, so we’re not even playing along those lines. We’re just trying to figure out whether or not the Bank of England is going to start a larger rate-cutting cycle or not. We already know that the Federal Reserve is likely to cut rates again once or twice, but there are also a lot of questions as to when.
I think you’ve got a lot of concern here playing out, but the British pound has outperformed most of its contemporaries against the US dollar for some time now, be it up or down. It seems to be either stronger or less bad than other currencies, so I expect the dollar to have more of a fight here than it will against other currencies.
The Euro has fallen pretty significantly against the British pound early in the session as we look like we are rolling over at a major resistance barrier. At this point, I think you have to look at this through the prism of a market that is just simply reflecting the reality that the Euro is a lot weaker than the pound against most currencies. So, when you match the two together, this trade makes perfect sense.
We have smashed through a short-term trendline and we’ve smashed through significant support. At this point, I anticipate that this market will continue to go lower, probably down to the 0.86 level initially, and then possibly even lower than that. We’ll just have to wait and see, but this is a pair that I am most certainly interested in shorting, and as a result, I think you have to look at this as an opportunity.
For a look at all of today’s economic events, check out our economic calendar.
XRP is showing signs of renewed strength, as technical patterns and smart money accumulation hint at a potential breakout toward the $2.80–$3 range.
The cryptocurrency has recently demonstrated increased buying interest, with momentum building after tracing key support levels. Analysts point to Wyckoff reaccumulation patterns and long-term Elliott Wave structures, suggesting that XRP may be preparing for a sustained bullish phase in the near term. Current trading sits around $2.15, up 2.86% in the last 24 hours, with a daily trading volume of 3.63 billion XRP, highlighting growing market activity.
Recent observations indicate that XRP/USD is tracing a Wyckoff reaccumulation pattern, a technical structure often interpreted as a period of strategic accumulation before upward movement. @ChartingGuy, a market analyst with a focus on XRP charts, notes: “$XRP is following the Wyckoff reaccumulation phases closely, with a spring low near $1.61 in late 2025. The pattern points to accumulation by smart money before a potential markup.”
XRP/USD traces a Wyckoff reaccumulation pattern, with a “spring” low near $1.61 signaling smart money accumulation before potential markup. Source: @ChartingGuy via X
It is important to clarify that “smart money accumulation” in this context refers to volume and price behavior suggestive of institutional buying, such as:
The Wyckoff phases observed include:
Price activity around $1.68 aligns with this structure, though a daily close below $1.60 could invalidate the pattern and suggest additional consolidation. Analysts now view a breakout scenario toward $2.80–$3 as a probabilistic, not guaranteed, outcome.
Long-term charts analyzed by @MaeliusCrypto apply an Elliott Wave count, mapping XRP’s historical price movements. Maelius commented, “Current price action is in the final stages of wave (4) within a larger impulse. Only one subwave remains before wave (5) could push XRP higher.”

XRP RSI signals a breakout in Q1, pointing to a potential upward price move with a conservative one-week count. Source: @MaeliusCrypto via X
The breakdown includes:
Wave I: Initial rise (2013 onward)
Wave II: Market correction
Wave III: Peak around $3.84 in 2018
Wave IV: Extended multi-year correction
The RSI (14-period) is testing a long-term descending trendline from the 2018 overbought peak. A breakout here, potentially in Q1 2026, could indicate a momentum shift. Conservative projections suggest XRP may initially target $2.80–$3, while more optimistic scenarios extend toward $10, but these long-term estimates are contingent on broader market health and Bitcoin’s trend. A failure to hold key support around $2.00 would invalidate the Elliott Wave setup.
TradingView analyst BTC-HONDA notes that XRP is forming a long-term falling wedge, characterized by declining volume and multiple breakout attempts. He observes, “The setup is remarkably clean. Price has teased upside potential several times, and a bullish resolution appears probable, especially if Bitcoin confirms strength.”

XRP forms a clean falling wedge, teasing $2.40–$2.80 upside, with BTC strength key to confirming the bullish breakout. Source: BTC-HONDA on TradingView
The wedge implies an initial target zone of $2.40–$2.80, with potential for higher gains if the broader crypto market strengthens. XRP’s near-term movement remains closely correlated with BTC performance, making confirmation from Bitcoin critical for sustaining any breakout.
XRP appears positioned for a potential breakout, supported by Wyckoff reaccumulation, Elliott Wave patterns, and a falling wedge. The technical structure suggests accumulation and a higher probability of upward momentum, but market conditions, Bitcoin performance, and regulatory developments remain critical factors.

XRP was trading at around 2.15, up 2.86% in the last 24 hours at press time. Source: XRP price via Brave New Coin
Short-term projections point to $2.80–$3, while long-term scenarios could extend toward $10, contingent on favorable conditions. Traders and investors are advised to monitor volume expansion, daily closes, and key support/resistance levels to gauge the validity of these setups and manage potential risks effectively.
BOCA RATON, FL, Jan. 05, 2026 (GLOBE NEWSWIRE) — DeFi Development Corp. (Nasdaq: DFDV) (the “Company”), the first public company with a treasury strategy built to accumulate and compound Solana (“SOL”), today announced the publication of a comprehensive analysis detailing Solana’s industry-leading performance across the most important onchain metrics in 2025. The full report is available here: https://defidevcorp.beehiiv.com/p/solana-2025
With 2025 now in the rear-view, the smart contract war has entered its second decade. For a second consecutive year, Solana not only outperformed every major smart contract platform but extended and compounded its lead across real demand and economic activity. The data shows Solana decisively ahead of Ethereum, BNB Chain, and all other competitors across usage, growth, and economic gravity.
Key highlights from the report include:
• Transactions & Throughput: Solana processed approximately 33.1 billion transactions in 2025, up 28% YoY, more than all other major blockchains combined. Solana also averaged over 1,100 transactions per second, a 34% increase from 2024.
• User Growth: Solana added approximately 1 billion new wallets in 2025, a ~50% year-over-year increase and more than every other major chain combined.
• Developer Ecosystem: Solana hosted approximately 10,753 active developers in 2025 (+41% YoY), surpassing Ethereum’s developer count.
• Onchain Economic Activity: Decentralized exchange (DEX) volume on Solana surged to $1.57 trillion, up 126% YoY, and eclipsed Ethereum’s ~ $946 billion total.
• Network Revenue: Solana generated approximately $1.41 billion in onchain fees, surpassing Ethereum even as fee levels remained dramatically lower.
• Fee Stability: Using DeFi Development Corp.’s Fee Stability Ratio (FSR), Solana scored roughly 743, signaling astronomically lower median transaction fees and median transaction fee volatility than peers.
• Tokenized Markets: In just six months following the launch of tokenized equities on Solana, the network processed approximately $2.9 billion in tokenized stock volume, more than any other chain.
The 2025 Solana Dominance Report is data-driven and transparent, drawing on publicly available metrics across transactions, wallet growth, throughput, developer activity, economic volume, revenue, fee reliability, and emerging markets such as tokenized securities.
To read the full analysis, visit: https://defidevcorp.beehiiv.com/p/solana-2025
About DeFi Development Corp.
DeFi Development Corp. (Nasdaq: DFDV) has adopted a treasury policy under which the principal holding in its treasury reserve is allocated to SOL. Through this strategy, the Company provides investors with direct economic exposure to SOL, while also actively participating in the growth of the Solana ecosystem. In addition to holding and staking SOL, DeFi Development Corp. operates its own validator infrastructure, generating staking rewards and fees from delegated stake. The Company is also engaged across decentralized finance (“DeFi”) opportunities and continues to explore innovative ways to support and benefit from Solana’s expanding application layer.
The Company is an AI-powered online platform that connects the commercial real estate industry by providing data and software subscriptions, as well as value-add services, to multifamily and commercial property professionals, as the Company connects the increasingly complex ecosystem that stakeholders have to manage.
The Company currently serves more than one million web users annually, including multifamily and commercial property owners and developers applying for billions of dollars of debt financing per year, professional service providers, and thousands of multifamily and commercial property lenders, including more than 10% of the banks in America, credit unions, real estate investment trusts (“REITs”), debt funds, Fannie Mae® and Freddie Mac® multifamily lenders, FHA multifamily lenders, commercial mortgage-backed securities (“CMBS”) lenders, Small Business Administration (“SBA”) lenders, and more. The Company’s data and software offerings are generally offered on a subscription basis as software as a service (“SaaS”).
Forward Looking Statements
This release contains “forward-looking statements” within the meaning of the safe harbor provisions of the U.S. Private Securities Litigation Reform Act of 1995, including concerning the warrant distribution; the anticipated record date and distribution date for the warrant; the anticipated gross proceeds from the exercise of warrants; the expected use of proceeds; the acceptance to trading of the warrants on the Nasdaq Capital Market; the prices of the warrants; and the existence of a market for those warrants. Forward-looking statements can be identified by words such as: “anticipate,” “intend,” “plan,” “believe,” “project,” “estimate,” “expect,” strategy,” “future,” “likely,” “may,”, “should,” “will” and similar references to future periods. Forward-looking statements are neither historical facts nor assurances of future performance. Instead, they are based only on our current beliefs, expectations and assumptions regarding the future of our business, future plans and strategies, projections, anticipated events and trends, the economy and other future conditions. Because forward-looking statements relate to the future, they are subject to inherent uncertainties, risks and changes in circumstances that are difficult to predict and many of which are outside of our control, including market risks, trends and uncertainties, and other risks and uncertainties more fully in the section captioned “Risk Factors” in the Company’s most recent Annual Report on Form 10-K, subsequent Quarterly Reports on Form 10-Q and other reports we file with the SEC. As a result of these matters, changes in facts, assumptions not being realized or other circumstances, the Company’s actual results may differ materially from the expected results discussed in the forward-looking statements contained in this press release. Forward-looking statements contained in this announcement are made as of this date, and the Company undertakes no duty to update such information except as required under applicable law.
Investor Contact:
ir@defidevcorp.com
Media Contact:
press@defidevcorp.com
AT&T Inc. (T) declined in its latest intraday trading after colliding with resistance at its 50-day SMA, which exposed the stock to mounting negative pressure. This pressure intensified with the emergence of negative signals from the RSI after reaching severely overbought levels, exaggerated relative to price action, while the main bearish trend continues to dominate the short term.
Therefore we expect the stock price to decline in the upcoming trading sessions, as long as resistance at $25.00 holds, to target the key support level at $24.00.
Today’s price forecast: Bearish
After years of watching pet supplement aisles explode with dubious promises and flashy labels, veterinarians are finally cutting through the noise. The question isn’t if your dog needs supplements anymore; it’s which ones actually work, and which ones are backed by science rather than marketing budgets.
Spending time with veterinary researchers and practitioners reveals a consistent pattern: the supplements they recommend for their own dogs often differ dramatically from those that dominate retail shelves. Here’s what’s actually making it into veterinary clinics and onto the recommendation lists of professionals who’ve seen the research firsthand.
The most significant shift in veterinary supplementation is related to gut health. Digestive health has emerged as a cornerstone of canine wellness, with mounting evidence showing connections between gut microbiome balance and everything from immune function to behavior.
“Probiotics introduce good bacteria into a dog’s gut, helping to reduce inflammation and speed up the recovery of their gut microbiome,” explains Dr. Jan Suchodolski, professor at Texas A&M Gastrointestinal Lab. His research has fundamentally changed how veterinarians approach digestive issues, moving beyond simply treating symptoms to actively rebuilding gut flora.
But here’s where most dog owners get it wrong: dumping probiotics into your dog’s bowl without considering their diet is like planting seeds in concrete. Suchodolski emphasizes that the best results come with fiber-rich food to foster good bacteria. The probiotics need something to feed on, and that’s where dietary fiber becomes crucial. Think of it as creating a hospitable environment rather than just adding tenants.
Veterinarians are now recommending probiotics not just for dogs with active digestive issues, but as preventative care, particularly after antibiotic treatments, during stressful periods like boarding or travel, or for senior dogs whose gut microbiomes naturally decline with age.
While gut health represents the new frontier, joint supplements remain the most prescribed category in veterinary medicine, and for good reason. The difference now is that veterinarians have decades of clinical data backing their recommendations, along with a clearer understanding of what actually works.
“Glucosamine and chondroitin promote healthy cartilage, shock absorption, and joint function, especially important for large-breed dogs,” states Dogs Inc. veterinary experts, noting these as top supplements. The science here isn’t new, but the application has become more sophisticated. Veterinarians now emphasize starting supplementation before problems become visible, particularly in breeds predisposed to joint issues.
Bernadine Cruz, DVM, frames it in practical terms: “Glucosamine and chondroitin sulfate are building blocks of normal articular cartilage… they will keep other joints healthy.” This preventative approach represents a paradigm shift, treating joint health like dental care, something you maintain rather than fix after it breaks.
Modern joint formulas have evolved beyond simple glucosamine and chondroitin combinations. Research shows that comprehensive formulas containing glucosamine, chondroitin, MSM, ASU, and hyaluronic acid “can protect and heal cartilage, improve the amount and quality of joint fluid, and reduce inflammation and pain.” These multi-ingredient approaches address joint health from multiple angles simultaneously, which clinical trials suggest produces superior outcomes to single-ingredient supplements.
The challenge for dog owners is finding ones that address root causes rather than masking symptoms. This is where platforms like Pup Labs have carved out a distinct position in the supplement space, focusing on targeted formulations backed by scientifically-studied ingredients.
Rather than offering generic multivitamins or one-size-fits-all wellness blends, Pup Labs takes a problem-specific approach. Their K9 Belly Bliss directly addresses the gut health concerns veterinarians now prioritize, combining prebiotics and probiotics specifically formulated to repair gut walls and improve nutrient absorption. It’s the kind of targeted intervention that aligns with current veterinary thinking on microbiome health.
For joint issues, Pup Labs focuses on what veterinarians identify as a frequently overlooked problem: synovial drying. Their Joint Support formula aims to rebuild cartilage and ligaments while addressing the root cause of joint discomfort, not just managing pain. This aligns with the preventative, multi-faceted approach that veterinary research now supports.
The platform extends beyond the traditional gut-and-joint supplement duo that dominates veterinary recommendations. ProDenta tackles dental hygiene—an area where many dog owners struggle with compliance—using a powder format designed to combat bad breath, reduce plaque, and support healthy gums without the battle of daily brushing.
The company also addresses common quality-of-life issues that drive many veterinary visits: their Skin & Coat Support focuses on soothing itchy skin, reducing inflammation, and promoting healthy fur growth by addressing underlying causes rather than superficial symptoms.
What sets this approach apart is the emphasis on root-cause solutions rather than symptomatic relief. Dog owners looking for veterinary-grade formulations can explore these options at www.puplabs.com, where the focus remains on scientifically-studied ingredients addressing specific health concerns.
The veterinary consensus on supplementation in 2026 comes down to three core principles: address specific needs with evidence-based products, focus on prevention rather than correction, and prioritize quality over marketing claims.
For most dogs, this means considering probiotics for gut health maintenance and joint supplements for breeds or individuals at risk for mobility issues. Everything else should be discussed with your veterinarian based on your dog’s specific health profile, not the latest trend in the pet wellness space.
The supplement conversation has matured beyond whether dogs need them into a more nuanced discussion about which dogs benefit from which supplements, when to start, and how to measure effectiveness. The smartest approach remains the simplest: ask your vet what they’d give their own dog, look for products with veterinary backing, and remember that supplements should supplement—not substitute for—proper nutrition and care.
###
Solana price continued rising on Monday, reaching its highest point since December 12. SOL token rose to a high of $135 on Monday, up by over 15% from its lowest point this year. So, will the token rebound like Solana meme coins?
The main reason why the Solana price is soaring is that sentiment in the crypto industry has improved in the past few days. Indeed, the popular Crypto Fear and Greed Index has jumped from the extreme fear zone of 8 in 2025 to the current 41.
The surge has also coincided with the ongoing rebound of Solana meme coins. Data show that the market capitalization of these meme coins rose 15.7% over the last 24 hours to over $6.69 billion, while their 24-hour volume rose to over $3 billion.
READ MORE: Will the CLARITY Act Boost Crypto Prices in 2026?
Official Trump and Bonk tokens jumped, reaching a market capitalization of over $1 billion. Other top Solana meme coins like Pudgy Penguins, Pippin, Dogwifhat, and Fartcoin have jumped by double digits in the past few days.
Data compiled by DeFi Llama shows that Solana has continued to benefit from this surge. For example, the volume handled by Solana DEX networks jumped to over $102 billion in the last 30 days. Its volume was much higher than Ethereum and BSC combined. The two had over $44 billion and $55 billion in combined assets.
Solana has other bullish catalysts. For example, Solana’s futures open interest has started rising, reaching a high of $8 billion, its highest level since November 5. It has been in a strong uptrend after bottoming at $7.2 billion in December.
Meanwhile, spot Solana ETF inflows have continued rising. These funds added over $775 million in the past few months, bringing the total assets to $1.02 billion. Bitwise, Grayscale, Fidelity, and VanEck funds are leading this gain.
Solana is also preparing for the Alpenglow upgrade, which aims to boost its speeds over time. It aims to make it much better than other chains, such as Ethereum and BNB Smart Chain.
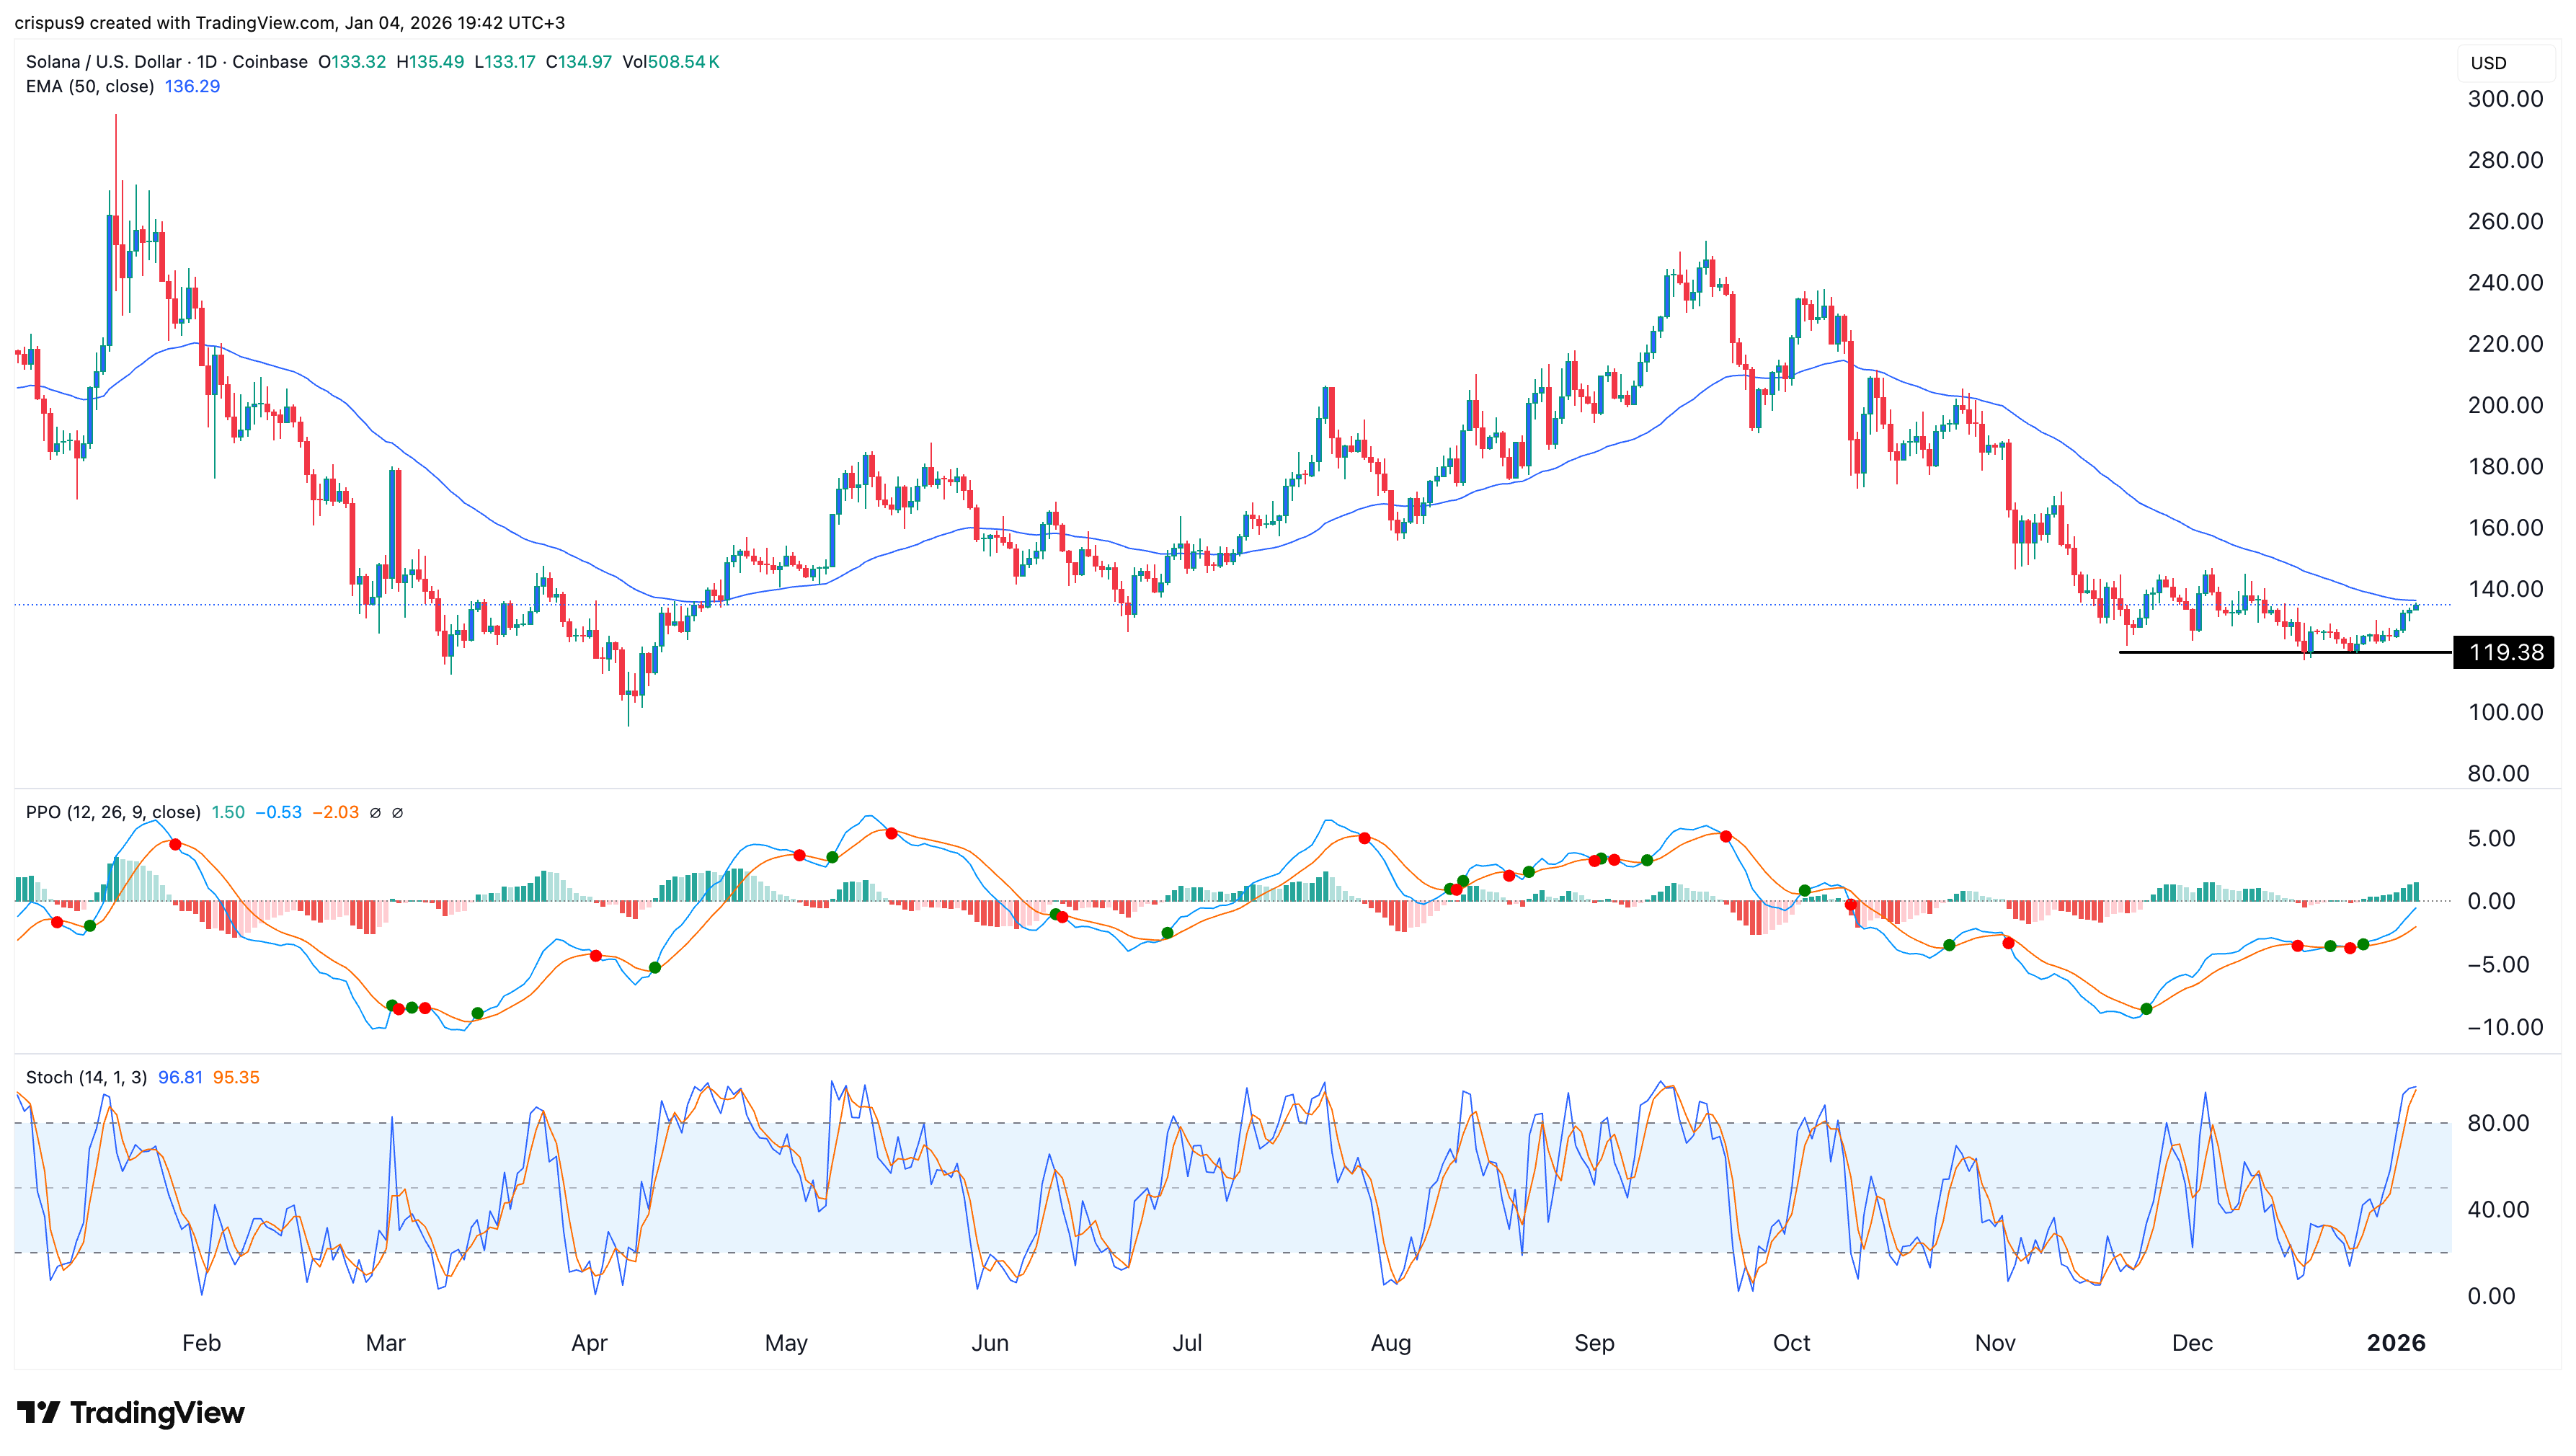
The daily chart shows that the Solana price has rebounded in the past few days. It bottomed at $119.38 and has moved above the 25-day Exponential Moving Average (EMA).
The two lines of the Percentage Price Oscillator (PPO) have crossed above the zero line and are nearing it. Also, the Stochastic Oscillator has continued to rise and moved above the overbought level.
Therefore, the token will likely continue to rise as bulls target the psychological $150 level. A move above that level will signal more gains, potentially to the $200 resistance level. However, a drop below the key $120 support will invalidate the bullish forecast.
READ MORE: Here’s Why the Shiba Inu Coin Price is Going Parabolic
Tiffany Reid was just 18 months old when she passed a kidney stone for the first time.
Many more would come during the next four decades of her life — along with multiple infections and bladder issues — despite Reid’s efforts to follow her healthcare providers’ advice to drink more water or change her diet. It wasn’t until she was an adult and in kidney failure that she got referred to a kidney specialist (a nephrologist) and finally got a diagnosis.
After his suggestion to get genetic testing, Reid discovered she had primary hyperoxaluria (PH), a rare genetic disorder that produces too much oxalate, which leads to kidney stones, kidney damage and, potentially, kidney failure.
The effects of primary hyperoxaluria
Primary hyperoxaluria is a term that describes a group of rare genetic disorders affecting fewer than 1,000 people in the U.S.
PH causes too much oxalate to build up in the kidneys and other parts of the body. The excess oxalate eventually contributes to the development of kidney stones, which are extremely painful, and can progress to organ disease and failure.
People living with PH either cannot make the enzyme needed to prevent oxalate from building up or they don’t make enough of it. And PH is categorized into three types: PH1, PH2 and PH3.
“The three types of PH are based on abnormalities of three different genes, all of which result in increased production and urinary [output] of oxalate,” said Bradley A. Warady, M.D., a pediatric nephrologist in Kansas City, Missouri.
PH1 is the most common and most severe type. About half of PH1 patients will go on to develop kidney failure if they are not diagnosed and treated early. But effective treatment may slow down the disease.
Many people living with PH2 can maintain normal kidney function, but for up to 1 in 3 people, it can progress to kidney failure. Early detection and treatment can make a difference. PH3 is the least common and mildest form of PH and rarely causes kidney failure.
Diagnosing primary hyperoxaluria
Diagnoses of PH often take place when a healthcare provider notices certain symptoms — like recurrent kidney stones — and investigates further. HCPs can order an ultrasound to detect calcification (calcium buildup that hardens into deposits) of the kidneys. But a definitive diagnosis takes place through genetic testing or by finding oxalate in urine or plasma.
Symptoms of primary hyperoxaluria
The most common symptom is kidney stones, but PH can have several other symptoms, including:
PH can indirectly affect other areas of a person’s overall health. For example, PH doesn’t directly affect a person’s ability to conceive or give birth, but patients with PH can have trouble conceiving if they develop kidney disease or other organ failures.
The stress of dealing with PH symptoms and kidney disease and failure can also lead to or worsen depression and anxiety. The pain, infections and other symptoms people experience can affect overall quality of life since the fatigue and pain can force people living with PH to miss time from school, work, socializing and other activities they enjoy.
This was Reid’s experience. Because she was often in pain, she had trouble keeping a regular job, and she couldn’t always attend activities and events with her children. The mental toll of not knowing what was wrong and feeling she must be doing something wrong —– perhaps not eating correctly or drinking enough water —– nearly led to a mental breakdown, she said.
Treatments for primary hyperoxaluria symptoms
The main recommendation for controlling symptoms and pain for people with PH is to focus on significant fluid intake to lower oxalate levels in the body and prevent crystallization in the kidneys and other organs. Water is needed to dilute the oxalate that ends up in urine, helping decrease the risk of painful kidney stones forming.
Although “hyperhydration” can help reduce the likelihood of kidney stones, the treatment carries its own physical and emotional toll. Patients can experience disrupted sleep and interruptions at school and work due to frequent bathroom trips. Support groups for people with PH suggest patients work with schools and employers to get accommodations for their bathroom breaks and liquid intake.
Other therapies include potassium citrate, which can help prevent kidney stones from forming. And up to 3 out of 10 people with PH1 see a reduction of their oxalate levels by taking pyridoxine (vitamin B6) because the genetic mutation responds well to the vitamin.
Newer treatments such as RNAi therapeutic agents have also been shown to decrease oxalate production in people with PH1.
Dietary changes can help some patients, and some healthcare providers might suggest avoiding foods with a high oxalate content, like chocolate, nuts and spinach, and limiting animal protein, which can increase oxalate. Reducing salt intake can also help.
For patients with advanced kidney disease, dialysis or a transplant might be necessary.
Because living with PH symptoms can take a toll on patients’ mental health, Warady said patients should work with their care team to find mental and behavioral health providers who can provide support. Patients can also benefit from support groups, such as ones found through the Oxalosis and Hyperoxaluria Foundation.
Early diagnosis of primary hyperoxaluria
Because of advances in genetic testing, the average age at diagnosis for PH has come down significantly, but the disease can still take a long time to diagnose.
Early diagnosis and treatment are extremely important because it can help hold off or prevent the progression of PH. Those diagnosed later in life can face worse outcomes because of the long-term effects of kidney stones, infections and other stresses on the body like bone disease and anemia that result from oxalate buildup.
Reid didn’t have the benefit of early diagnosis and treatment, but three years into knowing how to manage her PH1 as best as possible, she has a better outlook on her future.
Today, Reid is an advocate for patients with PH through the Oxalosis and Hyperoxaluria Foundation, the organization that supported her through her diagnosis and treatment plan. Receiving kidney and liver transplants and learning how to effectively manage her PH1 for the first time in her life has improved both her physical and mental health.
While PH has no cure, getting diagnosed as early as possible, understanding your PH type and working with a healthcare team to determine the best plan of care can make life with the condition easier.
This educational resource was created with support from Alnylam.
From Your Site Articles
Related Articles Around the Web
The WTI crude oil price is showing signs of bottoming after hitting a key support level at $55.40. It has plunged by over 25% from its highest level in 2025 and is hovering near its lowest level in years.
Crude oil prices will be in the spotlight on Monday as the market comes to terms with the recent developments in Venezuela, where Donald Trump staged a major attack and arrested the country’s president.
In his press conference, Trump insisted that the United States will now be in charge of the country, with its large energy companies investing billions of dollars.
In theory, the fall of the Maduro regime should be bearish for oil prices. For one, with the US in control, it means that sanctions will be lifted and that production will be boosted.
However, in reality, Venezuela is still a small player in the oil market, producing less than 1 million barrels of oil a day. Also, American investments will take years to materialize. And worse, regime changes often lead to destabilization of countries and supply.
The other main catalyst for the WTI crude oil price will be the OPEC+ meeting in which officials are expected to stick with their plans to pause supply increases in the first quarter. The cartel increased supply rapidly last year, leading to concerns about oversupply in the market.
Meanwhile, the US will publish the first inventory report on Wednesday. The report by the EIA is expected to show that inventories dropped by over 1 million in the last week of the month.

The weekly chart shows that the WTI crude oil price has been in a strong downward trend in the past few months. It bottomed at $54.40, its lowest level in April and December last year.
Oil has formed a double-bottom pattern, which is made up of two lower swings and a a neckline, which is at $77.32.
However, technical indicators suggest that oil may continue falling in the near term. For one, the price remains below the 50-week and 100-week Exponential Moving Averages (EMA). The MACD and the Relative Strength Index (RSI) have continued falling in the past few weeks.
Therefore, the most likely oil forecast is neutral with a bullish bias. The bullish outlook will remain as long as it is above the double-bottom pattern point at $55.39. A drop below that level will point to more downside, potentially to $50.
Ready to trade our Weekly Forex forecast? Check out our list of the best Forex brokers in the world.
Important DisclaimersFXEmpire is owned and operated by Empire Media Network LTD., Company Registration Number 514641786, registered at 7 Jabotinsky Road, Ramat Gan 5252007, Israel. The content provided on this website includes general news and publications, our personal analysis and opinions, and materials provided by third parties. This content is intended for educational and research purposes only. It does not constitute, and should not be interpreted as, a recommendation or advice to take any action, including making any investment or purchasing any product. Before making any financial decision, you should conduct your own due diligence, exercise your own discretion, and consult with competent advisors. The content on this website is not personally directed to you, and we do not take into account your individual financial situation or needs. The information contained on this website is not necessarily provided in real time, nor is it guaranteed to be accurate. Prices displayed may be provided by market makers and not by exchanges. Any trading or other financial decision you make is entirely your own responsibility, and you must not rely solely on any information provided through the website. FXEmpire does not provide any warranty regarding the accuracy, completeness, or reliability of any information contained on the website and shall bear no responsibility for any trading losses you may incur as a result of using such information. The website may include advertisements and other promotional content. FXEmpire may receive compensation from third parties in connection with such content. FXEmpire does not endorse, recommend, or assume responsibility for the use of any third-party services or websites. Empire Media Network LTD., its employees, officers, subsidiaries, and affiliates shall not be liable for any loss or damage resulting from your use of the website or reliance on the information provided herein.Risk DisclaimersThis website contains information about cryptocurrencies, contracts for difference (CFDs), and other financial instruments, as well as about brokers, exchanges, and other entities trading in such instruments. Both cryptocurrencies and CFDs are complex instruments and involve a high risk of losing money. You should carefully consider whether you understand how these instruments work and whether you can afford to take the high risk of losing your money. FX Empire encourages you to conduct your own research before making any investment decision and to avoid investing in any financial instrument unless you fully understand how it works and the risks involved.