The main category of All News Articles.
You can use the search box below to find what you need.
[wd_asp id=1]
The main category of All News Articles.
You can use the search box below to find what you need.
[wd_asp id=1]
Pepeto (https://pepeto.io is trending in crypto news today as traders compare conservative payment assets with more beta plays. On CoinMarketCap, the XRP price today is $1.83 with a live market cap of $110,604,035,575 and a 24-hour volume of $1,529,647,135. Bitcoin price today is $87,224.89 with a market cap of 1,741,629,386,904, and Ethereum price today is $2,904.73 with a market cap of 350,585,797,843.
XRP nevertheless lies in a category that most traders consider defensive within the realm of the alt market. Its story is the cross-border movement of value and enterprise rails. That positioning is useful for helping it maintain liquidity and relevance, but it does cap explosive upside, as the market already prices in maturity and scale.
One thing that is important for an XRP price prediction (https://coinmarketcap.com/currencies/xrp/) is not whether or not XRP can move. It can. The issue is the magnitude. When an asset already has a nine-figure volume footprint on a daily basis and a large market cap, price expansion tends to occur in measured legs, rather than instantly with vertical leaps.
Technical Analysis With the Help of Trend Structure and Momentum Signals
For a clean technical view, traders combine the structure of the trend and momentum confirmation. The 200-day moving average is very popular and can be used as the macro filter. When XRP is trading above that level and drawing higher lows, the long-term bias remains constructive. When it loses that level and fails to regain it, markets will often change into longer consolidation.
The 50-day moving average is similar to a swing checkpoint. A reclaim and hold above it is often an indication that buyers are taking back control, especially if there is volume expansion during the move. RSI and MACD are used to help determine if momentum is real. RSI above the midline is often bullish of further demand, and MACD turning positive can be a bullish sign of a new phase of impulse.
From here, 3 realistic scenarios determine expectations. First, steady continuation where XRP forms higher lows and grinds up as sentiment improves. Second, a range phase where price chops around while the market waits for a catalyst. Third, a deeper reset of support prior to the next cycle leg. None of these paths have fantasy multiples needing to be bullish. They are simply a description of the most common behavior for a large liquid asset.
Source: https://www.tradingview.com/symbols/XRPUSD/
Why Risk On Capital Looks Beyond Mature Networks
During risk-on phases, the capital is like a ladder of targets. It begins in the majors for stability, then spreads out into the liquid large caps, then looks for smaller narratives once the traders are confident. That is why both blue chips and presales are often part of the best crypto to buy now searches. Traders want a base layer that has value and an upside sleeve to be able to multiply faster.
Mature networks such as XRP can benefit from the whole market rallying, but they are not usually the ones with the most extreme percent gains. To double, huge caps can require billions of net buying pressure. In contrast, smaller bases have a lot less to reprice with. That asymmetry is what drives the search for the next meme coin to explode and the next 100x meme coin during late-cycle expansions.
The risk is that many presales just provide hype. They have the ability to spike on attention and then dissipate when attention shifts. So the market has begun to reward memes that provide utility, as utility of use can ensure that demand does not die after the initial excitement is over.
Pepeto Meme Utility Stack and How to Buy Pepeto
Pepeto brands itself as meme culture + real utility, which can be described as PEPE + Technology + Optimization on the Ethereum mainnet. Instead of stopping with branding, it pushes an infrastructure stack built to keep users active. PepetoSwap is intended to be a zero-fee swap. Cross-chain movement is supported by the Pepeto Bridge. Pepeto Exchange is in the role of a verified meme exchange where all trading volume paths through PEPETO, turning the activity of demand.
Pepeto has leaned on tokenomics too in order to reduce near-term sell pressure. Total supply is 420,000,000,000,000. Staking APY is being sold for roughly 216% (https://pepeto.io/en/staking). The project mentions audits by SolidProof and Coinsult, and there are a substantial 100,000+ members who are early believers of this project. It also puts growth momentum in an ecosystem pipeline with 850+ projects applying.
Presale positioning is the trigger. The current presale price is $0.000000173. Funding is $7,113,592.37, with a countdown timer indicating the next price increase. That is a stage pricing model, which means delay has a cost, and early buyers lock up the lowest entries while the market is still quiet.
How to Buy Pepeto.
Start at https://pepeto.io and verify the domain before connecting a wallet, as there are fake pages on popular presales. Connect your wallet and purchase in ETH, USDT, or BNB or with a bank card using Web3Payments. Once you purchase, stake early if you want the high APY window before launch. A $700,000 giveaway can be obtained through the official website, so use official links only.
This is where the comparison is useful. XRP has a mature adoption story and more stable price action. Pepeto is aimed at the high beta lane, where it can be more important to be in the right place at the right time than it is to be in the right place at the right time.
If the market flips fully risk-on, the largest winners are usually positioned before listings widen access, before mainstream influencers start pushing the narrative, and before the chart has already repriced the move. That is when the risk-reward is most asymmetric and when small entries can still turn into meaningful outcomes. Once the crowd arrives, the upside is compressed and investors are no longer buying opportunity, they are buying confirmation.
For anyone searching for the best crypto to invest in and the best crypto presale to buy, missing the early stages is the mistake that repeats every cycle. People do not regret the coins they researched early, they regret the ones they watched build traction and still waited on until the price made the decision for them. Pepeto is being treated as one of those early-stage windows where the returns can be life-changing when adoption and volume scale, and where late buyers often end up wishing they acted when the entry was still available.
To stay ahead of key updates, listings, and announcements, follow Pepeto on its official channels only:
Website: https://pepeto.io
X (Twitter): https://x.com/Pepetocoin
Telegram: https://t.me/pepeto_channel
Instagram: https://www.instagram.com/pepetocoin/
Contact: Dani Bonocci
Website: https://www.tokenwire.io
Phone: +971586738991
SOURCE: Pepeto
Press release distribution
This release was published on openPR.

Gold and silver price today, prediction and forecast remained supported due to expectations of lower U.S. interest rates. Spot gold rose 0.8 percent to $4,516.50 per ounce at 0933 GMT. Gold touched a record of $4,530.60 earlier. U.S. gold futures for February delivery rose 1 percent to $4,547.70.
UBS analyst Giovanni Staunovo said demand for gold and silver remains strong due to expectations of lower U.S. interest rates. He also said low liquidity is increasing volatility in precious metals markets.
Gold and silver price today, prediction and forecast also reflects gold’s strongest yearly performance since 1979. Several factors supported this trend. These include Federal Reserve policy easing, central bank purchases, ETF inflows, and reduced reliance on the U.S. dollar.
Markets expect two interest rate cuts next year. These expectations are based on signals of a more flexible Federal Reserve approach. Gold remains supported as it does not offer yield but benefits from lower rates.
Gold and silver price today, prediction and forecast also reflects physical market activity. Gold discounts in India widened to the highest level in more than six months. In China, discounts narrowed compared to last week. Earlier, China discounts had reached a five-year high.
These changes indicate varied demand conditions across major consumer markets. Pricing remains sensitive to local demand and currency movement.
Gold and silver price today, prediction and forecast highlights silver’s sharp rise. Spot silver rose 4 percent to $74.82 per ounce. It reached an all-time high of $75.14 earlier in the session. Silver prices have risen 158 percent so far this year.
The rise is linked to supply shortages, its classification as a U.S. critical mineral, and industrial demand. Silver continues to attract attention from investors seeking alternatives to gold.
Gold and silver price today, prediction and forecast also includes movement in platinum and palladium. Spot platinum rose 7.3 percent to $2,382.35 per ounce. It earlier reached a record high of $2,448.25. Palladium rose 8.3 percent to $1,823.76.
Both metals are used in automotive catalytic converters. Prices increased due to supply constraints, tariff uncertainty, and shifting investment interest. Platinum is up around 170 percent this year. Palladium is up more than 90 percent.
Gold and silver price today, prediction and forecast also reflects policy developments. Staunovo said platinum and palladium markets are smaller than the gold market. Limited investor activity can cause sharp price movement.He also noted that the European Commission’s plan to ease the 2035 ban on combustion engines has supported prices. This policy change increased expectations for continued demand in automotive use.
Gold and silver price today, prediction and forecast shows all precious metals heading for weekly gains. Platinum recorded its strongest weekly rise on record. Market participants continue to track interest rate signals and supply conditions.
Precious metals remain sensitive to global economic signals. Investor focus remains on monetary policy, industrial demand, and geopolitical developments.
Q1: Why are gold and silver prices rising today?
Gold and silver price today, prediction and forecast shows prices rising due to rate cut expectations, global uncertainty, supply shortages, and increased investment demand across precious metals markets.
Q2: What is the outlook for gold and silver prices?
Gold and silver price today, prediction and forecast suggests prices may remain supported as long as rate cut expectations, central bank buying, and industrial demand continue.
Guwahati: For years, Indian tea consumers browsing supermarket shelves or online stores have encountered a confusing mix of labels such as herbal tea, flower tea and detox tea, often displayed alongside traditional black or green tea. A new clarification issued by India’s food regulator now aims to put an end to that ambiguity.
In an order dated December 24, the Food Safety and Standards Authority of India (FSSAI) ruled that the word “tea” can be used only for products made from Camellia sinensis, the plant from which all true teas—black, green, oolong, white and pu-erh—are derived. Herbal, floral and other plant-based infusions, the regulator said, cannot be marketed as tea.
The clarification goes beyond a technical change in labelling. According to FSSAI, the use of the term tea for products not derived from Camellia sinensis is misleading and amounts to misbranding under the Food Safety and Standards Act, 2006. The move is intended to ensure that when consumers purchase a product labelled as tea, they are clearly informed about what they are consuming, including its characteristic flavour profile, caffeine content and biochemical properties.
Botanically and scientifically, Camellia sinensis (L.) Kuntze is an evergreen perennial shrub belonging to the family Theaceae. Its young leaves and buds are the sole source of all true tea consumed worldwide. The plant naturally contains compounds such as catechins, theaflavins, caffeine and L-theanine, which together give tea its taste, aroma and physiological effects. Beverages made from other plants may offer their own benefits, but in scientific and regulatory terms they are classified as infusions or tisanes, not tea.
The ruling comes at a time when India’s wellness beverage market is expanding rapidly, with many herbal and functional drinks borrowing the cultural and commercial credibility of tea in their branding. FSSAI’s clarification draws a clear distinction between traditional tea and wellness infusions without restricting the sale of the latter. Such products can continue to be marketed, provided they are accurately described on labels in accordance with the Food Safety and Standards (Labelling and Display) Regulations, 2020.
The organised tea industry has welcomed the decision, describing it as long-overdue clarity for both consumers and producers. “We are very happy with this much-needed clarification from FSSAI,” said Bidyananda Barkakoty, Adviser to the North Eastern Tea Association (NETA). “This definition of tea removes ambiguity from consumers’ minds and helps clear clutter and confusion in the marketplace.” He added that the Indian regulator’s position is consistent with global practice, noting that even the U.S. Food and Drug Administration recognises only beverages derived from Camellia sinensis as tea.
Under existing regulations, non-tea infusions cannot use the word “tea” in any form, direct or indirect. Depending on their composition, such products may need to be classified as proprietary foods or obtain approval under separate food safety regulations. The directive applies across the supply chain, covering manufacturers, importers, retailers and e-commerce platforms, with state food safety authorities responsible for enforcement.
For consumers, the impact is straightforward: clearer labels, reduced confusion and greater transparency about what is actually in their cup.
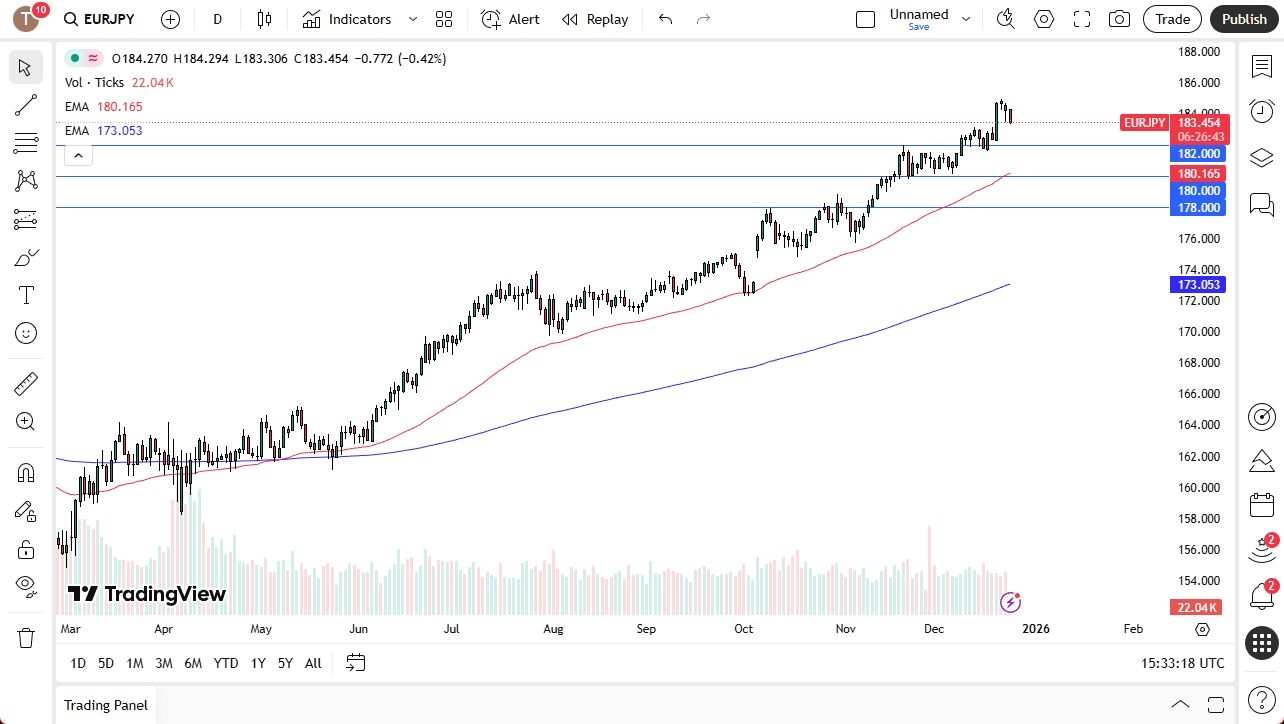
Any pullback at this point in time will more likely than not be interesting for those willing to take advantage of the overall trend, and I do think that it’s only a matter of time before we bounce and go looking to the 185 yen level for a longer-term move.
Ultimately, the interest rate differential still favors the European currency over the Japanese one, and therefore I think we’ve got a situation where a lot of traders are hanging on to this and collecting that swap at the end of every day. I have no interest in shorting anytime soon, but if we did break down below the 175 yen level, then we would have to think about that.

All things being equal, this is a market that I think remains one that is probably going to move mainly based on the Japanese yen itself, as the Bank of Japan has found itself in a little bit of trouble suggesting that they were going to tighten monetary policy because it appears that the financial markets think that will do nasty things to the Japanese economy, especially considering all of the debt that the Japanese currently hold.
With this and the fact that we’ve been in a nice 45-degree uptrending angle for what seems like a lifetime, I have no interest in shorting, and I do think that we eventually not only hit 185 yen but probably higher.
Begin trading our daily forecasts and analysis. Here is a list of Forex brokers in Japan to work with.
Christopher Lewis has been trading Forex and has over 20 years experience in financial markets. Chris has been a regular contributor to Daily Forex since the early days of the site. He writes about Forex for several online publications, including FX Empire, Investing.com, and his own site, aptly named The Trader Guy. Chris favours technical analysis methods to identify his trades and likes to trade equity indices and commodities as well as Forex. He favours a longer-term trading style, and his trades often last for days or weeks.
Market Overview:
The Gut Microbiota Supplement Market is expected to reach at a Significant CAGR during the forecast period 2024-2031.
The Gut Microbiota Supplement Market report, published by DataM Intelligence, provides in-depth insights and analysis on key market trends, growth opportunities, and emerging challenges. Committed to delivering actionable intelligence, DataM Intelligence empowers businesses to make informed decisions and stay ahead of the competition. Through a combination of qualitative and quantitative research methods, it offers comprehensive reports that help clients navigate complex market landscapes, drive strategic growth, and seize new opportunities in an ever-evolving global market.
Get a Free Sample PDF Of This Report (Get Higher Priority for Corporate Email ID): https://datamintelligence.com/download-sample/gut-microbiota-supplement-market?sz
The Gut Microbiota Supplement Market refers to dietary products formulated with probiotics, prebiotics, postbiotics, and synbiotics designed to support and balance intestinal microorganisms. These supplements help improve digestion, immunity, metabolic health, and overall well-being, and are widely used in preventive healthcare, clinical nutrition, and functional food applications across diverse age groups.
Recent Key Developments of United States:
✅ December 2025: MICAREA launched a postbiotic product on December 9 with claims for monocyte and T-cell immune support, capitalizing on surging demand for approved gut-immune supplements.
✅ November 2025: Nutraceutical research highlighted Japan’s status as a market hotspot for gut microbiota innovations, with studies linking low BMI to reduced microbiota diversity and recommending pre/probiotic supplementation.
✅ October 2025: Immune health functional foods, including postbiotics, achieved record notifications with Japan’s Consumer Affairs Agency (CAA), totaling 14 Foods with Function Claims (FFCs) by early December under updated PRISMA guidelines.
Recent Key Developments of Europe:
✅ December 2025: The European supplements market analysis projected strong 2025 growth in probiotics and postbiotics, fueled by pharmacy networks and consumer focus on preventive digestive wellness in key markets like Germany and Italy.
✅ November 2025: Probiota 2025 conference emphasized breakthrough trends like microbiome individuality and next-gen biotics, boosting interest in precision gut health supplements across Europe.
✅ October 2025: Probiotic supplements sales in the EU reached USD 2,521.3 million, driven by post-pandemic gut health awareness and Lactobacillus strains dominating 35% of formulations for digestive applications.
List of the Key Players in the Gut Microbiota Supplement Market:
Nestlé S.A.
Chr. Hansen Holding A/S
Danone S.A.
Procter & Gamble Co.
Chr. Hansen Holding A/S
BioGaia AB
Yakult Honsha Co., Ltd.
Probi AB
DuPont Nutrition & Biosciences
Lallemand Inc.
Kerry Group plc
Speak to Our Analyst and Get Customization in the report as per your requirements: https://datamintelligence.com/customize/gut-microbiota-supplement-market?sz
This Report Covers:
✔ Go-to-market Strategy.
✔ Neutral perspective on the market performance.
✔Development trends, competitive landscape analysis, supply side analysis, demand side analysis, year-on-year growth, competitive benchmarking, vendor identification, and other significant analysis, as well as development status.
✔Customized regional/country reports as per request and country level analysis.
✔ Potential & niche segments and regions exhibiting promising growth covered.
✔ Analysis of Market Size (historical and forecast), Total Addressable Market (TAM), Serviceable Available Market (SAM), Serviceable Obtainable Market (SOM), Market Growth, Technological Trends, Market Share, Market Dynamics, Competitive Landscape and Major Players (Innovators, Start-ups, Laggard, and Pioneer).
Segments Covered in the Gut Microbiota Supplement Market:
By Ingredient: Lactobacillus, Bifidobacterium, Saccharomyces, Others.
By Class: Firmicutes, Bacteriodetes, Actenobacteria, Proteobacteria.
By Form: Tablets, Capsules, Powders.
By End-User: Infants & Children, Adults, Middle-Aged, Elderly.
By Distribution Channel: Supermarkets/Hypermarkets, Online Channel, Specialty Stores, Others.
Regional Analysis:
⇥ North America (U.S., Canada, Mexico)
⇥ Europe (U.K., Italy, Germany, Russia, France, Spain, The Netherlands and Rest of Europe)
⇥ Asia-Pacific (India, Japan, China, South Korea, Australia, Indonesia Rest of Asia Pacific)
⇥ South America (Colombia, Brazil, Argentina, Rest of South America)
⇥ Middle East & Africa (Saudi Arabia, U.A.E., South Africa, Rest of Middle East & Africa)
Buy Now & Get 30% OFF – Grab 50% OFF on 2+ reports: https://www.datamintelligence.com/buy-now-page?report=gut-microbiota-supplement-market
Chapter Outline
⏩ Market Overview: It contains five chapters, as well as information about the research scope, major manufacturers covered, market segments, Gut Microbiota Supplement market segments, study objectives, and years considered.
⏩ Market Landscape: The competition in the Global Gut Microbiota Supplement Market is evaluated here in terms of value, turnover, revenues, and market share by organization, as well as market rate, competitive landscape, and recent developments, transaction, growth, sale, and market shares of top companies.
⏩ Companies Profiles: The Global Gut Microbiota Supplement market’s leading players are studied based on sales, main products, gross profit margin, revenue, price, and growth production.
⏩ Market Outlook by Region: The report goes through gross margin, sales, income, supply, market share, CAGR, and market size by region in this segment. North America, Europe, Asia Pacific, Middle East & Africa, and South America are among the regions and countries studied in depth in this study.
⏩ Market Segments: It contains the deep research study which interprets how different end-user/application/type segments contribute to the Gut Microbiota Supplement Market.
⏩ Market Forecast: Production Side: In this part of the report, the authors have focused on production and production value forecast, key producers forecast, and production and production value forecast by type.
⏩ Research Findings: This section of the report showcases the findings and analysis of the report.
⏩ Conclusion: This portion of the report is the last section of the report where the conclusion of the research study is provided.
Unlock 360° Market Intelligence with DataM Subscription Services: https://www.datamintelligence.com/reports-subscription
People Also Ask:
◆ How big is the Gut Microbiota Supplement Market in 2025?
◆ What is the projected growth rate of the Gut Microbiota Supplement Market through 2033?
◆ Who are the key players in the Gut Microbiota Supplement Market?
◆ Which region is expected to dominate the industry during the forecast period?
Contact Us –
Company Name: DataM Intelligence
Contact Person: Sai Kiran
Email: Sai.k@datamintelligence.com
Phone: +1 877 441 4866
Website: https://www.datamintelligence.com
About Us –
DataM Intelligence is a Market Research and Consulting firm that provides end-to-end business solutions to organizations from Research to Consulting. We, at DataM Intelligence, leverage our top trademark trends, insights and developments to emancipate swift and astute solutions to clients like you. We encompass a multitude of syndicate reports and customized reports with a robust methodology.
Our research database features countless statistics and in-depth analyses across a wide range of 6300+ reports in 40+ domains creating business solutions for more than 200+ companies across 50+ countries; catering to the key business research needs that influence the growth trajectory of our vast clientele.
This release was published on openPR.
For women, a new year often comes with mixed emotions—hope, pressure, motivation, and fatigue. Between careers, families, changing hormones, and endless expectations, the idea of “starting fresh” can feel overwhelming. But the right way to kick-start 2026 isn’t about extreme diets or punishing workouts. It’s about building strength, balance, and resilience—on your own terms.
A woman’s body is constantly evolving—through life stages, hormonal shifts, stress, and recovery. Instead of forcing yourself into rigid routines, begin 2026 by tuning in.
What does my body need right now—more movement, more rest, or better nourishment? Progress begins with awareness.
This year, shift the focus from how your body looks to how it functions. Strength training, mobility work, and functional movement help women protect bone health, support metabolism, and improve confidence—especially as we age.
Strong isn’t a trend. It’s a foundation.

Women thrive on balanced nutrition—adequate protein, healthy fats, fiber, and hydration. Eating consciously supports hormones, energy levels, mood, and recovery.
Food is fuel, not punishment.
Whether you’re in your 20s, navigating postpartum recovery, managing perimenopause, or prioritizing longevity, your fitness approach should evolve with you.
Low-impact workouts, strength training, yoga, Pilates, and recovery days all play a role. There is no one-size-fits-all formula for women’s fitness.

Stress management is just as important as exercise. Chronic stress affects sleep, weight, hormones, and motivation. Build small rituals into your day—breathwork, journaling, mindful walks, or digital detox moments.
A calm mind supports a strong body.
Instead of strict resolutions, set milestones, that supports your well-being:
Intentions create consistency without burnout.

Fitness should add to your life, not take away from it. Choose workouts you enjoy, food that satisfies, and routines you can sustain. When joy is present, consistency follows naturally.
The right way for women to kick-start 2026 is by honoring their bodies, respecting their rhythms, and choosing health habits that last beyond January.
This year, let strength be gentle, discipline be flexible, and wellness be deeply personal.
Disclaimer
The Content is not intended to be a substitute for professional medical advice, diagnosis, or treatment. Always seek the advice of your physician or other qualified health provider with any questions you may have regarding a medical condition.
The 
 USDJPY exchange rate pulled back after the latest macro data from Japan. It was trading at 156.25, down from this month’s high of 157.83. It has also formed the risky double-top pattern, pointing to more downside in the coming days.
Weak Japanese data raises doubts for BoJ rate hikes
The USDJPY exchange rate was in a tight range after Japan published mixed macro data on Friday.
A report by the statistics agency showed that the unemployment rate remained at 2.6%, while the jobs/applications ratio was unchanged at 1.18.
Another report showed that the Tokyo headline Consumer Price Index (CPI) dropped from 2.7% in November to 2.0% this month.
The core consumer inflation, which excludes the volatile food and energy prices, moved from 2.8% to 2.3%, moving closer to the BoJ’s target of 2.0%.
More data showed that the country’s retail sales dropped from 1.6% in October to 0.6% in November, a sign that demand is falling.
At the same time, the country’s industrial production dropped to minus 2.6% in November after expanding by 1.6% in the previous month.
Therefore, there are signs that Japan’s economy is moderating, a move that may limit the central bank’s hawkish tone.
These numbers came a week after the BoJ delivered its final interest rate decision of the year. It hiked interest rates by 0.25% to a three-decade high of 0.75% and hinted that it will deliver more hikes in 2026 if the economic growth accelerates.
Traders still believe that the bank will deliver either one or two more hikes in 2026 if inflation continues rising because of the recently announced stimulus package.
Federal Reserve interest rate cuts in 2026
Meanwhile, the Federal Reserve delivered the third interest rate cut in its December meeting. It moved the benchmark rate to between 3.50% and 3.75%.
A Polymarket poll with over $1.2 million in assets, has more traders betting than the bank will deliver two cuts in 2026. 19% of the users expect the bank to cut rates three times, while 16% see four cuts.
The main reason to predict more cuts is that Donald Trump has pledged to appoint a Fed Chair who will be more comfortable delivering more cuts.
However, the new Fed Chair will face the challenge of convincing more officials to cut rates, especially now that the recent US GDP data showed that the economy was doing well. The report showed that the economy expanded by 4.3% in the third quarter, much higher than what analysts were expecting.
Fed officials have started to deviate from the Federal Reserve officials. For example, two officials voted for leaving interest rates unchanged in the last meeting, while one voted for a 0.50% cut.
USDJPY forecast: technical analysis
USDJPY chart by TradingView
The daily timeframe chart shows that the USDJPY exchange rate has pulled back in the past few days, moving from the year-to-date high of 157.83 to the current 156.28.
It has formed a double-top pattern whose neckline is at 154.42. Also, the Relative Strength Index and the Percentage Price Oscillator have formed a bearish divergence pattern.
Therefore, the pair will likely continue falling, with the next key support level to watch being the neckline at 154.42. More downside will be confirmed if it moves below the 50-day moving average at 154.60.
The Food Safety and Standards Authority of India (FSSAI) has issued a strong clarification regarding the use of the term “tea” on food packaging and labelling. According to the food regulator, only beverages made from the Camellia sinensis plant can legally be marketed as tea, effectively banning the use of the term for herbal or plant-based infusions not derived from this plant.
In a press release issued on Wednesday, FSSAI highlighted that traditional teas such as Kangra tea, green tea, and instant tea qualify under existing food safety standards. However, the term “tea” used for products like “Rooibos Tea,” “Herbal Tea,” or “Flower Tea,” which are not derived from Camellia sinensis, is misleading and amounts to misbranding under Indian law.
The regulator clarified, “As per standards specified under the Food Safety and Standards (Food Product Standards and Food Additives) Regulations, 2011, tea shall be exclusively from the plant Camellia sinensis.” It added that labeling rules mandate that every package clearly display the true nature of the food on the front.
gFSSAI’s stance is clear: using the word “tea” for any plant-based or herbal infusions not derived from Camellia sinensis is misleading and constitutes misbranding under the Food Safety and Standards Act, 2006. The body further clarified that such herbal or plant-based infusions would fall under other categories, such as proprietary foods or products covered under the Food Safety and Standards (Approval for Non-Specified Food and Food Ingredients) Regulations, 2017.
This directive applies to all Food Business Operators (FBOs), including e-commerce platforms, involved in manufacturing, packing, marketing, importing, and selling such products. FSSAI has instructed Commissioners of Food Safety across states and Union Territories, along with regional directors of the authority, to ensure strict enforcement of these rules. Businesses found in violation of these regulations will face legal action under the Food Safety and Standards Act, 2006, and related regulations.
The Global “Whey Protein Market” is expected to grow at a CAGR of 7.2% during the forecast period (2024-2031). Whey proteins are derived from whey during cheese production and are known for improving athletic performance. They are an alternative to milk for lactose-intolerant people.
Whey protein is a high-quality dairy-derived protein widely used in sports nutrition, functional foods, and dietary supplements due to its rich amino acid profile and fast absorption. It supports muscle growth, recovery, weight management, and overall health, making it popular among athletes, fitness enthusiasts, and health-conscious consumers. Whey protein is available in various forms, including concentrate, isolate, and hydrolysate, each offering different purity and digestion benefits. Rising awareness of active lifestyles, protein-rich diets, and preventive health is driving global demand. With advancements in processing technologies and flavored formulations, whey protein continues to be a key ingredient in modern nutrition and wellness products.
Get a Free Sample PDF Of This Report (Get Higher Priority for Corporate Email ID):- https://www.datamintelligence.com/download-sample/whey-protein-market?praveen
Japan: Recent Industry Developments
✅ In November 2025, Japanese nutrition companies launched high-quality whey protein products tailored for muscle health, aging populations, and clinical nutrition, emphasizing purity and safety standards.
✅ In October 2025, manufacturers in Japan introduced low-lactose and easily digestible whey protein formulations, supporting digestive comfort and broader consumer adoption.
✅ In September 2025, collaborations between Japanese food companies and research institutes focused on protein fortification and bioavailability, supporting innovation in functional nutrition.
✅ In August 2025, Japanese brands expanded single-serve and ready-to-drink whey protein formats, catering to busy urban lifestyles and on-the-go nutrition needs.
United States: Recent Industry Developments
✅ In November 2025, U.S. whey protein manufacturers launched high-purity whey protein isolates and hydrolysates targeting sports nutrition, clinical nutrition, and weight management applications. This strengthens the U.S. position in premium protein ingredients.
✅ In October 2025, U.S.-based nutrition companies expanded production of clean-label and grass-fed whey protein, responding to growing consumer demand for natural, minimally processed supplements.
✅ In September 2025, American brands introduced ready-to-mix and flavored whey protein formulations with improved solubility and digestibility, enhancing consumer convenience and product appeal.
✅ In August 2025, U.S. food and beverage manufacturers increased incorporation of whey protein into functional foods, including protein bars, beverages, and dairy alternatives, expanding market penetration.
Global: Recent Industry Developments
✅ In 2025, global demand for whey protein increased due to rising interest in sports nutrition, active lifestyles, and healthy aging across developed and emerging markets.
✅ In 2025, manufacturers worldwide introduced plant-enhanced and hybrid protein blends combining whey with functional ingredients, addressing diverse nutritional preferences.
✅ In 2024-2025, advancements in protein processing, filtration technologies, and flavor masking improved product quality, digestibility, and global adoption.
✅ In 2025, partnerships between dairy producers, nutrition brands, and food manufacturers strengthened global supply chains and innovation pipelines in the whey protein market.
Key Merges and Acquisitions(2025):
✅ Glanbia Nutritionals – strengthened its whey protein portfolio in 2025 by acquiring a specialty dairy protein manufacturer, expanding high-purity, fast-absorbing whey solutions for sports nutrition and clinical applications.
✅ Arla Foods Ingredients -expanded its functional whey protein offerings through the acquisition of an advanced filtration and processing technology company, enabling improved protein quality, solubility, and bioavailability.
✅ Global Sports Nutrition Consortium -pursued strategic acquisitions in 2025 targeting innovative whey protein startups focused on clean-label formulations, ready-to-drink protein beverages, and performance-driven nutrition to capture growing demand in the rapidly expanding global whey protein market.
Growth Drivers:
• Rising consumer focus on fitness, muscle building, weight management, and active lifestyles driving demand for whey protein products.
• Increasing adoption of high-protein diets and sports nutrition supplements among athletes and health-conscious individuals.
• Growing use of whey protein in functional foods, beverages, and clinical nutrition applications.
• Advancements in filtration, processing, and flavor technologies improving protein purity, digestibility, and taste.
• Expanding distribution through gyms, health stores, pharmacies, and e-commerce platforms, supporting broader consumer access globally.
Purchase this report before year-end and unlock an exclusive 30% discount
https://www.datamintelligence.com/buy-now-page?report=whey-protein-market?praveen
(Purchase 2 or more Reports and get 50% Discount)
Market Segmentation Analysis -Whey Protein
– By Type
Whey protein concentrate (WPC) dominates with nearly 45% share, driven by its cost-effectiveness, balanced protein content, and widespread use across sports nutrition and functional food products. Whey protein isolate (WPI) accounts for around 35%, supported by rising demand for high-protein, low-fat, and low-lactose formulations among fitness enthusiasts and health-conscious consumers. Whey protein hydrolysate (WPH) holds approximately 20%, benefiting from its fast absorption, easy digestibility, and growing adoption in clinical nutrition, infant formula, and premium sports recovery products.
– By Application
Sports and performance nutrition leads with about 40% share, fueled by increasing gym participation, endurance sports, and protein supplementation among athletes and active consumers. Functional foods and beverages account for nearly 30%, driven by incorporation of whey protein into ready-to-drink shakes, protein bars, bakery, and dairy-based products. Infant nutrition represents around 15%, supported by its high biological value and role in supporting growth and development. Clinical and medical nutrition holds approximately 10%, used for muscle wasting, elderly nutrition, and recovery diets, while other applications contribute the remaining 5%, including animal feed and specialized dietary formulations.
key players :
Agropur (Davisco Business Unit), Arla Foods, Fonterra Co-operative Group, Milk Specialties, Glanbia, Hilmar Cheese Company, Maple Island Inc., Foremost Farms, Valio Ltd, and DMK Group.
Key Highlights (3 Key Players) for Japan Craft Spirits :
– Agropur (Davisco Business Unit) generates strong revenue from whey protein ingredients, supplying high-quality whey protein isolates and concentrates for sports nutrition, clinical nutrition, and functional food applications, supported by advanced processing capabilities.
– Arla Foods drives significant revenue through its whey protein portfolio, offering functional and nutritional whey ingredients for infant nutrition, sports supplements, and food applications, leveraging cooperative milk sourcing and strong R&D expertise.
– Fonterra Co-operative Group secures substantial revenue from whey protein production, supplying premium whey protein concentrates and isolates for global nutrition, sports, and medical food markets through an extensive international distribution network.
– Milk Specialties records steady revenue from whey protein solutions, focusing on customized formulations for sports nutrition, weight management, and performance-focused dietary supplements.
– Glanbia generates robust revenue from whey protein ingredients and branded nutrition products, serving sports nutrition, lifestyle wellness, and clinical nutrition markets with science-backed formulations and global brand strength.
Speak to Our Analyst and Get Customization in the report as per your requirements
https://www.datamintelligence.com/customize/whey-protein-market?praveen
Regional Insights – Whey Protein Market
• North America holds the largest share of the global whey protein market, typically accounting for around 35-37% of total revenues. Growth is driven by strong demand from sports nutrition, functional foods, and dietary supplements, high health and fitness awareness, and well-established distribution through retail and e-commerce channels. The U.S. dominates regional consumption, with Canada contributing steadily.
• Europe represents a significant market, generally accounting for around 28-30% of global revenues. Expansion is supported by rising consumption of protein-enriched foods, increasing health-conscious populations, and strong dairy processing industries in Germany, the U.K., France, and the Netherlands.
• Asia-Pacific is the fastest-growing region, holding approximately 25-27% of the global share. Growth is fueled by rising disposable incomes, expanding fitness and wellness trends, increasing adoption of protein supplements, and growing dairy processing capacity in China, India, Japan, and Australia.
• South America accounts for around 5-6% of global revenues, driven by growing sports nutrition markets, rising awareness of protein intake, and expanding distribution in Brazil and Argentina.
• Middle East & Africa represent approximately 3-4% of the market, supported by increasing health awareness, expanding fitness culture, and growing availability of nutritional supplements in the UAE, Saudi Arabia, and South Africa.
Power your decisions with real-time competitor tracking, strategic forecasts, and global investment insights all in one place.
https://www.datamintelligence.com/reports-subscription?praveen
✅ Competitive Landscape
✅ Sustainability Impact Analysis
✅ KOL / Stakeholder Insights
✅ Unmet Needs & Positioning, Pricing & Market Access Snapshots
✅ Market Volatility & Emerging Risks Analysis
✅ Quarterly Industry Report Updated
✅ Live Market & Pricing Trends
✅ Import-Export Data Monitoring
Have a look at our Subscription Dashboard: https://www.youtube.com/watch?v=x5oEiqEqTWg
Company Name: DataM Intelligence
Contact Person: Sai Kiran
Email: Sai.k@datamintelligence.com
Phone: +1 877 441 4866
Website: https://www.datamintelligence.com
About Us –
DataM Intelligence is a Market Research and Consulting firm that provides end-to-end business solutions to organizations from Research to Consulting. We, at DataM Intelligence, leverage our top trademark trends, insights and developments to emancipate swift and astute solutions to clients like you. We encompass a multitude of syndicate reports and customized reports with a robust methodology.
Our research database features countless statistics and in-depth analyses across a wide range of 6300+ reports in 40+ domains creating business solutions for more than 200+ companies across 50+ countries; catering to the key business research needs that influence the growth trajectory of our vast clientele.
This release was published on openPR.
BNBUSD has maintained stability at $846.25, with zero change in the past day. As the market cap sits at a substantial $122.6 billion, investors are keen on whether Binance Coin can reach the $877.01 target predicted for the upcoming month. Let’s delve into the current price analysis and forecast potential.
BNBUSD is currently priced at $846.25, marking a stable position over the last 24 hours. The daily range spans from a low of $834.89 to a high of $849.66. Despite the calm, the coin remains significantly off its yearly high of $1376.64. The market sentiment appears cautious, with Meyka AI’s analysis confirming a relative volume of 0.84, suggesting subdued trading activity.
Looking at the technical indicators, the Relative Strength Index (RSI) reads 41.92, indicating neutrality but nearing an oversold territory. The MACD is at -25.21 with a histogram of 2.08, hinting at possible bullish momentum ahead. The ADX stands at 36.51, suggesting a strong trend, yet the Awesome Oscillator at -43.37 reflects current bearish undertones.
Forecasts project a monthly target of $877.01, while a quarterly outlook estimates $989.62. The long-term analysis sees BNB reaching $1,060.31 in five years, according to trend assessments. However, the one-year prediction at $654.31 reflects potential downturns, emphasizing the market’s volatility and the impact of broader economic factors.
Recent news indicates a stable outlook for BNB, with no drastic market-moving events. Despite slight declines reported by CoinDesk, BNB’s price has shown resilience. As Meyka AI notes, price forecasts rely heavily on macroeconomic shifts and regulatory developments, adding layers of complexity to the outlook feel.
In summary, BNBUSD’s immediate future hinges on the ability to maintain or exceed the $877.01 price target. While current technical indicators suggest a mixed sentiment, the potential for upward movement remains. Investors should remain mindful of market volatility and external factors that could influence cryptocurrency trends.
BNBUSD is predicted to reach $877.01 in the coming month, with a longer-term prediction of $989.62 in the next quarter. Forecasts can change due to macroeconomic shifts.
The RSI at 41.92 is close to oversold levels, suggesting potential for a price uptick if buying pressure increases. However, it currently indicates neutrality.
Technical indicators like MACD and ADX provide insights into market trends and momentum. They suggest mixed sentiment, but slight bullish signs could emerge.
Despite recent price stability, reports have noted minor declines. Current forecasts remain stable though, influenced by broader market dynamics and news.
For detailed BNBUSD trends and forecasts, check platforms like Meyka AI that provide AI-generated insights and real-time data analysis. BNBUSD
Disclaimer:
Cryptocurrency markets are highly volatile. This content is for informational purposes only.
The Forecast Prediction Model is provided for informational purposes only and should not be considered financial advice.
Meyka AI PTY LTD provides market data and sentiment analysis, not financial advice.
Always do your own research and consider consulting a licensed financial advisor before making investment decisions.