The main category of All News Articles.
You can use the search box below to find what you need.
[wd_asp id=1]
The main category of All News Articles.
You can use the search box below to find what you need.
[wd_asp id=1]
Solana has been on an absolute tear in 2025, not just in price action, but in real adoption. Whether you’re watching DeFi TVL, institutional interest, or network activity, the trend is the same: SOL isn’t moving quietly anymore.
And with every new development, investors are asking one increasingly popular question: What would happen to emerging tokens like Remittix (RTX) if Solana continues to gain value? Well, let’s see.
Comparison Table: Solana (SOL) vs. Remittix (RTX)
Feature / Metric – Solana (SOL) – Remittix (RTX)
Primary Focus – High-speed Layer-1 blockchain for DeFi, NFTs, and institutional settlement – Global remittance and cross-border payment utility
2025 Adoption Trend – Rapid surge across DeFi, fintech pilots, and institutional tokenization platforms – Fast-growing presale traction among retail investors seeking practical utility
Network Speed – Extremely fast: thousands of TPS; proven at scale Built on multi-chain support; aims for near-instant settlement via supported chains
Fees – Very low, often fractions of a cent – Designed for low-cost remittance transfer fees
Real-World Use Case – Infrastructure layer for builders, enterprises, and protocols – Direct user-facing payment and remittance functionality
Current Momentum – Institutional adoption + massive DeFi liquidity returning – Presale momentum + wallet beta + upcoming exchange listings
Security Status – Mature ecosystem with a strong validator base – CertiK audit published; no critical findings reported
Investment Appeal (2025) – Strong long-term infrastructure plays with growing institutional trust – High-upside early-stage utility token with strong presale fundamentals
Target Users – Developers, institutions, and advanced DeFi users – Remittance users, retail investors, and emerging-market crypto adopters
2026 Outlook – Continued institutional expansion, possible new all-time highs – Analysts project strong growth if utility scaling stays on track
Solana’s 2025 Momentum: The Adoption Wave Is Real
Solana’s comeback story is already one of crypto’s most impressive. But in 2025, it’s evolved beyond recovery; it’s now leading entire sectors.
1. DeFi Growth Has Gone Parabolic
Solana’s total value locked (TVL) has surged as liquidity migrates from older, slower ecosystems toward faster, cheaper networks. Also, smart contract deployments are up significantly (developer surveys, Q2 2025). Then, new DEXs and yield protocols have launched on Solana at a record pace. In fact, users aren’t just experimenting; they’re staying, which is a major shift compared to 2022-2023 cycles.
2. Institutional Platforms Are Quietly Integrating Solana
Perhaps you didn’t know; the biggest underrated story of the year is that traditional finance desks and payment processors are now exploring Solana rails for settlement and tokenization infrastructure. Pilot programs cited improved transaction throughput and predictable fee structures (institutional reports, mid-2025). Now, this may be the spark that pushes SOL into its next valuation band.
3. Price Predictions Become More Aggressive
Analysts now estimate SOL could test new highs if macro conditions stay stable and institutional adoption continues (market forecasts, 2025). But, and this is important, Solana’s success has a ripple effect on the altcoin market, especially for tokens positioned in payments and real-world utility. And that brings us directly to Remittix.
Where Does Remittix Fit Into This?
While Solana is gaining institutional attention, Remittix is attracting investor interest, especially among users seeking a practical, payments-first crypto https://remittix-organization.gitbook.io/remittix/vision/crypto-usage-for-cross-border-payments that solves real-world problems. RTX is not another chain competing with Solana; instead, it’s a network built around global remittance efficiency, a sector where Solana’s performance creates tailwinds rather than competition. Here’s what that dynamic looks like:
1. Solana’s Strength Makes Payment-Focused Tokens More Attractive
When the broader market sees high-speed blockchain infrastructure gaining traction, the entire payments category benefits. Investors tend to cluster around narratives, and in 2025, the narrative is simple: “Fast chains will power the next generation of global payments.”
Remittix https://remittix.io directly aligns with this outlook; its entire presale pitch centers on:
● Lower cross-border fees
● Instant settlement
● Global remittance accessibility
● A wallet built around multi-chain support; it’s live on the App Store https://x.com/remittix/status/1993280422973669757
So while Solana proves the performance model works, Remittix aims to bring that model to retail users at scale.
2. Investors Want Utility, Not Just Hype
This year has been a turning point. A significant portion of new investors are openly shifting away from meme coins and speculative hype (investor sentiment studies, 2025).
They’re choosing:
● Clear utility
● Clear roadmaps
● Clear revenue potential
● And Remittix is one of the few emerging tokens that checks all three boxes:
● CertiK audit completed https://x.com/remittix/status/1946099759996944871
● Presale passing $28.5M reported funding
● Exchanges like BitMart https://x.com/bitmartexchange/status/1956965042848694291 and LBank https://x.com/LBankUpdates/status/1961161431854059643 are listed as upcoming partners
These aren’t flashy promises; they’re tangible signals that the project is operational.
3. RTX Aligns With the “Payments Are the Next Big Cycle” Narrative
Analysts have been emphasizing one point repeatedly in 2025 (market commentary, 2025): “The next major crypto cycle won’t be about memes; it’ll be about settlement, payments, and transaction efficiency.”
Solana’s rising adoption reinforces this thesis. And Remittix builds directly on it. This positions RTX as a potential beneficiary of the entire payments-sector upswing driven by Solana’s breakout.
Final Outlook: The Solana Rally Sets the Stage, Remittix Captures the Spotlight
Many newcomers assume Solana and Remittix are “competitors,” but the reality is more nuanced:
● Solana is infrastructure: the high-speed base layer institutions and DeFi developers rely on.
● Remittix is an application-layer utility. It aims to simplify real-world remittances using multi-chain support.
As a result, their future paths complement each other rather than collide. If Solana continues scaling into the institutional world, it creates a rising-tide effect for payment tokens. And Remittix, with its low-friction remittance model, is positioned as one of the strongest presale-era beneficiaries.
Discover the future of PayFi with Remittix by checking out the project here:
Website: https://remittix.io/
Socials: https://linktr.ee/remittix
$250,000 Giveaway: https://gleam.io/competitions/nz84L-250000-remittix-giveaway
FAQ: Solana & Remittix – What Investors Are Asking Right Now
1. Is Solana’s growth in 2025 hurting or helping Remittix?
Interestingly, it helps. Solana’s institutional adoption strengthens the broader payments narrative. That rising momentum draws more attention to utility tokens like Remittix, which operate at the application layer rather than competing at the base layer.
2. Why are analysts calling Remittix one of the strongest 2025-2026 presale tokens?
Because it ticks all the boxes investors currently care about:
● Active presale momentum
● Over $28.5M reported raised
● CertiK audit completed
● Its wallet is live
● Clear global remittance utility
● Exchange listings already announced (BitMart, LBank)
In a market shifting toward real-world use cases, RTX aligns perfectly with the directional trend.
3. Does Remittix compete directly with Solana?
No, they serve different functions. Solana is infrastructure. Remittix is a payments-layer solution. In fact, RTX can benefit from the scalability of chains like Solana as it expands multi-chain functionality.
4. Can Remittix realistically see major growth compared to a giant like Solana?
Yes, but in a different way. Solana’s growth is steady and institutional. Remittix’s growth potential is more explosive because it’s still in presale and early adoption phases. Early-stage tokens don’t need billions in inflow to move dramatically.
5. How do market conditions impact the outlook for RTX in 2026?
If the payment-narrative cycle continues and institutional capital stays interested in fast-settlement ecosystems, Remittix could become a major beneficiary. Its utility-first model positions it to grow during periods where investors favor real use cases over hype.
Disclaimer: This article is for informational purposes only and does not constitute financial advice. Cryptocurrency investments carry risk, including total loss of capital. Readers should conduct independent research and consult licensed advisors before making any financial decisions.
Crypto Press Release Distribution by https://btcpresswire.com
This release was published on openPR.
Yes. Atmospheric G2 projects widespread warmth across the western, central, and southern U.S. between December 17–26. That shift has quickly unwound last week’s rally to a nearly three-year high. Lower-48 gas demand on Friday was estimated at 110.6 bcf/day, down 3.4% year-over-year, showing the direct impact of weaker weather-driven consumption.
Strongly. U.S. dry gas production hit 112.5 bcf/day on Friday, up 7.1% from a year ago, according to BNEF. The EIA also raised its 2025 production forecast to 107.74 bcf/day. While the active rig count slipped by 2 to 127, it remains just below a 2.25-year high. Robust supply in the face of weak demand continues to pressure prices lower.
Limited. The EIA reported a -177 bcf draw for the week ending December 5—larger than both consensus and the five-year average—but inventories remain 2.8% above seasonal norms and flat year-over-year. European storage sits at 71% capacity, well below its five-year average of 81%, but LNG flows to U.S. terminals fell 3% week-over-week to 18.1 bcf/day.
Bearish. With warmer forecasts extending through late December and long liquidation still in play, sellers remain in control. While some technical indicators may be signaling oversold conditions—raising the risk of a short-covering rally—any bounce must be evaluated carefully.
Traders need to distinguish between technical retracements and rallies tied to a meaningful bullish shift in the weather outlook. Continued guessing will be punished, as fundamentals will ultimately prevail. Unless forecasts turn colder or prices find firm support near $3.913, the downside bias remains intact.
More Information in our Economic Calendar.
I wrote on the 7th December that the best trades for the week would be:
Overall, these trades gave a gain of 1.36% per asset.
A summary of last week’s most important data:
Last week’s data had a marginal impact, with the most important market outcome likely to be a continued strengthening of the Swiss Franc, which has been quietly gaining and gaining. This is a currency with a positive real rate of interest which is being allowed by its central bank to steadily strengthen. It is extremely attractive as a safe haven currency, with the Swiss National Bank’s machinations in 2015 mostly forgotten.
The other major impact was the Fed’s hawkish rate cut, with markets now pricing in only a single rate cut of 0.25% in both 2026 and 2027, even though President Trump will be appointing a new Fed Chair in May 2026 and he wants a Chair who will support aggressive rate cuts. However, Trump has now indicated that Kevin Warsh is currently favourite for the position, and he leans towards a hawkish approach.
Most stock markets ended the week slightly lower. It was generally a week of little change in the financial markets, except precious metals, which look increasingly bullish.
The US Dollar had a bearish week, breaking down below key support and invalidating its former long-term bullish trend which had recently begun.

The coming week is the last full week of open markets before the Christmas holiday gets underway. This might mean a more active market than usual, because the week is full of important central bank policy meetings (including two widely expected rate cuts) and inflation data.
We are likely to see an increase in volatility this week.
This week’s most important data points, in order of likely importance, are:
Currency Price Changes and Interest Rates
For the month of December 2025, I made no forecast.
Last week, I made no forecast, as there were no recent excessive moves in currency crosses.
The Euro was the strongest major currency last week, while the Japanese Yen was the weakest. Directional volatility fell again last week, with only 19% of all major pairs and crosses changing in value by more than 1%.
Next week’s volatility could be large as there will be three major central bank policy meetings plus key inflation data.
You can trade these forecasts in a real or demo Forex brokerage account.
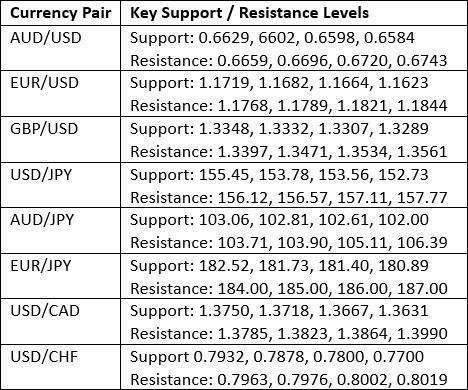
Key Support and Resistance Levels
Last week, the US Dollar Index printed another bearish candlestick with only a minor lower wick. The price is still above its level of 13 weeks ago, but below its level of 26 weeks ago, so by my preferred metric, I declare the long-term bullish trend has failed. The price has also broken below a cluster of key support levels which had held for a long time, which I see as a very bearish sign for the greenback.
The Fed is cut its interest rate last week by 0.25% as was widely expected. However, the outlook for further rate cuts over the coming two years looks very slight. It is interesting that the market is shaking that off, which would normally put a bid into the Dollar, and continuing to sell it – that is a bearish sign.
I think being short of the US Dollar will be a generally good approach now, so over the coming week I will look for trades which fit that bias.
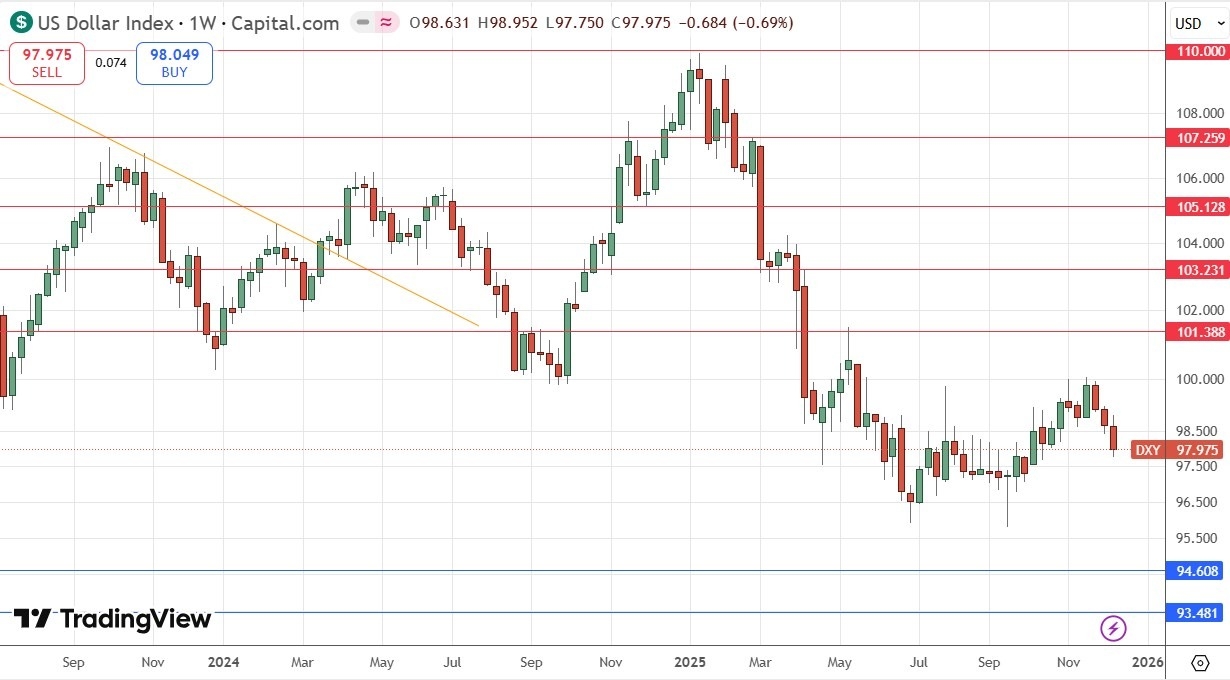
US Dollar Index Weekly Price Chart
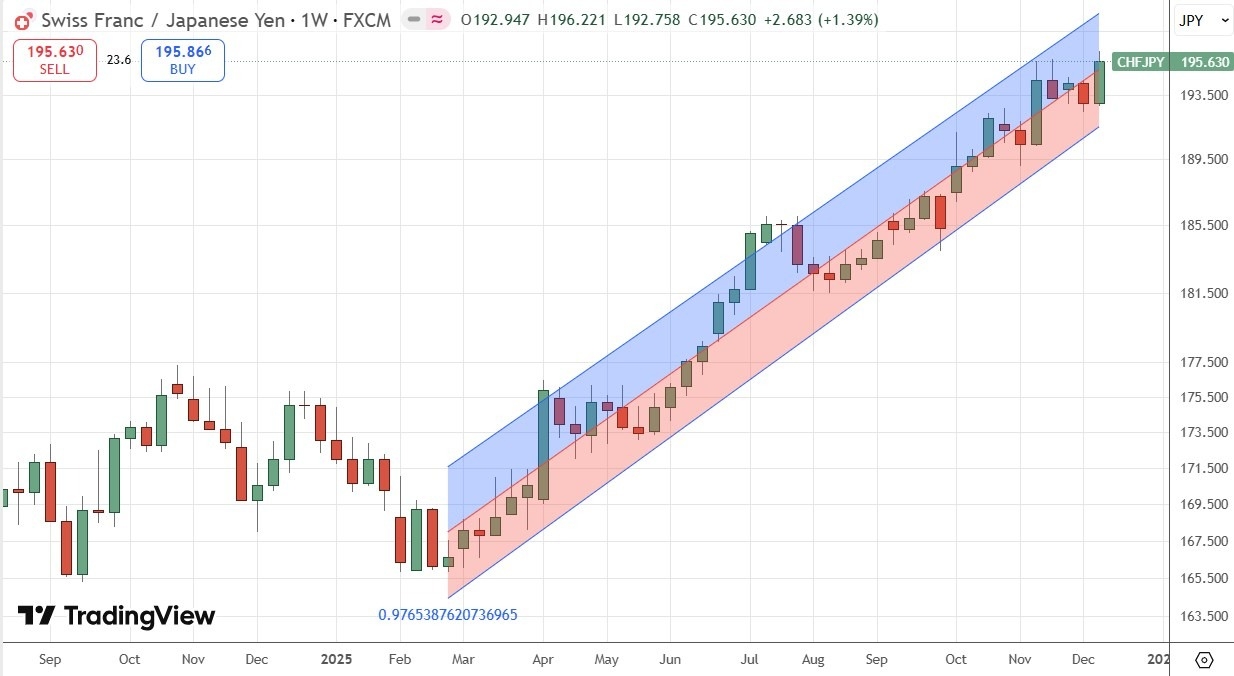
The CHF/JPY currency cross weekly chart printed a powerful bullish candlestick that reached an all-time high price. This alone is a notably bullish sign but just look at the orderly ascending trend we have seen here since March this year, shown by the linear regression price channel study in the price chart below.
I usually ignore trends in currency crosses, but this is a powerful one. There are also good fundamental reasons why the Swiss Franc has been the strongest major currency over the long term, and the Japanese Yen has been the weakest.
The Swiss Franc has a zero interest rate but deflation, so the currency is naturally appreciating, while the Japanese Yen has been declining for a long time due to an ultra-loose monetary policy. However, that might change for the Yen soon, as the Bank of Japan is expected to hike rates this week, and might even begin a more aggressive and continuous round of hikes in 2026.
I will not be going long here myself, but it is something other trades might want to investigate and consider.
CHF/JPY Weekly Price Chart
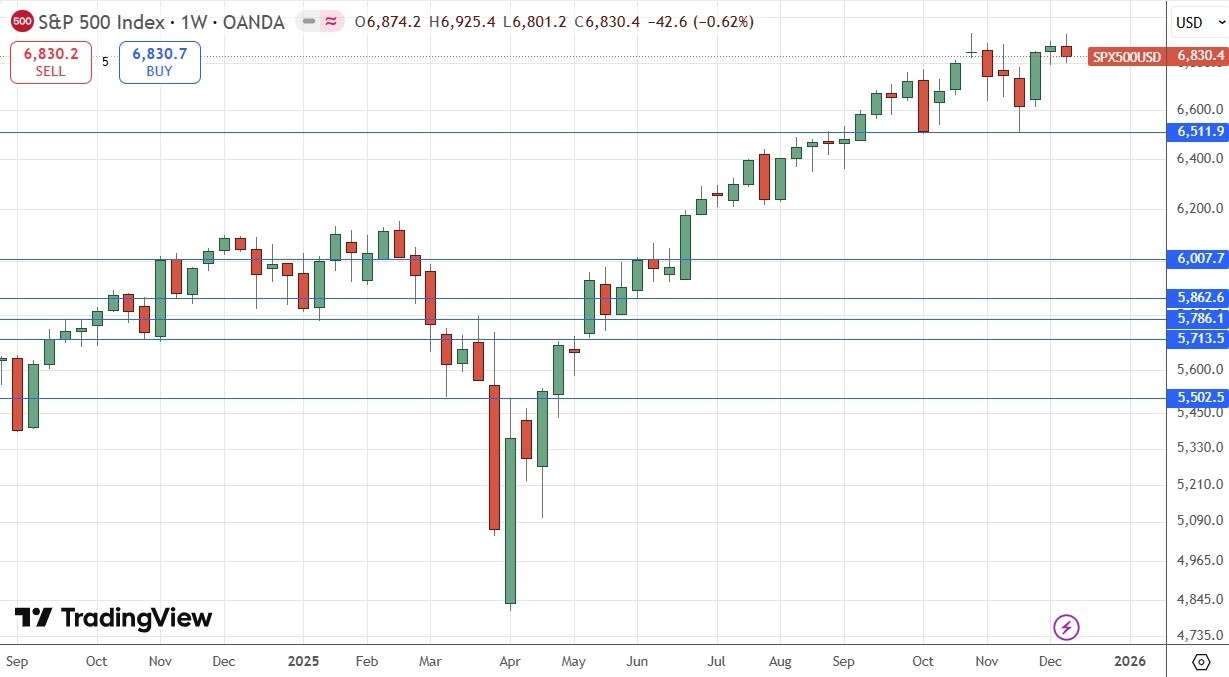
The weekly price chart below shows that this major US stock index fell last week, after coming very close to breaking its record high just a few weeks ago. It closed at a record high closing price on Thursday, and then opened high on Friday and then fell sharply to print a bearish near pin-bar candlestick.
This is a bearish sign, which could well be dangerous to act upon. I am not advocating going short, but bulls should be worried, although it is clearly still a bull market.
I wrote a week or two ago that I was becoming more convinced that we have already seen a medium-term high in this stock market index, and this confirms my opinion. I think we are seeing a topping out which is likely to start some kind of retracement.
The Fed seems less and likely to make significant rate cuts in the foreseeable future, and there are strong and realistic concerns about an AI bubble and a general over-valuation of the stock market, so a bearish retracement cannot be a big surprise if it happens.
However, if we get a daily close with no significant upper wick on that day’s candle above the record high at 6,930, I will enter a new long trade.
S&P 500 Index Weekly Price Chart
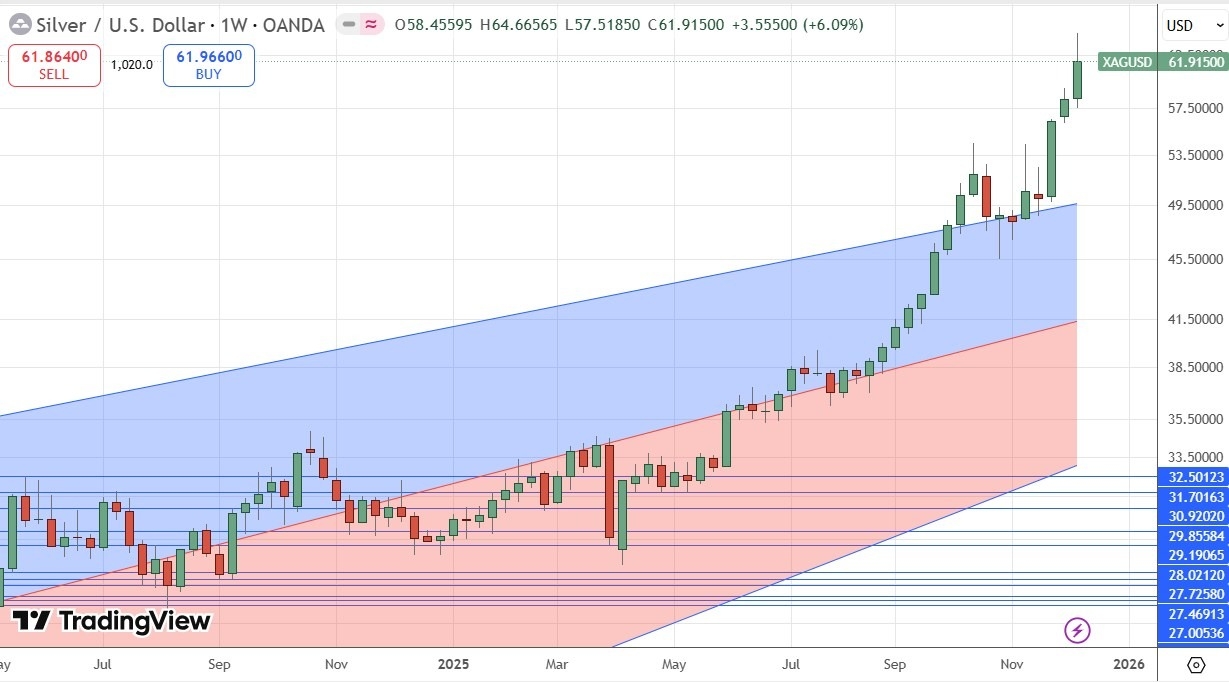
A few weeks / months ago, Silver was in a strong bullish trend which saw the price increase by about 50% in only two months. The rise peaked in October and saw quite a strong retracement, which is usually a sign that the price is not going to make new highs soon. This bearish outlook was reinforced by what seemed to be a bearish double top formed just four weeks ago. However, the price has come up again and then made a very strong bullish breakout with an unusually large move.
We saw a further gain last week as the bullish momentum continued. Volatility is high and the moves can be messy but it’s a bullish breakout that continues to advance.
Another bullish factor is that all the major precious metals rose in value last week, although there is no doubt the Silver is leading the way.
Due to the high volatility and “second bite” breakout, as well as the significant upper wick on the weekly candlestick, I think a half-sized long position is best here, and only after we see a new record high daily close at or above $63.57.
Silver Weekly Price Chart
All precious metals have been rising as an asset class, partly fueled by Fed policies and the declining Dollar, partly due to safe haven inflow.
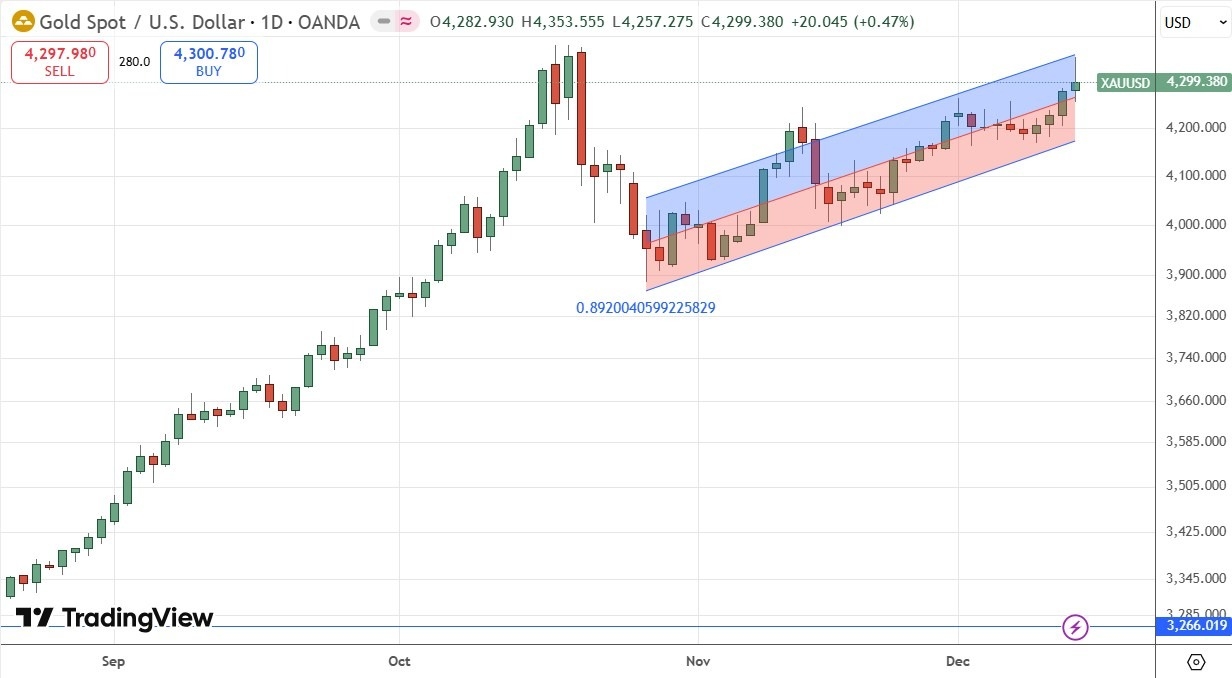
Silver has clearly been leading the way, but this past week has seen Gold start to catch up with a minor bullish breakout beyond the $4,270 area.
The record high above $4,300 is now in sight, but Gold formed a pin bar on Friday which puts some doubt into whether it will retest or even exceed its record high which it made in October.
I will keep a close eye on Gold and enter a new long trade if we get a daily close above the record high, at or above $4,355.80.
If this long trade sets up, as the progress upwards has been steadier and more orderly than what we have seen in Silver, you might keep a normal position size. I will prefer to use half my normal position size.
Gold Weekly Price Chart
I see the best trades this week as:
Ready to trade our weekly Forex forecast? Check out our compilation of the top 100 Forex brokers in the world.
Bitcoin’s price recently dipped to $90,031.18, dropping by 2.73% as it eyes potential trends. Could technical analysis indicate a bounce back?
Bitcoin is priced at $90,031.18, down by 2.73% today, with a market cap at $1.78 trillion. The recent decline reflects a $2,525.55 drop from its previous close of $92,542. This position places BTC near its 50-day moving average of $97,798.05 but still below the 200-day average of $108,854.57, suggesting potential bear market pressure.
The Relative Strength Index (RSI) rates Bitcoin at 42.45, indicating a weakening trend but not yet into oversold territory. The Moving Average Convergence Divergence (MACD) shows a bearish signal with -2662.60 against the signal line -3574.02, but a positive histogram at 911.42 suggests potential bullish divergence.
Volatility indicators like the Average True Range (ATR) suggest increased volatility at 4276.16, whereas Bollinger Bands show an upper limit at $95,085.28 and a lower limit at $85,614.32. Momentum indicators such as the Awesome Oscillator at -4671.58 signal continued negative pressure, but potentially decreasing.
Meyka AI projects a monthly target for BTCUSD at $94,393.67 and a quarterly outlook at $136,189.95. However, the yearly forecast suggests a potential decline to $89,387.24. These predictions may evolve with macroeconomic changes, regulations, or other unexpected market events.
While BTCUSD currently hovers around $90,031.18, its technical and volatility indicators provide a mixed outlook. Traders should stay updated with forecasts and market changes as Bitcoin navigates its next movements. For more details, explore the full analysis on BTCUSD.
Bitcoin is currently priced at $90,031.18, reflecting a daily decrease of 2.73% ($2,525.55). This positions it well below its 50-day moving average of $97,798.05.
The RSI stands at 42.45, potentially indicating slight weakening. The MACD shows a bearish trend, yet the histogram suggests a possible positive shift.
The ATR for Bitcoin is at 4276.16, indicating heightened volatility. The wide span between the high and low Bollinger Bands further highlights this variance.
Meyka AI foresees Bitcoin reaching $94,393.67 in the coming month, with a quarterly target of $136,189.95. However, the yearly forecast predicts a dip to $89,387.24.
Forecasts can change due to macroeconomic shifts, regulatory changes, or unexpected events affecting the crypto market, which could influence Bitcoin’s trajectory.
Disclaimer:
Cryptocurrency markets are highly volatile. This content is for informational purposes only.
The Forecast Prediction Model is provided for informational purposes only and should not be considered financial advice.
Meyka AI PTY LTD provides market data and sentiment analysis, not financial advice.
Always do your own research and consider consulting a licensed financial advisor before making investment decisions.
The most notable development last week was the move in U.S. Treasurys. The 10-year yield rallied to 4.186%, its highest level since September 2025, closing up 0.047 on the week.
That rise would typically act as a headwind for bullion, and it likely contributed to gold pausing just below last week’s peak. Traders noted that the Fed’s divided vote on its third consecutive rate cut raised questions about the pace of easing in 2026, and the market responded by pushing yields higher rather than lower.
With the 10-year sitting just off multi-month highs, any further firming this week could temporarily slow gold’s upside attempts.
Despite the rise in yields, the U.S. dollar moved in the opposite direction, slipping to multi-month lows and offering consistent support for gold. The disconnect between stronger yields and a weaker dollar gave traders a unique setup: gold faced pressure from the bond market but continued to attract demand from overseas buyers taking advantage of favorable currency conditions.
As long as the dollar stays soft, gold retains a tailwind even in the face of elevated Treasury yields.
This week’s data will shape how traders interpret the Fed’s next steps. Payrolls are expected to show flat hiring in October and a modest 50,000 increase in November, with unemployment edging up to 4.5%.
BitcoinWorld
Cardano Price Prediction 2025-2030: Will ADA’s Remarkable Journey Reach $2?
As the cryptocurrency market continues to evolve, one question dominates the minds of investors and enthusiasts alike: what does the future hold for Cardano’s ADA? With its unique scientific approach and growing ecosystem, Cardano has positioned itself as more than just another cryptocurrency. This comprehensive analysis dives deep into Cardano price predictions from 2025 through 2030, examining whether ADA can realistically reach the coveted $2 milestone. We’ll explore technical developments, market trends, and expert opinions to give you a clear picture of what to expect in the coming years.
Before we dive into specific Cardano price predictions, it’s crucial to understand where ADA stands today. Cardano, founded by Charles Hoskinson, has established itself as a third-generation blockchain platform with a research-driven approach. Unlike many cryptocurrencies that prioritize speed over security, Cardano has taken a methodical path, focusing on peer-reviewed research and formal verification.
The current ADA price reflects both the platform’s achievements and its challenges. As of our latest analysis, ADA trades within a range that suggests cautious optimism from investors. Several factors influence this positioning:
Looking toward 2025, our Cardano price prediction considers several key factors. By this time, Cardano’s ecosystem should be more mature, with numerous dApps fully operational and user adoption increasing significantly. Most analysts agree that 2025 could be a pivotal year for ADA’s price trajectory.
Based on current growth patterns and planned developments, here’s what we might expect for ADA price in 2025:
| Scenario | Price Range | Probability |
|---|---|---|
| Conservative | $0.80 – $1.20 | 40% |
| Moderate | $1.20 – $1.80 | 45% |
| Bullish | $1.80 – $2.50 | 15% |
The key to reaching the higher end of these predictions lies in successful implementation of Cardano’s roadmap, particularly the Basho phase focusing on scaling and the Voltaire phase introducing governance. If these developments proceed smoothly and adoption accelerates, our ADA future looks promising for 2025.
This is the million-dollar question for many investors. Based on our analysis, ADA reaching $2 by 2026 is certainly within the realm of possibility, though not guaranteed. Several factors will determine whether this milestone becomes reality:
Our cryptocurrency forecast suggests that if Cardano continues its current trajectory of development and adoption, the $2 mark could be tested by late 2026. However, investors should remain aware that cryptocurrency markets are inherently volatile, and predictions should be taken as educated estimates rather than guarantees.
Looking beyond 2026, our Cardano price prediction extends to 2030. Long-term forecasts become increasingly speculative, but they help us understand potential trajectories based on current trends and planned developments.
For the period 2027-2030, several scenarios could unfold:
These Cardano 2025 through 2030 projections depend heavily on the platform’s ability to execute its vision. The transition to a fully decentralized governance model through Voltaire will be particularly crucial for long-term success.
To make an accurate Cardano price prediction, we must consider the fundamental factors that will drive ADA’s value in the coming years. These elements provide the foundation for any meaningful cryptocurrency forecast.
Technical Developments: Cardano’s roadmap includes several critical upgrades. The successful implementation of Hydra scaling solutions could dramatically increase transaction throughput, making Cardano more competitive with other smart contract platforms. Additionally, improvements to Plutus smart contracts and the development of partner chains could expand Cardano’s capabilities.
Ecosystem Growth: The number of projects building on Cardano continues to increase. From decentralized exchanges to lending protocols and NFT marketplaces, a vibrant ecosystem is essential for long-term ADA price appreciation. Projects like SundaeSwap and Minswap represent early successes in this area.
Market Adoption: Real-world usage drives cryptocurrency value. Cardano’s partnerships in developing countries for identity solutions and financial inclusion could create substantial demand for ADA. Additionally, institutional adoption through products like Grayscale’s Cardano Trust contributes to price stability and growth.
Competitive Landscape: Cardano doesn’t exist in a vacuum. Its ADA future depends partly on how it competes with platforms like Ethereum, Solana, and Polkadot. Each has strengths and weaknesses that will influence market share in the smart contract platform space.
While our Cardano price prediction generally leans positive, investors must understand the risks. No cryptocurrency forecast is complete without considering potential challenges that could impact ADA price.
The primary risks include:
Successful investors balance optimism about Cardano’s potential with realistic assessment of these challenges. This balanced approach is crucial when considering any cryptocurrency forecast, especially long-term predictions like our Cardano 2025 through 2030 analysis.
Various analysts and organizations have published their own Cardano price predictions. While these vary widely, they provide additional perspectives on ADA’s potential future.
Notable predictions include:
It’s worth noting that even experts with impressive track records can be wrong about cryptocurrency forecasts. The market’s complexity and sensitivity to unexpected events make precise predictions challenging. Our Cardano price prediction synthesizes these expert views with fundamental analysis to provide a balanced perspective.
Based on our comprehensive Cardano price prediction analysis, here are actionable insights for those considering ADA investment:
Remember that any cryptocurrency forecast, including our Cardano price prediction, should inform rather than dictate investment decisions. Your personal financial situation, risk tolerance, and investment goals should always take precedence.
What is Cardano and who created it?
Cardano is a third-generation blockchain platform founded by Charles Hoskinson, who also co-founded Ethereum. It takes a research-driven approach to blockchain development.
How does Cardano differ from other cryptocurrencies?
Cardano emphasizes peer-reviewed research, formal verification, and a methodical development process. Its layered architecture separates settlement and computation functions for greater flexibility and security.
What factors most influence ADA price?
Key factors include network upgrades, ecosystem growth, overall cryptocurrency market trends, regulatory developments, and adoption by institutions and users.
Is Cardano a good long-term investment?
Based on our Cardano price prediction analysis, ADA shows potential for long-term growth, particularly if the platform successfully executes its roadmap and achieves widespread adoption. However, like all cryptocurrencies, it carries significant risk.
Where can I buy and store ADA safely?
ADA is available on major exchanges including Binance, Coinbase, and Kraken. For storage, consider hardware wallets like Ledger or Trezor for maximum security.
Our comprehensive Cardano price prediction from 2025 through 2030 reveals a cryptocurrency with significant potential but facing substantial challenges. The question of whether ADA price will hit $2 appears increasingly plausible, particularly in our 2026 projections, though not guaranteed. Cardano’s unique approach to blockchain development, combined with its growing ecosystem, positions it favorably for the coming years.
The ultimate realization of our Cardano price prediction depends on successful execution of the platform’s technical roadmap, growing adoption across various sectors, and favorable market conditions. While the $2 milestone represents an important psychological barrier, the true measure of Cardano’s success will be its utility and adoption rather than price alone.
As with any investment, particularly in the volatile cryptocurrency space, careful research and risk management remain essential. Our analysis provides a framework for understanding Cardano’s potential trajectory, but market dynamics can change rapidly. Stay informed, diversify appropriately, and invest according to your personal financial strategy.
To learn more about the latest cryptocurrency markets trends, explore our articles on key developments shaping blockchain technology and digital asset adoption across global financial systems.
This post Cardano Price Prediction 2025-2030: Will ADA’s Remarkable Journey Reach $2? first appeared on BitcoinWorld.
Silver prices surged above $60 and hit a record $64.64 this week, powered by Fed cuts, a global supply squeeze, and booming industrial demand. Here’s the latest news, key drivers, and a 2026 forecast outlook for silver (XAG/USD).
Published: Dec. 14, 2025
Silver just delivered one of the most dramatic weeks in modern precious-metals trading: a clean break above $60/oz, a sprint to fresh all-time highs near $64–$65, and then a sharp, late-week pullback as traders took profits into the weekend.
From December 8 to December 14, 2025, the story of silver prices has been equal parts macro (a Federal Reserve rate cut and a softer U.S. dollar), micro (tight physical availability and inventory shifts), and structural (multi‑year supply deficits colliding with relentless industrial demand—from solar and EVs to the accelerating build-out of AI infrastructure). [1]
Below is a detailed recap of the week’s key developments, the most-cited forecasts and analyst views published in the Dec. 8–14 window, and the price levels investors are watching next.
Monday, Dec. 8: Silver started the week softer as markets waited for the Fed. Spot silver was reported around $57.98/oz, after having hit $59.32 the prior Friday. [2]
Tuesday, Dec. 9: The psychological barrier broke. Spot silver jumped above $60 and printed a new all-time high around $60.74/oz, with Reuters citing “supply constraints” and strong multi‑year demand expectations. [3]
Wednesday, Dec. 10: After the Fed’s decision, the rally extended. Reuters reported silver hitting a new record near $61.85/oz, with prices up roughly 113% year-to-date at that point and supported by industrial demand, falling inventories, and silver’s U.S. “critical mineral” designation. [4]
Thursday, Dec. 11: Momentum accelerated. Reuters reported spot silver up near $64.22/oz, hovering close to a record high around $64.31/oz, as the U.S. dollar weakened and investors digested the Fed’s cut and outlook. [5]
Friday, Dec. 12: A blow-off top — and a reality check. Reuters reported silver hitting an all-time high of $64.64/oz, then falling nearly 3% to about $61.7/oz as profit-taking set in. Reuters also noted silver was up nearly 5% on the week and up about 112% in 2025. [6]
Weekend, Dec. 13–14: With major markets closed, analysis shifted to sustainability and local-market spillovers. In India, The Economic Times reported MCX silver futures crossed Rs 2,00,000, with the March contract touching Rs 2,01,615 on Dec. 12, before a correction—underscoring how global dollar moves and domestic currency dynamics can amplify volatility. [7]
For a futures-market snapshot, Investing.com’s silver futures historical data shows a sharp climb into the week’s peak and a lower close into Friday (Dec. 12). [8]
The week’s biggest macro catalyst was the Federal Reserve’s quarter‑point rate cut and the market’s attempt to interpret what comes next.
Reuters coverage across the week emphasized that lower rates tend to favor non‑yielding precious metals, and that the U.S. dollar’s decline helped support silver’s rally as the metal became cheaper for non‑U.S. buyers. [9]
But the tone wasn’t purely “dovish.” Reuters also highlighted policy uncertainty and internal division, a reminder that silver can react violently if rate expectations reprice. [10]
Why it matters for silver: Unlike gold, silver is both a monetary and an industrial asset. When easing financial conditions coincide with strong manufacturing and electrification demand, silver often behaves like a “high-beta” precious metal—moving more than gold in both directions. [11]
A critical theme running through Dec. 8–14 commentary: the physical market looks tight, even when headline inventories appear large.
The takeaway: Silver’s rally isn’t only a paper-market story. When participants worry about the ability to source deliverable metal—or fear import frictions—prices can overshoot quickly.
Silver’s “dual-use” identity is front and center in this rally.
Reuters reported that the Silver Institute expects industrial demand to be driven higher through 2030 by sectors including solar energy, EVs and their infrastructure, and data centers and artificial intelligence. [14]
Business Insider amplified the AI angle, arguing silver has become increasingly tied to the AI infrastructure build-out (data centers, advanced chips, and next‑gen electronics), citing commentary from strategists and industry research. [15]
Why the market cares right now: When investors believe demand is “structural” (not just cyclical), they often pay up for scarce materials—and silver’s supply pipeline is notoriously difficult to ramp quickly. [16]
Several widely shared notes this week described a market dynamic where silver is no longer simply “following gold”—it is increasingly leading.
Reuters quoted analysts noting speculative flows into silver as a “more levered play” within the precious-metals complex. [17]
ING also pointed to renewed investor interest and a sharply lower gold/silver ratio (a sign of silver outperformance). [18]
That’s a powerful cocktail: strong fundamentals + macro tailwinds + momentum traders.
It is also why pullbacks can be sharp.
This week’s forecasts largely converge on one message: the long-term setup is constructive, but near-term volatility risk is rising.
By Friday, as silver fell from the highs, Reuters cited a CMZ note saying the move had become “excessive,” calling for caution even while maintaining a positive longer-term view tied to industrial demand. [19]
Technical analysts echoed that. FXStreet’s Dec. 12 coverage described silver as overbought, highlighting RSI readings and warning signals that often show up near short-term peaks. [20]
Monex (publishing an excerpt from CPM Group’s advisory) similarly said the medium-term view remains constructive, but flagged the possibility of a pause and retracement after a very fast move. [21]
Among the clearest longer-horizon calls in the Dec. 8–14 window:
Other outlets framed the same outlook with different emphasis:
Even long-term fundamental stories trade through short-term levels. For the week ending Dec. 14, technical coverage repeatedly highlighted a few zones:
Interpretation: The market just proved it can trade above $60. The next question is whether it can hold above $60 after the first major profit-taking wave.
Even the most bullish outlooks published this week carried explicit warnings. The key risks highlighted across Dec. 8–14 analysis include:
Reuters repeatedly pointed to upcoming U.S. data—including the non‑farm payrolls report due Dec. 16—as a near-term catalyst for rate expectations. If the dollar rebounds and real yields rise, silver can give back gains quickly. [32]
ING’s analysis warned the primary risk is industrial: a sharper global slowdown (electronics/manufacturing) could cool silver’s momentum. It also noted higher prices can eventually trigger demand destruction. [33]
Tariff fear can tighten markets, but any policy clarity that reduces friction can also unwind squeezes. FT and ING both described how policy uncertainty has influenced physical flows and inventory positioning. [34]
ING calls silver “gold on steroids”—it tends to move more than gold in percentage terms. That’s great in a melt-up and painful in a drawdown. [35]
With the Fed decision behind the market and the weekend pause in trading, attention shifts to:
Between Dec. 8 and Dec. 14, 2025, silver’s breakout above $60 and sprint to $64.64 crystallized a new market reality: silver is no longer trading as a sleepy cousin of gold. It’s trading as a strategically important industrial metal and a macro-sensitive monetary asset—meaning it can rally explosively when the dollar weakens and physical tightness meets a surge in demand narratives. [41]
But the same ingredients that powered the move—momentum, positioning, and tightness—also raise the odds of sharp retracements. Most Dec. 8–14 forecasts converge on a balanced view: well-supported longer-term fundamentals, with elevated near-term volatility. [42]
Note: This article is for informational purposes and does not constitute investment advice.
1. www.reuters.com, 2. www.reuters.com, 3. www.reuters.com, 4. www.reuters.com, 5. www.reuters.com, 6. www.reuters.com, 7. m.economictimes.com, 8. www.investing.com, 9. www.reuters.com, 10. www.reuters.com, 11. think.ing.com, 12. www.ft.com, 13. think.ing.com, 14. www.reuters.com, 15. www.businessinsider.com, 16. think.ing.com, 17. www.reuters.com, 18. think.ing.com, 19. www.reuters.com, 20. www.fxstreet.com, 21. www.monex.com, 22. think.ing.com, 23. www.ft.com, 24. www.marketwatch.com, 25. m.economictimes.com, 26. www.fxstreet.com, 27. www.fxstreet.com, 28. www.fxstreet.com, 29. www.fxstreet.com, 30. www.fxstreet.com, 31. www.fxstreet.com, 32. www.reuters.com, 33. think.ing.com, 34. www.ft.com, 35. think.ing.com, 36. www.reuters.com, 37. www.reuters.com, 38. think.ing.com, 39. www.reuters.com, 40. m.economictimes.com, 41. www.reuters.com, 42. www.reuters.com
In the ever-volatile world of cryptocurrency, GameFi is emerging as a beacon of resilience and excitement. Despite broader market pressures, the sector has surged from 15th to second place week-on-week on DeFiLlama’s narrative tracker. This climb signals growing investor interest in blockchain-based gaming, where play-to-earn mechanics meet decentralized finance (DeFi). But what’s driving this momentum? Enter
GameFi isn’t without its challenges. The sector’s total market cap experienced a modest 1% dip to around $9 billion, reflecting caution among traders. More starkly, trading volume cratered by 77% to just $1.3 billion. Where have all the GameFi degens gone? Many are hunkered down in the trenches, wary of the ongoing bearish sentiment.
Yet, glimmers of hope persist. CoinMarketCap’s Fear & Greed Index ticked up from 25 to 29 over the week, hinting at a subtle shift toward greed. This improvement comes as prediction markets continue to dominate headlines, but GameFi’s rapid ascent on narrative leaderboards suggests it’s nipping at their heels.
These metrics paint a picture of a sector under pressure but poised for rebound, much like a gamer respawning after a tough level.
The biggest catalyst this week? TRUMP, the high-profile meme-inspired token tied to political fervor, is making waves by diving headfirst into GameFi. Long known for its speculative rallies during election cycles, TRUMP is pivoting toward interactive Web3 experiences. Recent announcements reveal partnerships with leading GameFi platforms, including the launch of a Trump-themed play-to-earn game where players can stake tokens, battle in arenas, and earn real yields.
This isn’t just hype—TRUMP’s integration brings massive visibility. Imagine NFT collectibles of iconic moments, governance via in-game votes, and rewards tied to real-world events. Early adopters are buzzing about potential airdrops and exclusive alpha access, drawing in both crypto natives and mainstream gamers. As TRUMP allocates a portion of its treasury to GameFi development, it’s injecting fresh liquidity and credibility into the space.
“GameFi isn’t just games—it’s the future of ownership in entertainment. With TRUMP’s entry, we’re seeing politics, memes, and blockchain collide in epic fashion.”
This move aligns perfectly with GameFi’s core ethos: turning fun into financial opportunity. Expect TRUMP to catalyze user growth, with on-chain metrics already showing spikes in active wallets.
Web3 gaming optimism is building on multiple fronts. DeFiLlama’s tracker doesn’t lie—GameFi’s narrative score reflects surging social mentions, developer activity, and capital inflows. While prediction markets like Polymarket steal the spotlight for their real-world utility, GameFi offers something irreplaceable: immersive escapism with economic upside.
Key drivers include:
Contrast this with fading hype around other narratives. Projects like WOD (World of Dypians) are sliding amid a lack of new catalysts and sector-wide risk aversion. Without fresh updates or viral marketing, even established names struggle to hold ground.
While the macro picture is mixed, standouts are thriving:
| Project | Market Cap | Key Feature |
|---|---|---|
| AXS (Axie Infinity) | $1.2B | Play-to-earn pioneer |
| GALA | $800M | Ecosystem of games |
| TRUMP GameFi Initiative | Emerging | Meme-powered battles |
Prediction markets remain hot, but GameFi’s blend of entertainment and DeFi is proving more sticky. Watch for crossovers, like integrating oracle data for dynamic in-game economies.
Looking forward, GameFi news points to a brighter horizon. With TRUMP’s splashy entry, expect a wave of celebrity and meme coin integrations. Combine this with Ethereum’s Dencun upgrade reducing costs and Apple’s potential Web3 app store openness, and the stars are aligning.
For degens and builders alike, now’s the time to position. Stake in resilient protocols, farm yields in top games, and keep an eye on DeFiLlama for the next narrative shift. GameFi isn’t just surviving—it’s evolving into the next trillion-dollar frontier.
Ready to level up your crypto game? Dive into GameFi today and turn pixels into profits.
What is GameFi? GameFi merges gaming with DeFi, letting players earn crypto through gameplay.
Why is TRUMP entering GameFi? To leverage its community for viral growth and real utility in Web3 entertainment.
Is GameFi a good investment? High risk, high reward—DYOR and focus on projects with strong teams and roadmaps.
How to get started in Web3 gaming? Wallets like MetaMask, explore marketplaces like OpenSea, and play free-to-start titles.
Discuss this news on our Telegram Community. Subscribe to us on Google news and do follow us on Twitter @Blockmanity
Did you like the news you just read? Please leave a feedback to help us serve you better
Disclaimer: Blockmanity is a news portal and does not provide any financial advice. Blockmanity’s role is to inform the cryptocurrency and blockchain community about what’s going on in this space. Please do your own due diligence before making any investment. Blockmanity won’t be responsible for any loss of funds.
The 
 EURUSD exchange rate held steady in the past few months, a trend that may continue in the coming months as top analysts predict a return to US dollar slide amid a divergence between the Federal Reserve and the European Central (ECB). It was trading at 1.1740, much higher than last month’s low of 1.1463.
Top analysts predict a return to US dollar slide
The EURUSD pair continued rising as many investors predicted that the US dollar index would start its slide in the coming months.
In several reports, analysts by companies like Goldman Sachs and Deutsche Bank noted that all conditions were highly supportive of a dollar slide.
The main reason is the Federal Reserve will likely maintain a dovish tone as other central banks start hiking interest rates.
For example, analysts believe that the Bank of Japan (BoJ) will hike interest rates this month. Also, the expectation among analysts is that the European Central Bank (ECB) will hike in the third quarter of next year.
Other central banks expected to maintain a hawkish view are the Reserve Bank of Australia (RBA), the People’s Bank of China (PBoC), and the Bank of England (BoE).
On the other hand, the Federal Reserve is expected to maintain a dovish tone in a few months.
It has already started its quantitative easing (QE) policy, and officials predict that it will deliver one more cut this year. Analysts see the bank cutting rates more times as Donald Trump will replace Jerome Powell with a ‘puppet’.
The only limit to the bank’s Fed cuts will be other officials, who have started dissenting. Three officials dissented in the last meeting, with some voting for a cut and others for a raise.
ECB interest rate decision ahead
The next key catalyst for the EURUSD pair will be the upcoming European Central Bank interest rate decision, which will come out on Thursday.
Economists believe that the bank will decide to leave interest rates unchanged in this meeting as the bloc’s economy is doing relatively well and inflation has largely been contained.
As a result, most analysts expect that the bank will hike rates in the third quarter of next year. However, some analysts expect it to cut in March, with a Bloomberg analyst writing:
“While the ECB appears reluctant to cut rates again, our view is that the risks to our call for no change are skewed to the downside. We think the central bank is underestimating the threat US tariffs pose to the region’s economy.”
Therefore, the upcoming monetary policy meeting will shed light on what to expect in the coming meetings.
EURUSD technical analysis
EURUSD chart | Source: TradingView
The EURUSD exchange rate has been in an uptrend in the past few days, rising from a low of 1.1463 in November to 1.1740 today. It has formed an inverse head-and-shoulders pattern, a popular bullish continuation sign.
The pair has already moved above this pattern’s neckline, a move that has confirmed its uptrend. At the same time, the Relative Strength Index (RSI) and the MACD indicators have continued rising in the past few weeks.
Therefore, we are staring at a situation where the pair may keep rising as bulls target the next key resistance at 1.1913, its highest level this year. A move above that level will point to more gains, potentially to the psychological point at 1.2000.
It’s no secret that matcha is the moment. And while a dozen stylish new boutique cafes have opened up around London, for many, all roads lead back to Blank Street. And today, I followed in those footsteps to sneak a preview of the brand’s latest collaboration with Goodhood, launching Matcha Latte Incense Cones.
Within home fragrance, I’ve been on my incense droplets kick of late. So, when news of this fashionably late collaboration reached me, I decided it was a must to inspect. And let me tell you, while it might be one of the last perfuming collaborations to hit the interiors space, it certainly made an entrance.
Let’s talk about why this limited edition drop is worth looking out for and how it makes for an aromatic foray into the world of matcha — that is, if you’re not yet as in love with the earthy green tea as the rest of us.
Matcha has been the word (and drink) on everyone’s lips this year. From matcha green having an influence on design to the rise of matcha-inspired cafes, you can’t escape this beautiful tea that’s made its way from Japanese tea ceremonies into hot pop culture.
So I tend to be a little picky with my fragrances and approach socially inspired launches with a lens of question. And unsurprisingly, this collaboration between Blank Street and Goodhood delivered matcha latte pressed into little cones that weave the scent of this popular cafe order through your home.
When you first open the tin, you’ll be hit with woody notes that some Livingetc team members compare to ropes of liquorice. But don’t be fooled by its cold throw, for when you light a cone, you’ll no doubt be greeted by the familiar fragrance of a freshly whisked matcha.
It’s not a sugared-up, overtly gourmand fragrance by any means. Which, to me, speaks to authenticity in its crafting. So if you’re looking for a solid sweet matcha scent, this is not the drop for you.
But if you do prefer a more mature matcha fragrance, I recommend getting your hands on one of the 500 tins available in this limited edition launch. And on the off chance that you don’t, let me leave you with some alternative matcha-inspired fragrances that will hold you over until the next collaboration worth its hype.

Paddywax
Matcha Tea & Bergamot Scented Candle
Size: 283 g
Paddywax is a master at creating fragrances that impress, and this Matcha Tea & Bergamot Scented Candle is no less.

NEST New York
Lime Zest & Matcha Classic Candle
Notes: Lime Zest, Green Tea, Clary Sage, Bergamot
Make your home smell good with this balanced, fresh, and sweet scent blend from NEST New York.

Herb & Earth
Matcha Bamboo Incense
Quantity: 20 Sticks
If you want the same fragrancing format with a similar scent, this Matcha Bamboo Incense from Herb & Earth should be on your radar.

Fragrancia
Nippon Kodo Scentsual Fresh Matcha Japanese Incense

Chamberlain Coffee
Matcha Ceramic Candle
Burn Time: 45 Hours
Hailing from internet icon Emma Chamberlain’s brand, this Matcha Ceramic Candle lets on that she knows her tea leaves just as well as her coffee beans.

Earl of East
Iced Matcha Soy Wax Café Candle
Since it’s that time of year when fragrance plays a major role in the ambiance of a space, my advice is to embrace versatile scents like matcha in personal spaces, while making your home smell like Christmas in your hosting zones. And if you’re wondering which fragrances to pick, you can’t go wrong with the winter woods trend.