The main category of All News Articles.
You can use the search box below to find what you need.
[wd_asp id=1]
The main category of All News Articles.
You can use the search box below to find what you need.
[wd_asp id=1]
– Written by
David Woodsmith
STORY LINK GBP/USD Forecast: Pound Sterling Touches Eight-Day Low amid Monetary Policy Expectations
The Pound US Dollar (GBP/USD) exchange rate edged lower on Thursday as changing expectations for central bank interest rates kept the pairing under pressure.
At the time of writing, GBP/USD was trading at $1.3581, having recovered slightly from an eight-day low of $1.3572 but remaining down on the day.
The US Dollar (USD) continued to trade on solid footing on Thursday, after Wednesday’s inflation figures prompted markets to revise their expectations for the Federal Reserve’s next interest rate move.
The latest core PCE price index – the Fed’s preferred inflation measure – suggested that price pressures remain stubbornly above target. This reinforced expectations that the US central bank could raise interest rates in the coming months.
This helped to keep USD supported into Thursday’s session.
Meanwhile, the Pound (GBP) came under some pressure as markets pushed back their expectations for a Bank of England (BoE) interest rate hike from late 2026 to 2027.
The recent fall in global oil prices has reduced expectations that the BoE will raise interest rates this year, leaving Sterling on the back foot.
Get better rates and lower fees on your next international money transfer.
Compare TorFX with top UK banks in seconds and see how much you could save.
Concerns surrounding the UK’s rising cost of living also dampened the appeal of the Pound, following news on Wednesday that the energy price cap will rise by 4% in October and could increase further in January.
Looking ahead, Federal Reserve interest rate expectations could remain a key focus on Friday, with Fed Chair Kevin Warsh due to deliver a keynote speech at the bank’s Jackson Hole symposium. The US will also publish its annual revision to the non-farm payroll figures.
A weak set of jobs figures, combined with a cautious message from Warsh, may dampen expectations for further Fed rate hikes and put the US Dollar under pressure. However, stronger payrolls data and a hawkish tone from the Fed chair could fuel a USD rally.
For the Pound, the UK’s economic calendar remains light on Friday. As a result, Sterling may struggle to gain momentum once again.

International Money Transfer? Ask our resident FX expert a money transfer question or try John’s new, free, no-obligation personal service! ,where he helps every step of the way,
ensuring you get the best exchange rates on your currency requirements.
TAGS: Pound Dollar Forecasts
Gold is back in the red below $4,600 early Friday, resuming its corrective decline from 15-week highs of $4,697 earlier this week.
Gold bulls are consolidating the upside, awaiting Federal Reserve (Fed) Chairman Kevin Warsh’s debut at the annual Jackson Hole Symposium.
In doing so, traders are continuing to take profits off the table, following the recent surge to over three-month highs. They keenly await Warsh’s words for fresh hints on whether an interest rate hike remains a possibility at the Fed’s September 16-17 monetary policy meeting.
Despite hot US core Personal Consumption Expenditures (PCE) Price Index data for July, the CME Group’s FedWatch Tool shows the market keeps pricing in a roughly 65% probability that the Fed will keep rates on hold next month.
The headline PCE Price Index increased 0.2% for the month, putting the annual inflation rate at 3.7%, the Commerce Department reported Wednesday. The market forecast was for 0.1% and 3.6%, respectively. Meanwhile, core PCE posted gains of 0.2% and 3.3%, in line with forecasts.
Fading hopes for a September Fed rate hike and the optimism over a potential reopening of the Strait of Hormuz keep the US Dollar (USD) recovery in check, limiting any downside in Gold.
However, Gold’s next major move remains at the mercy of the new Fed Chairman, with markets expecting Kevin Warsh to signal a roadmap for fighting inflation while not just sticking to his rhetoric of watching incoming economic data and restoring price stability.
If Warsh disappoints by offering no hints on the path forward for interest rates or fails to address the recent developments around bond markets, that is unlikely to go down with US Dollar traders. In such a scenario, Gold could see a fresh leg north.
That said, any reaction could be short-lived as attention would quickly turn to next week’s US Nonfarm Payrolls data.
In the daily chart, XAU/USD trades at $4,579.57, holding a clear bullish bias as price stands above the 21-day, 50-day, 100-day and 200-day simple moving averages (SMAs), which all trail beneath the market and reinforce a well-supported uptrend. The Relative Strength Index (14) at 64.55 is in bullish territory but shy of overbought conditions, suggesting positive momentum that still leaves room for further upside before excessive froth becomes a concern.
On the downside, initial support is aligned with the 200-day SMA near $4,527.73, followed by a medium-term demand zone around the 21-day SMA at $4,399.08 and the 100-day SMA at $4,374.69, while the 50-day SMA at $4,208.94 marks a deeper trend-supportive floor. With no nearby technical resistance levels overhead in this dataset, the path of least resistance remains to the upside as long as XAU/USD continues to trade above these stacked moving averages.
(The technical analysis of this story was written with the help of an AI tool. Know more.)
According to TD Securities, Commodity Trading Advisors “remain comfortable with their long positions in gold heading into Jackson Hole,” reflecting a constructive backdrop for the metal. The bank cautions that “a more hawkish tone from Fed Chair Warsh would be a catalyst for some reversal in the yellow metal,” but argues that “the bar is likely high to reverse the improved sentiment in precious metals.” Beyond the Fed’s “willingness to look past an energy-driven inflation shock,” TD Securities highlights that “the re-ignition of the dollar debasement theme has also fueled renewed macro discretionary appetite in precious metals.”
Monetary policy in the US is shaped by the Federal Reserve (Fed). The Fed has two mandates: to achieve price stability and foster full employment. Its primary tool to achieve these goals is by adjusting interest rates.
When prices are rising too quickly and inflation is above the Fed’s 2% target, it raises interest rates, increasing borrowing costs throughout the economy. This results in a stronger US Dollar (USD) as it makes the US a more attractive place for international investors to park their money.
When inflation falls below 2% or the Unemployment Rate is too high, the Fed may lower interest rates to encourage borrowing, which weighs on the Greenback.
The Federal Reserve (Fed) holds eight policy meetings a year, where the Federal Open Market Committee (FOMC) assesses economic conditions and makes monetary policy decisions.
The FOMC is attended by twelve Fed officials – the seven members of the Board of Governors, the president of the Federal Reserve Bank of New York, and four of the remaining eleven regional Reserve Bank presidents, who serve one-year terms on a rotating basis.
In extreme situations, the Federal Reserve may resort to a policy named Quantitative Easing (QE). QE is the process by which the Fed substantially increases the flow of credit in a stuck financial system.
It is a non-standard policy measure used during crises or when inflation is extremely low. It was the Fed’s weapon of choice during the Great Financial Crisis in 2008. It involves the Fed printing more Dollars and using them to buy high grade bonds from financial institutions. QE usually weakens the US Dollar.
Quantitative tightening (QT) is the reverse process of QE, whereby the Federal Reserve stops buying bonds from financial institutions and does not reinvest the principal from the bonds it holds maturing, to purchase new bonds. It is usually positive for the value of the US Dollar.
GBP/JPY trades broadly flat on Thursday after Wednesday’s modest pullback ended a four-day winning streak. At the time of writing, the cross trades around 216.45, with momentum indicators suggesting limited buying interest.
The Japanese Yen (JPY) stays broadly weak as concerns over Japan’s fiscal outlook and its relatively low interest rates compared with other major economies continue to weigh on the currency. This keeps the broader bias for GBP/JPY tilted to the upside.
That said, sentiment around the British Pound (GBP) also remains somewhat fragile, with UK fiscal concerns elevated ahead of the October 28 Budget. At the same time, the Bank of England’s (BoE) cautious stance and reluctance to raise interest rates further are limiting additional support for the Pound.
In the near term, GBP/JPY is likely to remain in consolidation mode, with Tokyo Consumer Price Index (CPI) data due on Friday potentially providing the next directional catalyst.
On the daily chart, GBP/JPY maintains a mildly bullish bias, although the technical setup points to consolidation rather than a strong directional move. The cross holds above the 50-day, 100-day and 200-day Simple Moving Averages (SMAs), while also staying above the 61.8% Fibonacci retracement at 215.72, keeping the broader structure constructive.
Momentum indicators, however, remain subdued. The Relative Strength Index (RSI) hovers around 54, while the Moving Average Convergence Divergence (MACD) stays slightly above zero but shows fading positive momentum. At the same time, the Average Directional Index (ADX) near 17 points to a weak trend, supporting the case for near-term consolidation.
On the upside, initial resistance is seen at the 78.6% Fibonacci retracement at 217.40, followed by the recent swing high and 100% retracement at 219.50. On the downside, the 215.84-215.72 area, where the 50-day SMA meets the 61.8% retracement, offers immediate support. A break lower could expose the 100-day SMA at 215, followed by the 50% retracement at 214.54 and the 200-day SMA near 212.82.
(The technical analysis of this story was written with the help of an AI tool. Know more.)
The Japanese Yen (JPY) is one of the world’s most traded currencies. Its value is broadly determined by the performance of the Japanese economy, but more specifically by the Bank of Japan’s policy, the differential between Japanese and US bond yields, or risk sentiment among traders, among other factors.
One of the Bank of Japan’s mandates is currency control, so its moves are key for the Yen. The BoJ has directly intervened in currency markets sometimes, generally to lower the value of the Yen, although it refrains from doing it often due to political concerns of its main trading partners. The BoJ ultra-loose monetary policy between 2013 and 2024 caused the Yen to depreciate against its main currency peers due to an increasing policy divergence between the Bank of Japan and other main central banks. More recently, the gradually unwinding of this ultra-loose policy has given some support to the Yen.
Over the last decade, the BoJ’s stance of sticking to ultra-loose monetary policy has led to a widening policy divergence with other central banks, particularly with the US Federal Reserve. This supported a widening of the differential between the 10-year US and Japanese bonds, which favored the US Dollar against the Japanese Yen. The BoJ decision in 2024 to gradually abandon the ultra-loose policy, coupled with interest-rate cuts in other major central banks, is narrowing this differential.
The Japanese Yen is often seen as a safe-haven investment. This means that in times of market stress, investors are more likely to put their money in the Japanese currency due to its supposed reliability and stability. Turbulent times are likely to strengthen the Yen’s value against other currencies seen as more risky to invest in.
Silver Price Forecast: XAG/USD Stays Bullish, Dips Capped Above $67.40
Silver (XAG/USD) maintains a bullish technical posture, with downside moves finding support above the $67.40 level, according to the latest market analysis. As of [current date], the precious metal continues to trade within an upward channel, supported by a combination of technical factors and broader market sentiment.
The $67.40 level has emerged as a critical short-term support zone, capping any pullback attempts. This level aligns with the recent consolidation range and represents a pivot point for traders monitoring the pair. On the upside, resistance is seen near recent highs, with a break above that level potentially opening the door for further gains.
Technical indicators, including moving averages and momentum oscillators, remain supportive of the bullish bias. The 50-day and 200-day moving averages are trending higher, reflecting sustained buying interest. Additionally, the Relative Strength Index (RSI) is hovering in bullish territory without being overbought, suggesting room for continued upside.
The bullish outlook for silver is underpinned by a combination of factors, including a softer U.S. dollar, expectations of a more accommodative Federal Reserve, and robust industrial demand. Silver’s dual role as both a precious and industrial metal makes it sensitive to shifts in economic growth and monetary policy.
Recent U.S. economic data has shown signs of cooling inflation, which has fueled speculation that the Fed may begin cutting interest rates later this year. Lower interest rates typically reduce the opportunity cost of holding non-yielding assets like silver, making it more attractive to investors. Additionally, the greenback’s weakness has provided a tailwind for dollar-denominated commodities.
On the supply side, mine production has faced disruptions in key producing regions, while industrial demand—particularly from the solar panel and electronics sectors—remains strong. This supply-demand imbalance adds a fundamental layer to the technical bullish case.
Analysts note that silver’s outlook is also tied to global economic recovery prospects. If growth accelerates, industrial consumption could rise, further supporting prices. Conversely, a sharper-than-expected economic slowdown could dampen demand and pressure prices, although the current technical setup suggests buyers remain in control.
For traders and investors, the $67.40 level is a key line in the sand. As long as silver holds above this support, the short-term bias stays constructive. A daily close below this level would signal a potential shift in momentum and could trigger a deeper correction. Conversely, a sustained move above the next resistance zone would reinforce the bullish trend and could attract additional buying.
As with any market, risk management remains crucial. Stop-loss orders below key support levels and position sizing based on individual risk tolerance are prudent strategies. Market participants should also stay attuned to upcoming economic data releases and central bank communications, which could influence the next directional move.
Silver’s technical picture remains bullish, with dips above $67.40 being bought. The combination of supportive technicals, a softer dollar, and strong industrial demand underpins the positive outlook. However, traders should remain vigilant, as a break below the key support could alter the near-term bias. Monitoring these levels and broader market catalysts will be essential for navigating the precious metals market in the coming sessions.
Q1: What is the significance of the $67.40 level for silver?
The $67.40 level acts as a key short-term support zone. As long as silver holds above it, the bullish technical structure remains intact. A break below could signal a potential trend reversal.
Q2: Why is silver considered bullish despite recent price fluctuations?
The bullish bias is supported by a combination of technical indicators, a weaker U.S. dollar, expectations of Fed rate cuts, and strong industrial demand. These factors collectively favor higher silver prices.
Q3: What are the main risks to the silver price outlook?
The primary risks include a stronger-than-expected U.S. dollar, a more hawkish Federal Reserve, or a sharp global economic slowdown that could reduce industrial demand. A daily close below $67.40 would also be a technical warning sign.
This post Silver Price Forecast: XAG/USD Stays Bullish, Dips Capped Above $67.40 first appeared on BitcoinWorld.
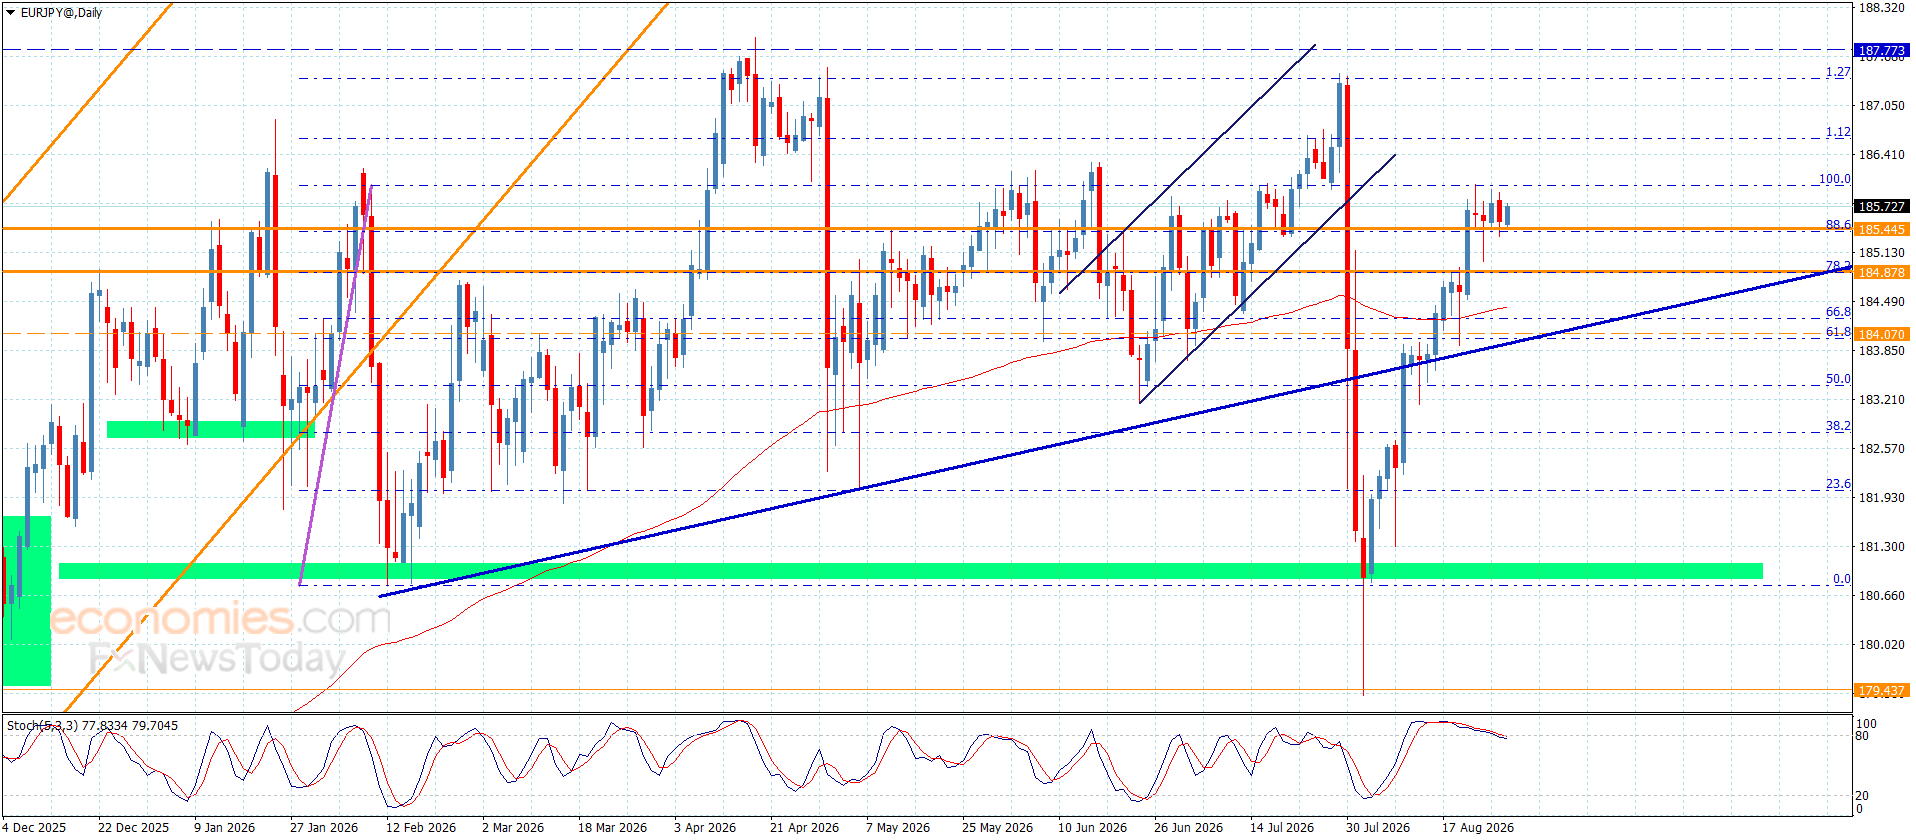
The EURJPY pair resisted the negative pressure that comes from stochastic exit from the overbought level, to settle above the initial support at 184.80 level, to rally higher and settle near 185.70 level.
Note that breaching 186.05 barrier and holding above it is important to confirm its readiness to resume the bullish trend by reaching 186.65 initially reaching 187.30, while the failure to breach this level will increase the chances of forming new corrective waves, to force it suffer some losses by reaching the initial support near 184.80.
The expected trading range for today is between 185.80 and 186.05
Trend forecast: Sideways
Domestic coffee prices today
Coffee prices today in the domestic market continue to decrease in key areas. According to giacaphe. com, coffee prices on August 27 averaged 96,300 VND/kg, down 800 VND/kg compared to the previous session.
In Dak Lak, coffee prices were recorded at 96. 200 VND/kg, down 800 VND/kg.
In Lam Dong, coffee prices reached 95,770 VND/kg, down 800 VND/kg. This is the lowest level among the surveyed areas.
In Gia Lai, coffee prices are at 96. 200 VND/kg, down 800 VND/kg.
The old Dak Nong area recorded a level of 96,500 VND/kg, down 700 VND/kg. This is the highest level in today’s price list.
After two consecutive declining sessions, the price level has left the area of 98,000 VND/kg and returned close to the area of 96,000 VND/kg.
The USD/VND exchange rate according to Vietcombank was recorded at 25,880 VND/USD, down 10 VND.
World coffee prices
In the world market, coffee prices fell sharply in the most recent session.
According to Barchart, the December 2026 Arabica futures contract closed the session on August 26 down 13.35 US cents/lb, equivalent to 3.98%. In the same session, the November 2026 Robusta futures contract fell 77 USD/ton, equivalent to 2.09%. Coffee prices accordingly fell to the lowest level in about 1 week.
Barchart said coffee prices fell due to increased supply prospects from Brazil, leading to sell-offs in the futures market. Some warehouses in Brazil no longer receive new coffee due to shrinking storage space, increasing expectations that farmers may have to sell more goods to the market.
Coffee price assessment
Domestic coffee prices decreased by 700-800 VND/kg in the context of world prices also going down. After a decrease of 500 VND/kg on August 26, the market continued to lose another 800 VND/kg in the August 27, showing that adjustment pressure has not stopped.
According to Barchart, Robusta is also under pressure as Robusta inventory certified on ICE increased to a 9-month high. In the opposite direction, Arabica inventory certified on ICE is still low, but this factor is not enough to stop the decline of Arabica prices in the recent session.
Domestically, according to the Ministry of Agriculture and Environment, in July, Vietnam exported about 147,600 tons of coffee, worth 639.5 million USD. Accumulated in the first 7 months of the year, coffee exports reached about 1.2 million tons, an increase of 10.8% in volume but turnover decreased by 11.2%, to 5.45 billion USD. This development is mainly due to the average export price decreasing by 19.9% compared to the same period, down to 4,537 USD/ton.
Regarding the weather, the National Center for Hydro-Meteorological Forecasting said that on the day and night of August 27, the Central Highlands area will be cloudy, with showers and thunderstorms in some places; especially in the late afternoon and evening, there will be scattered showers and thunderstorms in some places. In thunderstorms, there is a possibility of tornadoes, lightning and strong gusts of wind.
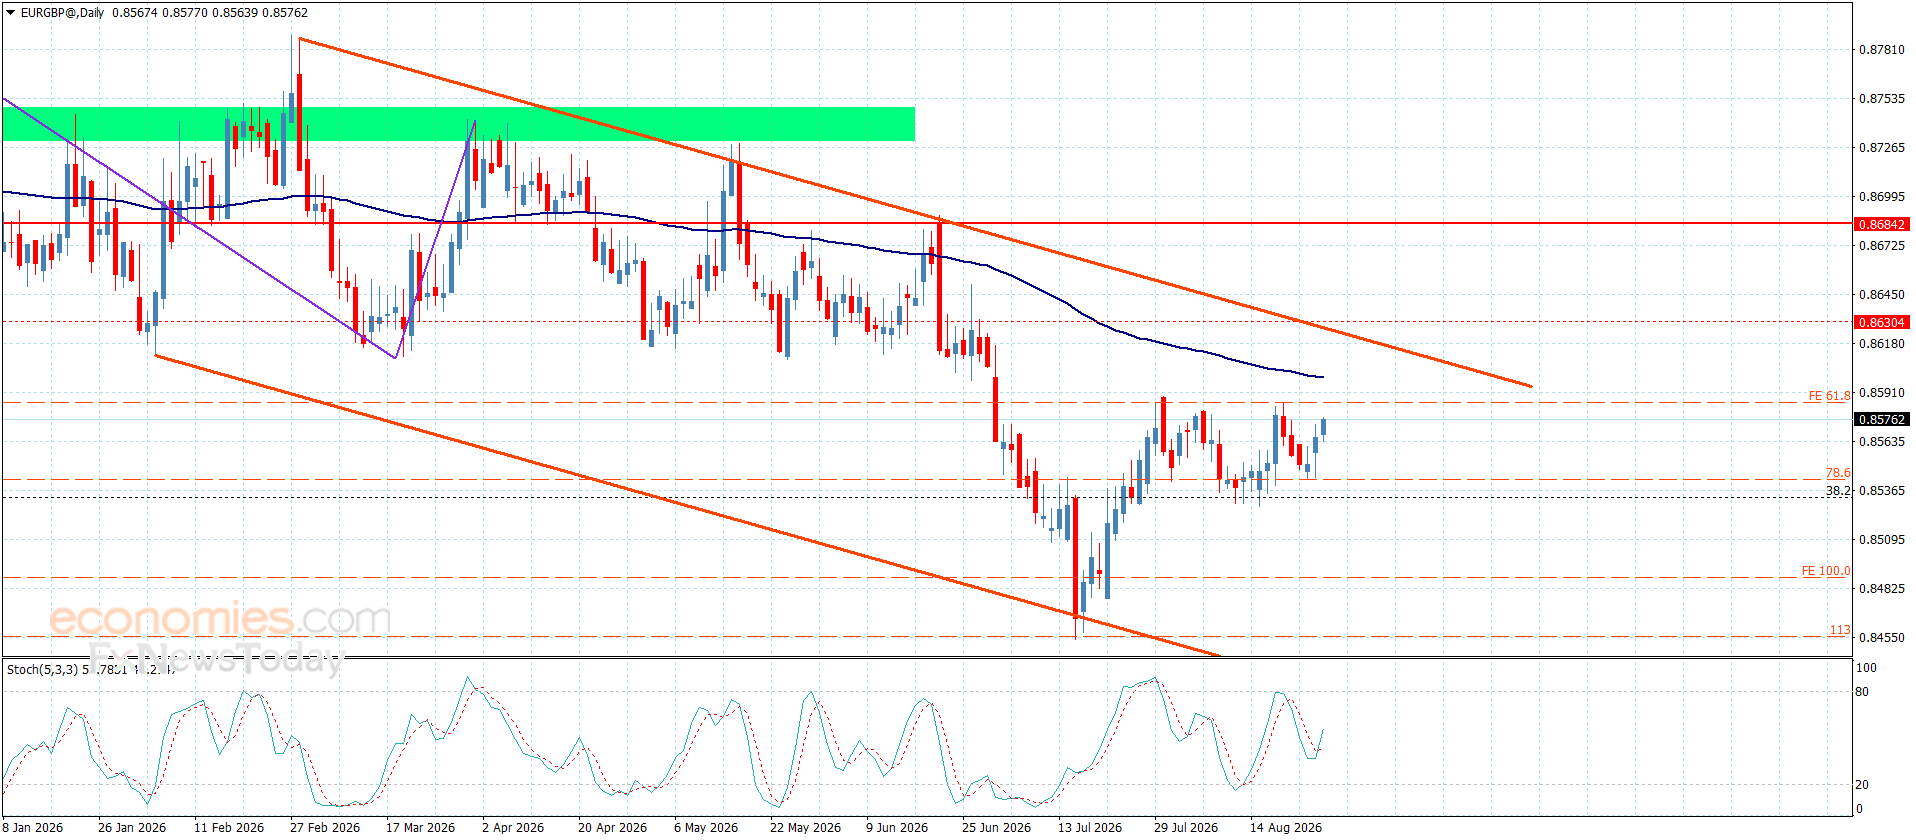
The EURGBP is affected by the continuation of the main indicators, which forces it to delay the bearish trend by its stability above the extra support at 0.8532 level, forming some bullish corrective waves, approaching the barrier at 0.8585.
Note that the stability of the trading within the bearish channel’s levels that appear in the above image and forming additional barriers by the moving average 55 stability near 0.8600 makes us keep the bearish scenario, to keep waiting for gathering extra negative momentum to reach 0.8555, then repeat the pressure on the additional support to find an exit for resuming the main bearish trend.
The expected trading range for today is between 0.8555 and 0.8590
Trend forecast: Bearish
Gold (XAU/USD) is giving away the mild recovery seen during Thursday’s Asian session and pulls back below $4,600 during the European morning, as the US Dollar Index (DXY) consolidates above 99.00. A cautious market sentiment ahead of the Jackson Hole symposium and the hot US inflation figures seen on Wednesday have provided some support to the US Dollar and are keeping precious metals’ rallies limited.
US data released on Wednesday revealed that the Personal Consumption Expenditures (PCE) Price Index, the Federal Reserve’s (Fed) inflation gauge of choice, remained steady well above the 2% target, adding pressure on the central bank to tighten its monetary policy. Bets for a September rate hike, however, remained practically unchanged, at 36%, according to figures released by the CME Group’s FedWatch Tool.
XAU/USD trades at $4,595, after rejection at the $4.700 area earlier in the week, although the near-term bias remains bullish while above the 200-day Simple Moving Average (SMA). Momentum indicators in the daily chart are well within positive territory, with the Relative Strength Index (14) down to 66, after reaching overbought levels, and the Moving Average Convergence Divergence (MACD) indicator retreating but still above zero, hinting at a moderating bullish momentum rather than a bearish reversal.
Immediate support emerges at Wednesday’s low of $4,583, ahead of the aforementioned 200-day SMA, a very popular indicator for FX traders, which now lies at $4,525. A confirmation below here would give fresh hopes for bears, and would expose the August 20 low near $4,450 and the August 14 low, near $4,310.
On the upside, resistance is at Tuesday’s high near the $4,700 level and the May 12 high, near $4,775.
(The technical analysis of this story was written with the help of an AI tool. Know more.)
Gold has played a key role in human’s history as it has been widely used as a store of value and medium of exchange. Currently, apart from its shine and usage for jewelry, the precious metal is widely seen as a safe-haven asset, meaning that it is considered a good investment during turbulent times. Gold is also widely seen as a hedge against inflation and against depreciating currencies as it doesn’t rely on any specific issuer or government.
Central banks are the biggest Gold holders. In their aim to support their currencies in turbulent times, central banks tend to diversify their reserves and buy Gold to improve the perceived strength of the economy and the currency. High Gold reserves can be a source of trust for a country’s solvency. Central banks added 1,136 tonnes of Gold worth around $70 billion to their reserves in 2022, according to data from the World Gold Council. This is the highest yearly purchase since records began. Central banks from emerging economies such as China, India and Turkey are quickly increasing their Gold reserves.
Gold has an inverse correlation with the US Dollar and US Treasuries, which are both major reserve and safe-haven assets. When the Dollar depreciates, Gold tends to rise, enabling investors and central banks to diversify their assets in turbulent times. Gold is also inversely correlated with risk assets. A rally in the stock market tends to weaken Gold price, while sell-offs in riskier markets tend to favor the precious metal.
The price can move due to a wide range of factors. Geopolitical instability or fears of a deep recession can quickly make Gold price escalate due to its safe-haven status. As a yield-less asset, Gold tends to rise with lower interest rates, while higher cost of money usually weighs down on the yellow metal. Still, most moves depend on how the US Dollar (USD) behaves as the asset is priced in dollars (XAU/USD). A strong Dollar tends to keep the price of Gold controlled, whereas a weaker Dollar is likely to push Gold prices up.
When a currency pair fails to sustain a breakout after six months of upward momentum, the reversal often exposes a structural mismatch between conviction and positioning. GBP/USD has completed a textbook head-and-shoulders pattern and broken below the critical neckline, triggering institutional repositioning away from sterling as accumulated long positions face genuine downside vulnerability. This technical invalidation masks a deeper market assumption: that dollar strength persists on economic data confirmation alone—a vulnerability that central bank communications from Jackson Hole could rapidly overturn.

Some analysts might see this as nothing more than the usual ebb and flow of the Forex market, but could it be that something more significant is going on here with the GBP/USD?
Yesterday’s US Dollar-related high-level economic data releases came in exactly as were widely expected – a 0.2% month-on-month increase in the PCE and Preliminary GDP showing growth at 1.5%. Despite the lack of surprise, it seemed to be the case that getting the data safely out of the way was the catalyst for some institutional positioning. The US Dollar gained as a result, and this suggests that the path of least resistance in a currency pair such as GBP/USD is now switching to bearish rather than bullish.
It is also worth noting that the biggest moves in the Forex market have historically tended to happen on Thursdays.
Finally, the price is moving firmly lower after repeatedly testing and eventually failing to break out of the top of its long-term range, with a new 6-month high briefly made, and the price now looking as if it is going to traverse that range in a downwards direction. This might give a strong reward to risk ratio opportunity to short traders.
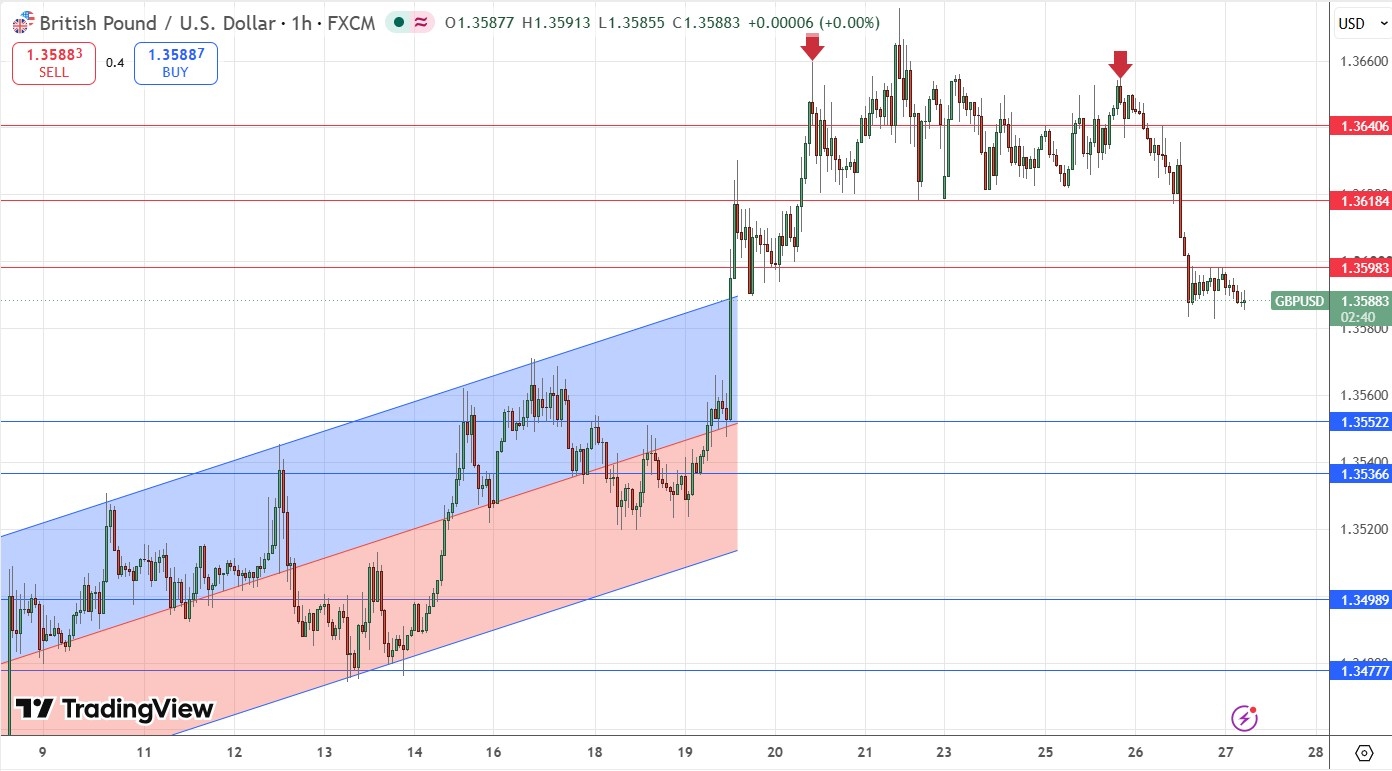
A few days ago, the technical picture was looking very bullish, and the price was threatening to break well above the 1.3650 area to go on to make fresh 6-month highs. It then began to look as if a bearish head and shoulders chart pattern was forming, but the neckline held. We now see a crucial lower high developed and the price finally pushed below the obvious neckline area near 1.3600, so it may be that this head and shoulders pattern finally completed after all. Both that and the repeated failures to exceed the high earlier are bearish signs of exhaustion amongst buyers.
Turning to horizontal support and resistance, the price action has printed new resistance levels, and the one that is holding now and easily absorbing attempts at buying is very confluent with the round number at 1.3600. This suggests that the first part of the London session today is likely to see a move lower. The former support level at 1.3618, which held cleanly as support, has now flipped very cleanly to become new resistance, and that is one of the most bearish signs you can see in the Forex market.
I have not marked it as a defined level, but support might well start to be felt at 1.3565 next.
GBP/USD H1 Price Chart Showing Shoulders
The problem with technical analysis is that it tends to work in the absence of other disruptive factors which might appear from time to time: put simply, news about something which materially affects the perceived valuation of either currency in a currency pair. So, what might affect the British Pound or US Dollar that would upend consideration of technical factors? Most obviously, some form of surprise from relevant central bankers at this weekend’s Jackson Hole Symposium, or even very hawkish or dovish comments from the Fed Chair or more than a single FOMC member, might shift the market’s attitude to the US Dollar materially.
It is challenging to think of a similar risk to the British Pound. Some kind of European flare-up over Russia and Ukraine could hurt the Pound and might also produce a flow into the US Dollar as a safe haven when European currencies take a knock.
Although technical and sentimental factors suggest the next major price movement will be lower, how might an alternative bullish scenario play out? There is a long-term bullish trend here, even though it is not very strong, but it has persisted over many months and could still provide a residual which will see prices moving higher again. Although the current bearish move looks serious, what if this is just a bearish retracement?
I see the most likely bullish scenario as being a move lower to 1.3565 / 1.3550 which then produces a strong bullish bounce, sucking in longs who push the price upwards to make a new 6-month high price, or at least back above the level at 1.3600 which looks like it has potential to be today’s pivotal point.
GBP/USD is worth watching because it has failed to break to a new long-term high, is showing bearish price action, and has a long way to fall while remaining within its dominant range, suggesting there could be a good opportunity to get involved on the short side. Alternatively, the pair may surprise if the long-term bullish trend reasserts itself and produces a fresh high within the next few days. Sentiment on the US Dollar and any surprises at Jackson Hole at the end of this week may prove crucial.
Ready to trade our GBP/USD analysis? Here is our list of the best Forex brokers worth checking out.