The main category of All News Articles.
You can use the search box below to find what you need.
[wd_asp id=1]
The main category of All News Articles.
You can use the search box below to find what you need.
[wd_asp id=1]
Silver price (XAG/USD) trades lower to near $73.70 on Tuesday at the time of writing, down 3.50% on the day. The white metal has been under pressure as dovish Federal Reserve (Fed) expectations remain capped despite cooling United States (US) inflation in January.
Theoretically, immaterial dovish Fed prospects in the near term weigh on non-yielding assets, such as Silver.
The data released on Friday showed that the US headline inflation dropped to 2.4% YoY from 2.7% in December. In the same period, the core Consumer Price Index (CPI) – which excludes volatile food and energy items – grew moderately by 2.5%, as expected, against the previous reading of 2.6%.
Meanwhile, investors brace for high volatility in the North American session as US markets will open after an extended weekend.
This week, the major trigger for the Silver price will be the release of Federal Open Market Committee (FOMC) minutes of the January policy meeting on Wednesday. In the meeting, the Federal Reserve left interest rates unchanged in the range of 3.50%-3.75%.
Globally, investors will pay attention to the second round of talks between the US and Iran in Geneva during the day. Delegates from both nations are expected to discuss the nuclear programme in Tehran. Ahead of talks, US President Donald Trump has signaled that Iran will make a deal, while warning that the nation will face consequences if they don’t resolve issues.
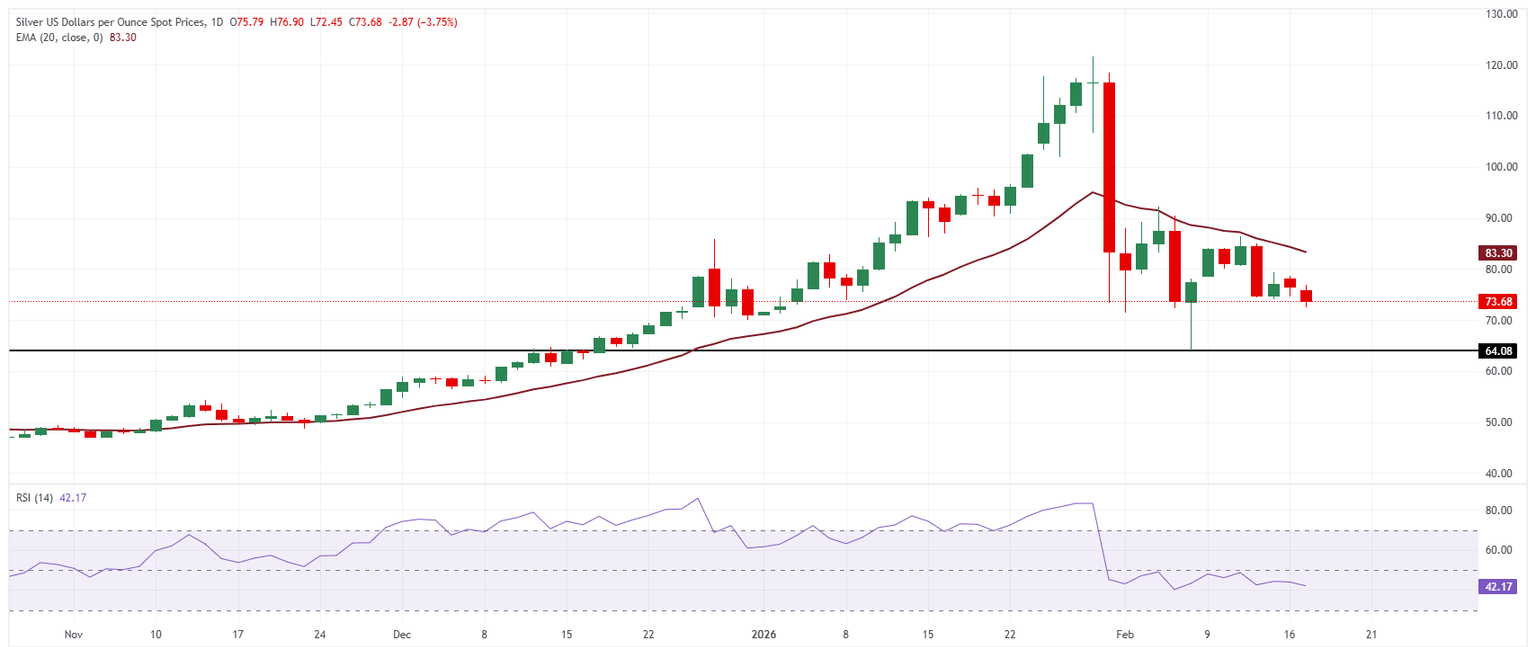
In the daily chart, XAG/USD trades at $73.68. The 20-day exponential moving average descends to $83.30, signaling a weakening short-term structure. Price holds below this gauge, keeping rebounds capped and leaving sellers in control. RSI (14) at 42.17 (neutral) stays under the midline, indicating momentum favors the downside without oversold conditions.
A daily close back above the falling 20-day EMA would ease immediate pressure and improve the near-term tone. Absent that, the path of least resistance remains lower, with failed bounces prone to being faded as the average continues to cap recovery attempts.
(The technical analysis of this story was written with the help of an AI tool.)
Silver is a precious metal highly traded among investors. It has been historically used as a store of value and a medium of exchange. Although less popular than Gold, traders may turn to Silver to diversify their investment portfolio, for its intrinsic value or as a potential hedge during high-inflation periods. Investors can buy physical Silver, in coins or in bars, or trade it through vehicles such as Exchange Traded Funds, which track its price on international markets.
Silver prices can move due to a wide range of factors. Geopolitical instability or fears of a deep recession can make Silver price escalate due to its safe-haven status, although to a lesser extent than Gold’s. As a yieldless asset, Silver tends to rise with lower interest rates. Its moves also depend on how the US Dollar (USD) behaves as the asset is priced in dollars (XAG/USD). A strong Dollar tends to keep the price of Silver at bay, whereas a weaker Dollar is likely to propel prices up. Other factors such as investment demand, mining supply – Silver is much more abundant than Gold – and recycling rates can also affect prices.
Silver is widely used in industry, particularly in sectors such as electronics or solar energy, as it has one of the highest electric conductivity of all metals – more than Copper and Gold. A surge in demand can increase prices, while a decline tends to lower them. Dynamics in the US, Chinese and Indian economies can also contribute to price swings: for the US and particularly China, their big industrial sectors use Silver in various processes; in India, consumers’ demand for the precious metal for jewellery also plays a key role in setting prices.
Silver prices tend to follow Gold’s moves. When Gold prices rise, Silver typically follows suit, as their status as safe-haven assets is similar. The Gold/Silver ratio, which shows the number of ounces of Silver needed to equal the value of one ounce of Gold, may help to determine the relative valuation between both metals. Some investors may consider a high ratio as an indicator that Silver is undervalued, or Gold is overvalued. On the contrary, a low ratio might suggest that Gold is undervalued relative to Silver.
Platinum price forced to provide slow trading in the last period due to the continuation of the main indicators’ contradiction, especially with the stability of moving average 55 below the current trading, to form an intraday support at $1910.00 level.
In general, we will keep preferring the bearish corrective scenario, depending on the stability at $2245.00 and the continuation of the bearish momentum by stochastic, we will keep waiting for extra support at $1950.00 and breaking it might extend the losses directly towards $1880.00 reaching the next support at $1785.00.
The expected trading range for today is between $1950.00 and $2100.00
Trend forecast: Bearish
Copper price continued its negative moves, conforming its surrender to the previously suggested bearish corrective scenario, fluctuating near $5.6780 level, the stability below $5.9700 barrier and the continuation of providing negative momentum by stochastic will increase the chances of facing $5.5100 support, and breaking it will force it to suffer extra losses by reaching $5.3600 initially, reaching the next support at $5.1000 level.
The expected trading range for today is between $5.5100 and $5.8500
Trend forecast: Bearish
Important DisclaimersFXEmpire is owned and operated by Empire Media Network LTD., Company Registration Number 514641786, registered at 7 Jabotinsky Road, Ramat Gan 5252007, Israel. The content provided on this website includes general news and publications, our personal analysis and opinions, and materials provided by third parties. This content is intended for educational and research purposes only. It does not constitute, and should not be interpreted as, a recommendation or advice to take any action, including making any investment or purchasing any product. Before making any financial decision, you should conduct your own due diligence, exercise your own discretion, and consult with competent advisors. The content on this website is not personally directed to you, and we do not take into account your individual financial situation or needs. The information contained on this website is not necessarily provided in real time, nor is it guaranteed to be accurate. Prices displayed may be provided by market makers and not by exchanges. Any trading or other financial decision you make is entirely your own responsibility, and you must not rely solely on any information provided through the website. FXEmpire does not provide any warranty regarding the accuracy, completeness, or reliability of any information contained on the website and shall bear no responsibility for any trading losses you may incur as a result of using such information. The website may include advertisements and other promotional content. FXEmpire may receive compensation from third parties in connection with such content. FXEmpire does not endorse, recommend, or assume responsibility for the use of any third-party services or websites. Empire Media Network LTD., its employees, officers, subsidiaries, and affiliates shall not be liable for any loss or damage resulting from your use of the website or reliance on the information provided herein.Risk DisclaimersThis website contains information about cryptocurrencies, contracts for difference (CFDs), and other financial instruments, as well as about brokers, exchanges, and other entities trading in such instruments. Both cryptocurrencies and CFDs are complex instruments and involve a high risk of losing money. You should carefully consider whether you understand how these instruments work and whether you can afford to take the high risk of losing your money. FX Empire encourages you to conduct your own research before making any investment decision and to avoid investing in any financial instrument unless you fully understand how it works and the risks involved.
Spot Gold has spent most of this Monday trading in a tight range around the $5,000 mark, shedding some ground in the American afternoon, yet lacking directional momentum. A holiday in the United States (US), as the country celebrates Presidents’ Day, exacerbates the quietness after the European close.
Still, the Greenback trades with modest gains across most major rivals, as recent US data hinted at resilient economic progress, while leaving the door open for the Federal Reserve (Fed) to cut interest rates. A clearer picture should appear on Friday, when the US will publish Personal Consumption Expenditures (PCE) Price Index data, the Fed’s favorite inflation gauge. On the same day, the country will release the preliminary estimate of the Q4 Gross Domestic Product (GDP).
In the meantime, investors will look at political headlines for direction. Negotiations between the US and Iran are set to continue on Tuesday, in Geneva, with Iranian Foreign Minister Abbas Araghchi announcing he is coming with “real ideas to achieve a fair and equitable deal.”
At the same time, US President Donald Trump met Israeli Prime Minister Benjamin Netanyahu over the weekend. Trump said afterwards that he would support Israeli strikes on Iran’s ballistic missile program if negotiations between Washington and Tehran fail.
From a technical point of view, the 4-chart shows that XAU/USD is neutral. The pair seesaws right below a flat 20-period Simple Moving Average (SMA), which converges with the 100-period SMA, limiting advances around $5,020. The 200-period SMA at $4,810.85 maintains a modest upward slope, providing relevant support. Technical indicators, in the meantime, head nowhere within neutral levels, reflecting the absence of a certain trend.
In the daily chart, XAU/USD battles to remain above a bullish 20-day Simple Moving Average (SMA), which keeps rising above the 100- and 200-day SMAs. The 20-day SMA currently stands at $4,988.67, offering immediate dynamic support. Meanwhile, the Momentum indicator heads south below its midline, indicating bearish pressure building as upside impetus fades. Finally, the Relative Strength Index (RSI) also heads south yet at 54, not enough to confirm lower lows ahead.
(The technical analysis of this story was written with the help of an AI tool.)
The USD/JPY pair continues to see a bit of support below, as we are trying to sort out whether or not the 152-yen level will continue to hold the market up.
The US dollar rallied a bit against the Japanese yen in early trading on Monday, but keep in mind that the market is likely to be a little bit thin on Monday as the Americans were celebrating Presidents Day and therefore volume drops.
That being said, this is a market that looks like one that is trying to find some type of bottom, perhaps using the 200-day EMA as a bit of support.
If we were to break down below the 152-yen level, then it drops this market back down to the 150-yen level. The market right now is likely to continue to see more of a buy on the dip behavior as the Bank of Japan is currently stuck with a situation where the overabundance of debt is causing a massive problem, but at the same time you have to keep in mind that the debt being financed at a higher rate is unsustainable.
So, I do believe that over the longer term we will see this market turn around and go to the upside. The question of course will be whether or not it can happen anytime soon.
We are at an area that I think would be very interesting for a lot of traders, but if we don’t see the market bounce from here, then the 150-yen level is the next area I look to buy. I don’t have any interest in shorting this pair, quite frankly I don’t like the idea of paying swap, and therefore I think we have a situation where we are looking at a market that has seen a few headlines cross the wire to spook it.
At the end of the day, it is worth noting that US economic numbers have been hotter than anticipated in general and therefore I do think that the buyers will eventually return.
Christopher Lewis has been trading Forex and has over 20 years experience in financial markets. Chris has been a regular contributor to Daily Forex since the early days of the site. He writes about Forex for several online publications, including FX Empire, Investing.com, and his own site, aptly named The Trader Guy. Chris favours technical analysis methods to identify his trades and likes to trade equity indices and commodities as well as Forex. He favours a longer-term trading style, and his trades often last for days or weeks.
Platinum price forced to provide slow trading in the last period due to the continuation of the main indicators’ contradiction, especially with the stability of moving average 55 below the current trading, to form an intraday support at $1910.00 level.
In general, we will keep preferring the bearish corrective scenario, depending on the stability at $2245.00 and the continuation of the bearish momentum by stochastic, we will keep waiting for extra support at $1950.00 and breaking it might extend the losses directly towards $1880.00 reaching the next support at $1785.00.
The expected trading range for today is between $1950.00 and $2100.00
Trend forecast: Bearish
BitcoinWorld
EUR/GBP Price Forecast: Critical 0.8700 Break Tests Bullish Resolve Amid Shifting Tides
LONDON, March 2025 – The EUR/GBP cross has decisively broken below the psychologically significant 0.8700 handle, a move that technical analysts flag as a potential watershed moment for the currency pair’s near-term trajectory. This decline signals a notable loss of steam for the bulls who had previously supported the rate. Consequently, market participants are now scrutinizing charts and fundamental drivers to gauge whether this represents a healthy correction or the beginning of a more profound bearish phase. The interplay between European Central Bank and Bank of England policy paths remains the dominant narrative shaping this critical forex pair.
Technical analysis provides the initial framework for understanding the move below 0.8700. The level had acted as a confluence zone, combining the 100-day simple moving average and a horizontal support area established throughout Q4 2024. A sustained close below this zone, confirmed over several daily sessions, invalidates the prior consolidation structure. Furthermore, momentum indicators like the Relative Strength Index (RSI) have retreated from overbought territory above 70, recorded in late February, and are now trending toward neutral. This shift suggests buying pressure has materially dissipated. Meanwhile, the Moving Average Convergence Divergence (MACD) histogram shows fading bullish momentum, with its signal line threatening a bearish crossover. Volume profile analysis also indicates the break occurred on above-average trading volume, lending credence to its significance. Traders often view such a high-volume break of a key level as a valid signal, not merely market noise.
The immediate focus now shifts to subsequent support zones. The next significant technical floor resides near the 0.8620-0.8640 region, which aligns with the 200-day moving average and a 50% Fibonacci retracement of the November 2024 to February 2025 rally. A failure to hold this area could open the path toward 0.8550. Conversely, any recovery attempt will face initial resistance at the former support-turned-resistance of 0.8700, followed by a stronger barrier near 0.8750. Market sentiment, as gauged by the latest Commitment of Traders (COT) reports from derivatives exchanges, shows a reduction in net-long Euro positions by non-commercial traders. This data aligns with the price action, indicating institutional money is partially unwinding bullish bets.
Beyond the charts, the EUR/GBP price movement reflects a recalibration of fundamental expectations. The primary driver remains the divergent monetary policy outlook between the European Central Bank (ECB) and the Bank of England (BoE). In recent weeks, economic data from the Eurozone has painted a mixed picture. While inflation has edged closer to the 2% target, core metrics remain sticky, and forward-looking surveys like the Purchasing Managers’ Index (PMI) for services have shown unexpected weakness. This has led money markets to slightly dial back expectations for the pace of ECB rate cuts in 2025. Conversely, UK data has surprised to the upside. January 2025 retail sales and wage growth figures exceeded forecasts, complicating the BoE’s path toward easing. This relative data strength has provided underlying support for Sterling, applying downward pressure on the EUR/GBP pair. Geopolitical factors also contribute to the environment. Ongoing tensions affecting European energy security and trade flows introduce a risk premium for the Euro, while the UK’s post-Brexit trade adjustments continue to evolve, creating episodic volatility.
The following table summarizes the recent key data points influencing both currencies:
| Region | Indicator | Latest Figure | Market Implication |
|---|---|---|---|
| Eurozone | Core HICP Inflation (YoY) | 2.8% | Moderating, but above target |
| Eurozone | Composite PMI | 48.9 | Contractionary (<50) |
| United Kingdom | Average Earnings (3Mo/Yr) | 5.6% | Strong, limits BoE easing scope |
| United Kingdom | Services PMI | 52.1 | Expansionary (>50) |
Leading forex strategists from major investment banks are interpreting the break with cautious nuance. “The move below 0.8700 is technically significant,” notes a senior FX analyst at a global bank, citing internal research. “However, it’s crucial to distinguish between a technical correction within a broader range and a genuine trend reversal. The fundamental divergence story is not as clear-cut as it was in 2023.” Many experts emphasize that central bank communication in the coming weeks will be pivotal. Speeches by ECB President Lagarde and BoE Governor Bailey will be parsed for hints on the timing and sequencing of policy adjustments. The impact of this exchange rate shift is tangible. For European exporters to the UK, a weaker EUR/GBP improves competitiveness, potentially boosting certain industrial and agricultural sectors. Conversely, UK consumers and importers face slightly higher costs for Eurozone goods and services. For multinational corporations with cash flows in both currencies, this volatility necessitates active hedging strategies to protect profit margins. Asset managers are also adjusting portfolio allocations, potentially reducing Euro-denominated fixed income exposure relative to Sterling assets if the trend persists.
It is also critical to analyze the EUR/GBP within broader market conditions. Historically, the pair has exhibited a correlation with global risk sentiment, though less pronounced than pairs like AUD/USD. During periods of market stress or “risk-off” environments, the Euro has sometimes acted as a funding currency, while Sterling’s reaction is more tied to domestic factors. The current environment shows a mild risk-off tone in equity markets, which may be providing an additional, subtle headwind for the Euro against most majors, not just the Pound. Monitoring the correlation with bond yield spreads between German Bunds and UK Gilts remains a key analytical tool for fundamental traders.
The EUR/GBP price forecast has entered a critical phase following the confirmed break below the 0.8700 support level. This development marks a clear loss of momentum for the bullish camp and shifts the near-term technical bias to neutral-to-bearish. The move is underpinned by a subtle but important recalibration of growth and monetary policy expectations between the Eurozone and the United Kingdom. While technical indicators point to further downside risk toward the 0.8620 area, the fundamental outlook remains fluid and highly sensitive to upcoming economic data and central bank guidance. Traders and investors should therefore monitor both chart-based signals and the evolving macroeconomic narrative. The path for the EUR/GBP exchange rate will ultimately be determined by which central bank blinks first on policy easing and which economy demonstrates greater resilience in the face of global headwinds.
Q1: What does the EUR/GBP exchange rate represent?
The EUR/GBP exchange rate shows how many British Pounds (GBP) are needed to purchase one Euro (EUR). A rate of 0.8700 means 1 Euro equals 0.87 British Pounds.
Q2: Why is the 0.8700 level considered so important?
The 0.8700 level was a key technical confluence zone, combining a major moving average and prior price support. A break below it signals a shift in market structure and sentiment from bullish to neutral or bearish.
Q3: What fundamental factors most affect EUR/GBP?
The primary drivers are the relative monetary policy of the European Central Bank and the Bank of England, comparative economic growth data (like GDP and PMIs), inflation trends, and geopolitical risks specific to Europe.
Q4: Who is impacted by changes in the EUR/GBP rate?
Exporters and importers between the Eurozone and UK, multinational corporations, forex traders, tourists, and investors with assets in either currency are all directly affected by its fluctuations.
Q5: Where can I find reliable charts and data for EUR/GBP analysis?
Major financial data platforms like Bloomberg, Reuters, TradingView, and the official statistical websites of the ECB (European Central Bank) and ONS (UK Office for National Statistics) provide authoritative charts and economic data.
This post EUR/GBP Price Forecast: Critical 0.8700 Break Tests Bullish Resolve Amid Shifting Tides first appeared on BitcoinWorld.


