The main category of All News Articles.
You can use the search box below to find what you need.
[wd_asp id=1]
The main category of All News Articles.
You can use the search box below to find what you need.
[wd_asp id=1]
Gold Price Forecast: XAU/USD Bullish Momentum Persists as Technicals Signal Further Gains
Gold prices are extending their upward trajectory, with XAU/USD holding near recent highs as of mid-February 2026, driven by a combination of technical momentum, persistent safe-haven demand, and expectations of central bank policy shifts. The precious metal has climbed over 8% since the start of the year, buoyed by geopolitical uncertainties and a softer U.S. dollar, and market analysts see further upside potential if key resistance levels are breached.
The current bullish run in gold is underpinned by several macro factors. The U.S. Federal Reserve’s signals of a potential pause in rate hikes have weakened the dollar, making gold more attractive to international buyers. Additionally, ongoing geopolitical tensions and concerns about global economic growth continue to fuel safe-haven inflows into the yellow metal. Central bank buying, particularly from emerging markets, remains a structural support, with official sector purchases in 2025 reaching a two-decade high.
From a technical perspective, XAU/USD has broken above its 50-day and 200-day moving averages, a classic bullish crossover that often attracts momentum traders. The Relative Strength Index (RSI) is hovering near 65, indicating strong upward momentum without being overbought, leaving room for further gains before a potential pullback.
Immediate resistance is seen at the psychological $2,700 mark, followed by the all-time high near $2,750. A decisive close above these levels could open the path toward $2,800. On the downside, support is established at $2,620, the 20-day moving average, and a break below that could signal a short-term correction. Traders are also monitoring the $2,580 level, which aligns with a Fibonacci retracement of the recent rally.
Volume analysis shows increasing participation in the rally, with open interest in gold futures rising by 5% over the past week, suggesting that new money is entering the market rather than just short covering.
For investors, the sustained bullish trend in gold offers a hedge against inflation and currency depreciation. With real yields still negative in several major economies, gold’s opportunity cost remains low, making it an attractive asset in diversified portfolios. However, a sudden shift in Fed policy or a resolution of geopolitical tensions could trigger profit-taking, so risk management is crucial.
Gold’s bullish run appears poised to continue, supported by solid technicals and macro tailwinds. While short-term corrections are possible, the overall trend remains upward. Investors should watch key resistance levels and central bank communications for cues on the next leg of the move.
Q1: Is gold a good investment in 2026?
Gold remains a viable hedge against inflation and market volatility, especially with central banks diversifying reserves. However, it’s essential to consider your risk tolerance and portfolio goals.
Q2: What is the forecast for XAU/USD this year?
Analysts are cautiously bullish, with targets ranging from $2,700 to $2,800 if current support levels hold. A break below $2,580 could signal a reversal.
Q3: How does the U.S. dollar affect gold prices?
Gold and the dollar typically move inversely. A weaker dollar makes gold cheaper for foreign buyers, boosting demand and prices.
This post Gold Price Forecast: XAU/USD Bullish Momentum Persists as Technicals Signal Further Gains first appeared on BitcoinWorld.
USD/CAD gained ground as demand for commodity-related currencies declined despite rising gold markets. The pullback in the oil markets has not provided support as traders remained worried about potential escalation in the Middle East, which could hurt global growth and reduce demand for commodities.
Currently, USD/CAD is trying to settle above the resistance level at 1.3825 – 1.3840. In case this attempt is successful, USD/CAD will get to the test of the 50 MA at 1.3855. A move above the 50 MA will push USD/CAD towards the next resistance level at 1.3900 – 1.3915.
Price behavior suggests a continuation of the bearish trend until there is evidence to the contrary. That wouldn’t occur unless there was a sustained reclaim of the 50-day moving average. Since that average may be at or near Monday’s high before an upside breakout is attempted, it may have greater significance. The breakout of consolidation, along with the reclaim of a key moving average, would suggest that an advance from there may have greater success than if that 50-day moving average was approached.
Above the 50-day moving average is a lower swing high of $2.98, a key resistance area from structure. It is supported as resistance by a higher swing low from May. That wouldn’t change the overall bearish technical outlook represented in the larger bearish structure. In that case, the current developing symmetrical triangle pattern could be interpreted as a bearish pennant, could add to momentum if a breakdown below last week’s low of $2.69 occurs.
The US Dollar to Japanese Yen (USD/JPY) exchange rate climbed back above 159.20 on Monday, leaving a sizeable gap between current levels and Bank of America’s revised year-end forecast.

USD/JPY traded as high as 159.28 during the session and remained near the top of its daily range, even though the pair is almost 3% below the late-July levels which triggered coordinated US-Japan intervention.
BofA has become materially more constructive on the Yen, cutting its end-2026 USD/JPY forecast to 149 from 152.
“We remain constructive on JPY and revised down USD/JPY forecasts this month,” strategist Shusuke Yamada said, with the bank now forecasting 153 in Q3, 149 in Q4 and Q1 2027, followed by 148 in Q2.
The change is closely tied to what BofA sees as a new policy regime.
Japan’s Ministry of Finance, the US Treasury, the Takaichi administration and the Bank of Japan are now all involved in the Yen story, although BofA cautions that their objectives are “unlikely to be identical”.
The bank nevertheless believes the combination of direct intervention and faster monetary tightening has altered the balance of risks.
BofA’s rates team now expects the BoJ to increase rates in September and December 2026, followed by further hikes in March and July 2027, lifting its terminal-rate assumption from 1.75% to 2.00%.

USD/JPY recovered from an early dip below 158.60 and finished the session near 159.20, another reminder that increasingly hawkish BoJ expectations have yet to produce a clean Yen trend.
There is a particularly interesting feedback loop in BofA’s forecast.
“Our base case assumes USD/JPY falls to 149 by end-2026 and 145 by end-2027, allowing the BoJ to reach 2% in July 2027,” the bank said.
If the Yen refuses to strengthen, however, the policy response could become considerably more aggressive.
“If the yen instead remains around 155 or above, we think the BoJ may need to raise rates to 2.5%,” BofA said, implying another substantial repricing of Japanese front-end yields.
That makes current levels around 159 awkward.
The market is effectively sitting in the zone which, under BofA’s framework, could eventually force the Bank of Japan to tighten more than the bank’s own base case assumes.
The alternative risk is that policymakers lose their nerve.
BofA warns that if intervention was intended merely to slow Yen depreciation, rather than signal a broader change in policy, “USD/JPY may rise again beyond 160”.
We explored that same problem in our latest USD/JPY weekly forecast: September tightening is increasingly expected, but the Yen has demanded evidence that one rate increase will be followed by more.
The rare joint US-Japan operation earlier this month showed Washington and Tokyo were prepared to act together when the Yen’s decline threatened broader financial stability.
BofA’s 149 forecast goes a step further by assuming policy follows the intervention rather than relying on repeated market operations.
The gap from 159.20 to 149 is substantial, but that is precisely why BofA’s forecast stands out.
It is not simply a call for a softer Dollar; it is a wager that Japan’s reaction function has changed.
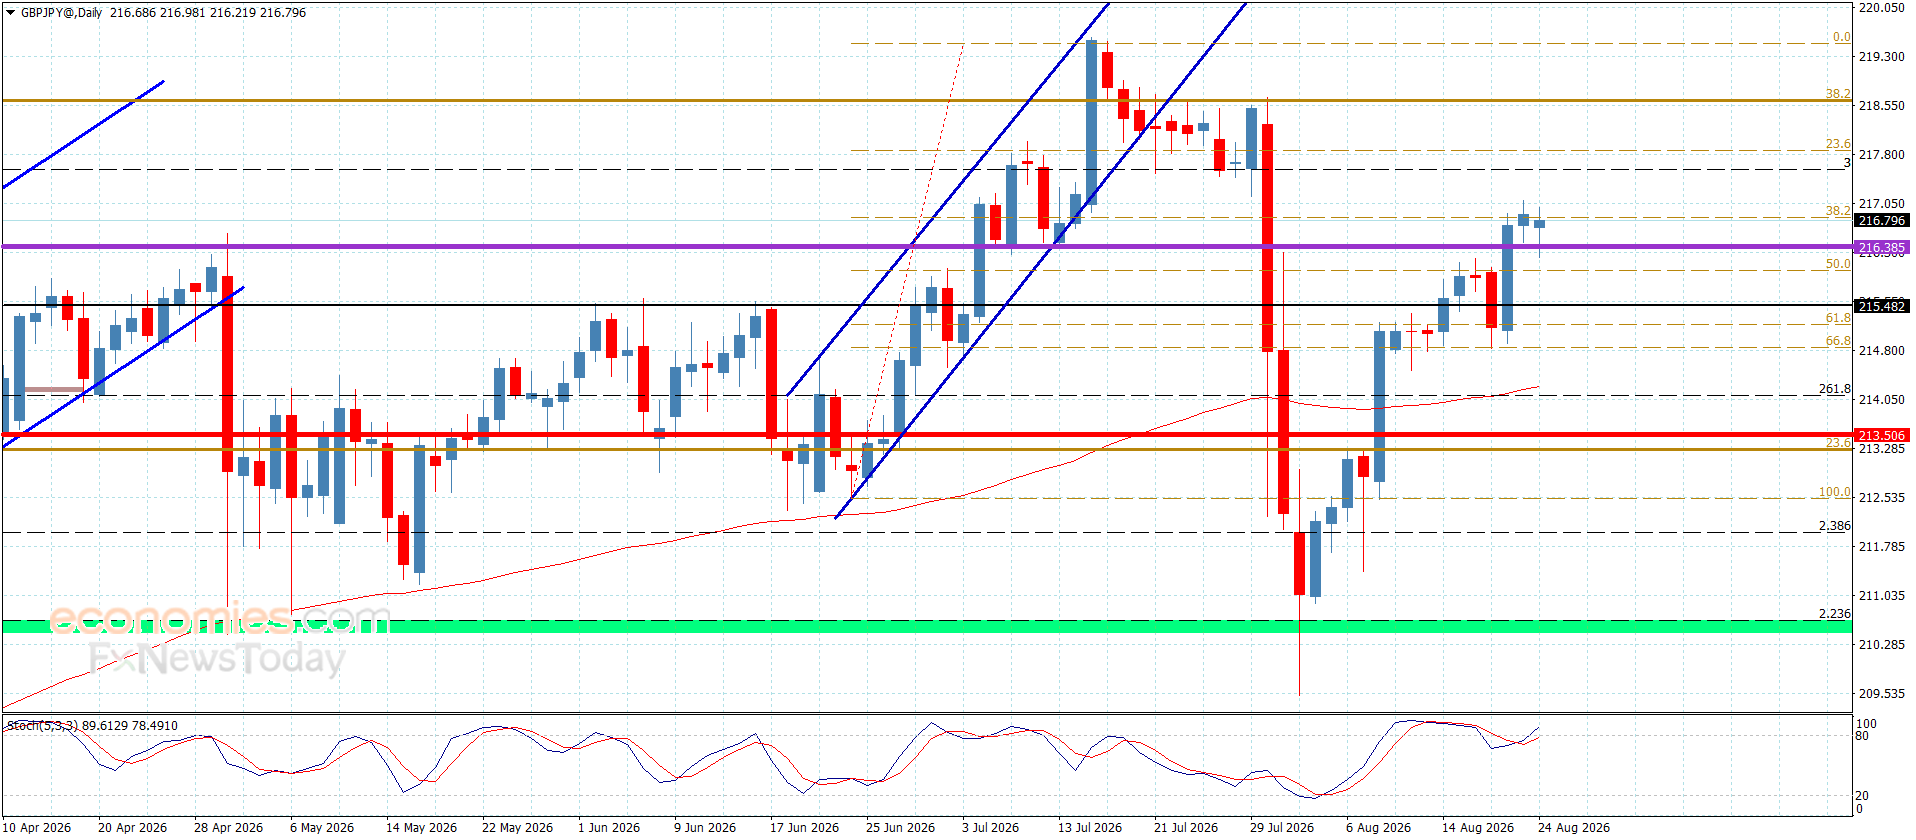
The pair ended its latest bullish surge after hitting 217.10, which forced it to form some sideways trading as it gathers additional positive momentum. The price is currently fluctuating around 216.70, maintaining its positive stability above the initial support at 216.35.
The above keeps our bullish bias intact, with the pair potentially targeting 217.35 and 217.85, respectively. However, slipping below 216.35 and recording a negative close would activate the corrective scenario, potentially pushing the price toward 215.55.
The expected trading range for today is between 216.30 and 217.50
Trend forecast: Bullish
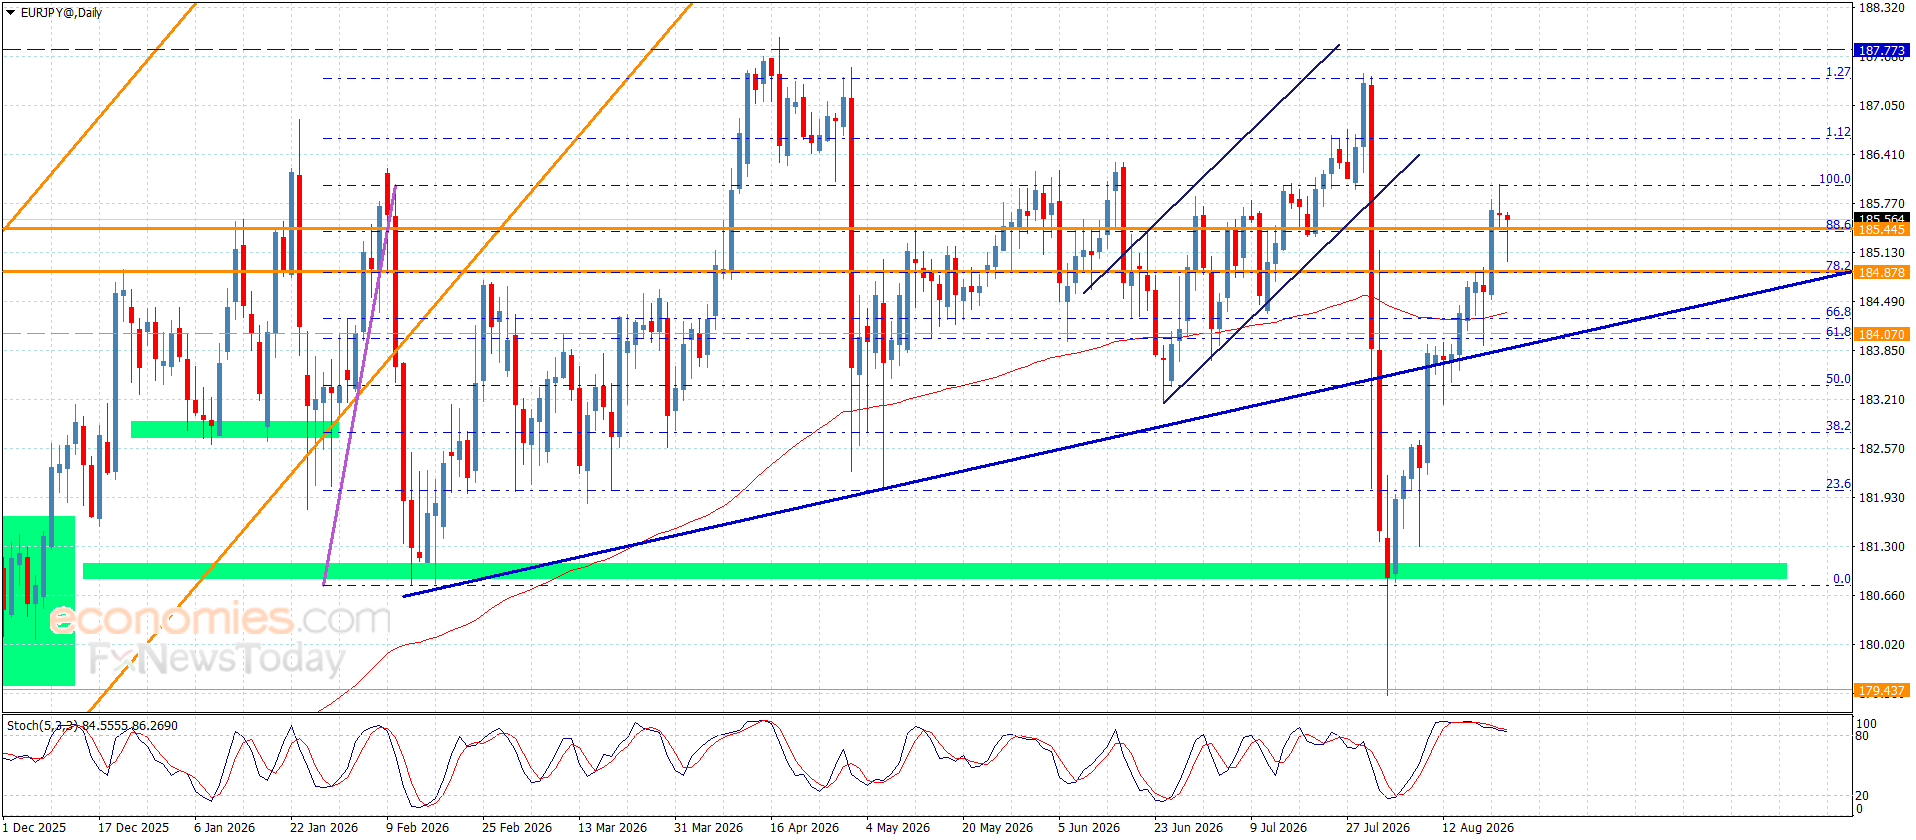
The pair has been forced into some sideways trading since Friday as it repeatedly holds below the 186.05 barrier. During this morning’s trading, the price declined toward 185.00 to stabilize around 185.55, maintaining its commitment to the main bullish scenario.
We will currently rely on 184.80 as the first additional support level and emphasize the importance of the price gathering positive momentum, which would enable it to surpass the 186.00 barrier. Holding above this level would allow the pair to achieve further gains, potentially starting at 186.55 and extending toward 187.25, breaking below the additional support would reactivate the bearish corrective path, reaching towards 184.35 and 183.75.
The expected trading range for today is between 185.00 and 186.55
Trend forecast: Bullish
Silver price (XAG/USD) remains stronger for the fourth successive day, trading around $69.00 per troy ounce during the European hours on Monday. Silver price rises as concerns over United States (US) debt management and fiscal sustainability persist.
This market reaction follows the US Treasury Department’s pledge to at least double its buybacks of longer-dated government debt to curb surging bond yields. US Treasury Secretary Scott Bessent indicated these buybacks could exceed $4 billion, signaling a strategic effort to demonstrate that elevated yields fail to accurately reflect underlying economic fundamentals.
However, non-yielding Silver could face potential headwinds if energy prices trend upward, which could limit the scope for upcoming interest-rate cuts. Secretary Bessent announced plans to impose unprecedentedly tough sanctions as part of an economic isolation campaign designed to force Iran and its trade partners into compliance. This policy shift threatens further constraints on global energy markets, especially as Iranian oil shipments experience severe disruptions and offers to Chinese buyers fall off amid an ongoing US naval blockade.
Tehran has dismissed the impending sanctions as an ineffective attempt to exert economic pressure, emphasizing decades of experience navigating blockades and building economic resilience. Meanwhile, geopolitical friction around the Strait of Hormuz remains acute, with vessel transit through the critical oil corridor staying well below historical averages.
According to Deutsche Bank, their US economists have published a preview of Fed Chair Warsh’s upcoming Jackson Hole appearance, highlighting the potential for a more thematic address. They note that if Warsh opts for a “big-picture” speech, “then his options include a discussion of the Fed’s task forces he set up, or possibly a speech on AI’s impact on the economy and his thinking,” framing the event as a key opportunity for insight into his broader policy approach.
Silver is a precious metal highly traded among investors. It has been historically used as a store of value and a medium of exchange. Although less popular than Gold, traders may turn to Silver to diversify their investment portfolio, for its intrinsic value or as a potential hedge during high-inflation periods. Investors can buy physical Silver, in coins or in bars, or trade it through vehicles such as Exchange Traded Funds, which track its price on international markets.
Silver prices can move due to a wide range of factors. Geopolitical instability or fears of a deep recession can make Silver price escalate due to its safe-haven status, although to a lesser extent than Gold’s. As a yieldless asset, Silver tends to rise with lower interest rates. Its moves also depend on how the US Dollar (USD) behaves as the asset is priced in dollars (XAG/USD). A strong Dollar tends to keep the price of Silver at bay, whereas a weaker Dollar is likely to propel prices up. Other factors such as investment demand, mining supply – Silver is much more abundant than Gold – and recycling rates can also affect prices.
Silver is widely used in industry, particularly in sectors such as electronics or solar energy, as it has one of the highest electric conductivity of all metals – more than Copper and Gold. A surge in demand can increase prices, while a decline tends to lower them. Dynamics in the US, Chinese and Indian economies can also contribute to price swings: for the US and particularly China, their big industrial sectors use Silver in various processes; in India, consumers’ demand for the precious metal for jewellery also plays a key role in setting prices.
Silver prices tend to follow Gold’s moves. When Gold prices rise, Silver typically follows suit, as their status as safe-haven assets is similar. The Gold/Silver ratio, which shows the number of ounces of Silver needed to equal the value of one ounce of Gold, may help to determine the relative valuation between both metals. Some investors may consider a high ratio as an indicator that Silver is undervalued, or Gold is overvalued. On the contrary, a low ratio might suggest that Gold is undervalued relative to Silver.
Currently, the market is factoring in a stronger British pound, and that makes a little bit of sense.
The euro initially did rally a bit during the trading session on Friday but gave back early gains as we peeked through the 50-day EMA. Currently, the market is factoring a stronger British pound, and that makes a little bit of sense. The composite of the PMI in the United Kingdom was 52.5 versus 51.6, and services came out at 52.8, 1 whole point above expected. Manufacturing came out at 51.5, basically in line, so this shows that the United Kingdom is still growing. The Q3 GDP of around 0.3% helps by both tech investment and, to a certain extent, weather in the United Kingdom, so a lot of things are going correctly at the same time in the UK. The eurozone is strong, but it’s a little less of a surprise. The numbers came in a little bit higher this week in the PMI data than expected, but almost in line, so it’s a relative strength situation.

The situation right now with the United Kingdom Bank of England rate at 3.75% being held the last time, with 3 votes being for a hike to 4%, this, of course, is something that will have to be kept in the back of your mind as the CPI numbers came out at a 4-month high as well. On the other hand, most analysts believe that the European Union may raise rates by 0.25%, but that still leaves the interest rate differential in favor of the United Kingdom, and it does not look like the ECB is likely to begin some type of aggressive hiking cycle. So, it does make a certain amount of sense.
This pair has been grinding in this area, and if we can break down below the latest swing low, somewhere near the 0.8540 level, we may see a continuation to the downside. Above, we have the 0.86 level. That, I believe, is a bit of a resistance barrier, as it was previous support.
Ready to trade our daily forecast and analysis? Here’s a list of some of the top forex brokers UK to check out
Christopher Lewis is a technical analyst and market commentator at DailyForex with more than two decades of trading experience in Forex and other leveraged markets. Based in Columbus, Ohio, he specializes in chart-based analysis of major currency pairs, stock indices, commodities, and energy markets, focusing on clear support and resistance levels, trend structure, and risk management. Christopher produces daily written and video analysis for traders who rely on technical setups to navigate volatile market conditions
As seen on: Pairs Of Aces Podcast,The Trader Guy, FXEmpire
Domestic coffee prices today
Coffee prices today in the domestic market increased slightly compared to the previous session. According to giacaphe. com, the average coffee price on August 24 was 96,600 VND/kg, an increase of 300 VND/kg.
In Dak Lak, coffee prices were recorded at 96,500 VND/kg, an increase of 300 VND/kg compared to the previous session.
In Lam Dong, coffee prices reached 96,000 VND/kg, an increase of 300 VND/kg. This is the lowest level among the surveyed areas.
In Gia Lai, coffee prices are at 96,500 VND/kg, an increase of 300 VND/kg.
The old Dak Nong area recorded a level of 96,800 VND/kg, an increase of 300 VND/kg. This is the highest level in today’s price list.
Despite increasing again, the price level is still significantly lower than the 98,000-99,000 VND/kg area recorded last week.
The USD/VND exchange rate according to Vietcombank is recorded at 25,900 VND/USD.
World coffee prices
In the world market, coffee prices decreased in the most recent session.
According to Barchart, the December 2026 Arabica futures contract closed the last session of the week down 6.65 US cents/lb, equivalent to 2.02%. In the same session, the September 2026 Robusta futures contract fell 104 USD/ton, equivalent to 2.81%.
Coffee prices fell as the market expects drier weather in Brazil to help accelerate harvest progress. Robusta alone is also under pressure from increased inventory, as Robusta inventory certified on ICE reached 4,732 lots, the highest level in 8.75 months.
Coffee price assessment
Domestic coffee prices increased slightly after adjustment sessions, but the upward momentum is still quite thin. The sharp decrease in world Robusta in the most recent session may cause the domestic market to continue to be cautious in the coming sessions.
For Vietnam, Robusta London is still a more important reference because this is the main coffee group. When Robusta decreases by nearly 3%, domestic purchasing prices are unlikely to have a strong upward momentum if there is no additional purchasing power from export businesses or supporting factors from actual supply.
From an export perspective, according to the Ministry of Agriculture and Environment, in July, Vietnam exported about 147,600 tons of coffee, worth 639.5 million USD. Accumulated in the first 7 months of the year, coffee exports reached about 1.2 million tons, an increase of 10.8% in volume but a decrease of 11.2% in turnover, to 5.45 billion USD. This development is mainly due to the average export price decreasing by 19.9% compared to the same period, down to 4,537 USD/ton.
Regarding the weather, the National Center for Hydro-Meteorological Forecasting said that on the day and night of August 24, the Central Highlands area will be cloudy, sunny during the day; showers and scattered thunderstorms in the late afternoon and night. Lowest temperature 20-23 degrees C, highest 28-31 degrees C, in some places above 32 degrees C. In thunderstorms, there is a possibility of tornadoes, lightning and strong gusts of wind.
Rainstorms in this season need to be monitored in terms of garden care, pest and disease prevention, and goods preservation.
In the coming sessions, the diễn biến of Robusta London, Arabica New York, USD/VND exchange rate, inventory and demand for export purchases will continue to dominate the domestic price level.





.jpeg "EUR/GBP Forecast 24/08: Stalls at 50-Day EMA (video)")