The main category of All News Articles.
You can use the search box below to find what you need.
[wd_asp id=1]
The main category of All News Articles.
You can use the search box below to find what you need.
[wd_asp id=1]
An upside breakout of the consolidation triangle as it is currently configured is initially triggered above the top trendline but more reliable on a rise above the lower swing high at $4,245. That breakout level confirms a triangle breakout as well as generating a higher swing high and continuation of the bull trend begun from the October swing low. A rising ABCD pattern on the chart shows an initial 78.6% harmonic target for the pattern at $4,280, while price symmetry between the two rising measured moves completes at $4,356. This makes those two price levels the first upside targets on a breakout above the high for November at $4,245 (B).
However, an initial signal for a continuation of the bull trend towards the $4,245 high is on a sustained breakout above Wednesday’s high and the current high of the CD leg of the advance at $4,173. The breakout will need to prove itself once triggered, with a clear pick-up in bullish momentum.
The weekly chart shows a bullish view, with a higher weekly high and higher low established following another successful test of support at the 20-day moving average. That is consistent with dynamic support near the longer-view 10-week average. A weekly close above last week’s high of $4,133 will confirm the weekly bull breakout and show buyers in control on that time frame. Subsequently, if gold stays above this week’s low of $4,040, the potential for the long-term bull trend to resume remains the most likely possibility for now.
Tighter risk management can be achieved by the 20-day average support indicated at $4,075 currently and rising again after a slightly bearish decline. The more significant potential dynamic support line is at the 50-day average at $4,019. A decisive move above $4,173–$4,245 targets $4,280–$4,356; failure to clear the downtrend line risks a lower swing high and test of $4,075 – $4,040.
For a look at all of today’s economic events, check out our economic calendar.
The USD/JPY pair lacks any firm intraday directional bias on Friday and seesaws between tepid gains/minor losses, above the 156.00 mark, through the first half of the European session. Concerns about Japan’s ailing fiscal position, along with the upbeat market mood, offset higher-than-forecast consumer inflation figures from Tokyo. Moreover, a modest US Dollar (USD) uptick acts as a tailwind for the currency pair. That said, speculations that Japanese authorities could step in to stem weakness in the domestic currency and the divergent Bank of Japan (BoJ)-US Federal Reserve (Fed) policy expectations cap spot prices.
Government data showed earlier today that the headline Tokyo Consumer Price Index (CPI) rose 2.7% YoY in November, while a gauge, which excludes volatile fresh food prices, came in at 2.8% YoY. Moreover, the core CPI, excluding both fresh food and energy prices, held steady at 2.8%. The data points to sticky inflation in Japan’s capital city and backs the case for further policy tightening by the Bank of Japan (BoJ). However, BoJ board member Asahi Noguchi signaled on Thursday that the monetary tightening must follow an incremental path, forcing investors to reassess expectations for the central bank’s next policy move.
Meanwhile, Japanese Prime Minister Sanae Takaichi’s cabinet on Friday approved a draft supplementary budget worth ¥18.303 trillion for the fiscal year ending March 2026, stoking concerns about the nation’s fiscal health. The extra budget will be financed by additional bond issuance of at least ¥11.5 trillion. Expectations about the supply of new government debt had pushed longer-dated government bond yields to their highest in more than two decades earlier this month and contributed to the JPY’s relative underperformance. Furthermore, hopes for a Russia-Ukraine peace deal fail to assist the JPY to attract any buying.
The USD, on the other hand, looks to build on Thursday’s modest bounce from an over one-week low and further supports the USD/JPY pair. The upside for the USD, however, seems limited in the wake of dovish Federal Reserve (Fed) expectations. Comments from several Fed officials recently suggested that another interest rate cut in December is a live option. Moreover, reports that White House economic adviser Kevin Hassett has emerged as the frontrunner to become the next Fed Chair, and is expected to enact US President Donald Trump’s calls for sharply lower interest rates, hold back the USD bulls from placing aggressive bets.
Moving ahead, there isn’t any relevant market-moving economic data due for release from the US on Friday. Moreover, the aforementioned mixed fundamental backdrop warrants some caution before placing fresh directional bets and positioning for an extension of this week’s retracement slide from the 158.00 neighborhood, or the highest level since mid-January.
The USD/JPY pair is flirting with the 100-hour Simple Moving Average (SMA) pivotal resistance, just below mid-156.00s, which, if cleared decisively, should pave the way for additional gains. The subsequent move up could allow spot prices to reclaim the 157.00 mark and climb further toward the 157.45-157.50 intermediate hurdle before aiming to challenge the multi-month high, just ahead of the 158.00 round figure.
On the flip side, the 156.00 round figure could protect the immediate downside. This is followed by the weekly low, around the 155.70-155.65 region, below which the USD/JPY pair could accelerate the fall to the 155.00 psychological mark. A convincing break below the latter will be seen as a fresh trigger for bearish traders and set the stage for an extension of a one-week-old downtrend.
Vitamin B6, an essential nutrient also known as pyridoxine, pyridoxal, or pyridoxamine, plays a crucial role in over 140 functions in the body, including brain development, immune system support, and the metabolism of proteins, fats, and carbohydrates. While most people obtain sufficient amounts from a balanced diet rich in poultry, fish, eggs, starchy vegetables, and fruits, many turn to supplements, energy drinks, and multivitamins to boost their intake. Although moderate supplementation is generally safe, prolonged consumption of high doses can cause serious health risks, including nerve damage, numbness, and tingling in the hands and feet, as well as digestive and skin issues. In response, Australia’s Therapeutic Goods Administration (TGA) is introducing stricter rules on high-dose vitamin B6 products, aiming to protect public health while still allowing access to lower-dose supplements.
Vitamin B6, also known as pyridoxine, pyridoxal, or pyridoxamine, is a water-soluble vitamin essential for over 140 functions in the human body. It plays a key role in supporting brain development, maintaining a healthy immune system, and metabolising proteins, fats, and carbohydrates. Without sufficient B6, the body cannot efficiently process nutrients or maintain nerve and blood cell function.Humans cannot produce vitamin B6 naturally, but it is widely available in foods such as poultry, fish, eggs, starchy vegetables, and fruits. For most adults, the recommended daily intake ranges from 1.3 mg to 1.7 mg, which is easily met through a balanced diet. Despite this, many people take additional B6 supplements, often believing that higher doses will boost energy, improve mood, or enhance overall health.
While moderate supplementation is generally safe, excessive vitamin B6 intake can be harmful. High doses may lead to vitamin B6 toxicity, primarily affecting the nervous system. Peripheral neuropathy, a form of nerve damage, is one of the most serious consequences. A systematic review published in Nutrients found that high-dose vitamin B6 supplementation can cause sensory, axonal-type peripheral neuropathy, with symptoms such as numbness and tingling, which often improve after stopping supplementation. In some cases, prolonged high intake can cause difficulty walking, weakness, or muscle coordination problems. Other possible side effects of high-dose B6 include digestive issues, skin lesions, extreme sensitivity to sunlight, and a reduced ability to sense temperature or pain. Toxicity usually occurs only from supplements, not from dietary sources. Experts warn that because B6 is present in multivitamins, energy drinks, and weight-loss products, it’s easy to consume more than intended, often without realising it.
To address these risks, Australia’s Therapeutic Goods Administration (TGA) will implement stricter regulations for B6 supplements starting June 2027:
These measures aim to protect consumers from nerve damage while still allowing access to lower-dose supplements for those who may genuinely need them. Vitamin B6 deficiency in Australia is rare and mostly occurs in older adults or people with alcohol dependence, obesity, or certain kidney, liver, or autoimmune conditions.Internationally, guidelines for safe B6 intake differ. In the US, adults can take up to 100 mg daily without exceeding the official “upper limit”, while Europe sets the tolerable upper intake at 12 mg per day, and Japan ranges between 40–60 mg depending on age and sex. These differences reflect varying approaches to balancing supplement benefits with potential toxicity.
Experts recommend that most adults stick to low-dose vitamin B6 supplements, such as multivitamins or B-complex tablets providing less than 10 mg per day. High-dose products should only be used under medical supervision, particularly for people managing health conditions that may require additional B6.Consumers should watch for warning signs of toxicity, including tingling, burning, or numbness in the hands or feet, and stop supplementation immediately if symptoms occur. Consulting a healthcare professional is essential for managing side effects and determining the right dosage.Reporting adverse effects to the TGA via the Adverse Event Reporting System is also encouraged, as it helps improve the safety of supplements for everyone. The 2027 implementation period allows manufacturers, healthcare providers, and retailers adequate time to update labelling, manage stock, and comply with the new rules.Australia’s updated regulations strike a careful balance between the benefits of vitamin B6 and the risks of prolonged high-dose intake. By enforcing stricter controls for higher-dose products, authorities aim to prevent avoidable nerve damage and other complications, highlighting the principle that more is not always better when it comes to vitamin supplementation.Disclaimer: This article is for general informational purposes only and is not a substitute for professional medical advice, diagnosis, or treatment. Always seek the guidance of a qualified healthcare provider regarding any medical condition or lifestyle change.Also Read: What really happens to your blood sugar when you skip a meal and go too long without eating
XRP price prediction has returned to center stage after the token’s roller-coaster year, with traders now trying to judge whether the latest rally can turn into a sustained breakout. At the time of writing, XRP is trading close to $2.20 with a market capitalization in the low $130 billion range, recovering strongly from last year’s lows but still sitting below the highs recorded earlier in 2025. According to live XRP data on CoinMarketCap (https://coinmarketcap.com/currencies/xrp/), 24-hour trading volumes remain elevated, reflecting renewed interest following the end of Ripple’s long-running legal battle with the U.S. Securities and Exchange Commission and the arrival of new XRP exchange-traded funds on Wall Street.
Legal Clarity And XRP ETF Launches Shift The Narrative
The conclusion of the SEC’s lawsuit against Ripple in August 2025, which saw the company accept a $125 million civil penalty while gaining clarity that XRP traded on public exchanges is not a security, has removed one of the biggest overhangs from earlier XRP price prediction models. At the same time, spot XRP ETFs from issuers such as Franklin Templeton and Grayscale have begun trading in the U.S., attracting nine-figure inflows in their first sessions and helping push XRP back above the key $2 level. Price charts on CoinGecko (https://www.coingecko.com/en/coins/xrp) show that XRP has spent recent weeks consolidating in a wide range between roughly $1.90 and $2.40, a pattern that analysts say could either resolve in a renewed push toward the previous cycle high or in another sharp correction if macro sentiment turns.
Short-Term XRP Price Prediction Ranges Remain Wide
Short-term XRP price predictions for late 2025 generally cluster in a moderate range, with several research desks forecasting that the token could finish the year between about $2.50 and $3.20 if current momentum holds. One widely cited outlook from an exchange-backed research team sees XRP averaging around $2.60 in 2025 and expanding toward the $3.40-$4.50 band in 2026 as institutional usage of Ripple’s cross-border payment rails grows. By contrast, scenario modeling from China’s DeepSeek AI points to a much wider cone of outcomes, suggesting XRP could revisit $1 in a bearish case or spike toward $10 in a strongly bullish environment, underlining just how sensitive any XRP price prediction remains to ETF flows, Federal Reserve interest-rate decisions and overall risk appetite.
Key Technical Levels To Watch For The Next XRP Move
From a charting perspective, technicians note that XRP has already cleared several major resistance zones that capped rallies in previous years, but now faces a dense band of historical supply between roughly $3.00 and its recent seven-year high near $3.65, printed in July after Ripple’s courtroom victory. Some analysts argue that a decisive weekly close above that region could open the door to targets in the $5-$8 area over the next one to two years, particularly if inflows into XRP ETFs remain strong and Ripple continues signing cross-border payment partnerships. Others are more cautious, warning that a break back below $2 could trigger a deeper retracement toward $1.50 or even $1, especially if broader crypto markets stumble or bond yields spike again, reminding traders that even blue-chip altcoins can experience rapid double-digit swings.
Fundamentals Behind The Long-Term XRP Price Prediction
Beyond pure price action, fundamentals continue to play a central role in how analysts frame their XRP price prediction ranges. Ripple’s On-Demand Liquidity and other payment solutions are now running pilots or production flows with banks and fintech firms across regions such as Europe, the Middle East and Asia, with settlement times and fees often measured in seconds and fractions of a cent. At the same time, the XRP Ledger community is pushing ahead with upgrades around EVM-compatible sidechains, tokenization and DeFi tooling, developments that could expand XRP’s role beyond cross-border remittances alone. Supporters say that if this mix of institutional adoption and on-chain innovation continues, it could justify higher long-term valuation bands, even if the token remains volatile over shorter time frames.
Where Pepenode Fits Into The XRP Price Prediction Conversation
Against this backdrop, some market commentators are now pairing their XRP price prediction work with analysis of high-beta altcoins that could outperform if the broader trend remains positive. One project frequently mentioned in that context is Pepenode (https://pepenode.io/), a meme-themed “mine-to-earn” ecosystem where users build virtual server rooms filled with digital nodes instead of deploying real-world mining hardware. The platform’s design allows participants to allocate PEPENODE tokens to upgrade their simulated rigs and compete on leaderboards, with rewards linked to activity across a basket of meme coins rather than a single asset. Because the project sits at the intersection of gaming, mining narratives and meme culture, it has started to appear in the same headlines as XRP whenever analysts discuss speculative side bets for the next phase of the crypto cycle.
Comparing XRP’s Risk Profile With Pepenode’s Speculative Upside
Dedicated Pepenode price forecasts are, unsurprisingly, far more aggressive than most mainstream XRP price prediction ranges. One recent analytical note on the project suggests that PEPENODE could reach around $0.005 in 2025 and potentially climb above $0.10 by 2030 if its gamified mining model gains sustained traction, projections that imply multiples of several hundred percent from current micro-cap levels. While such targets highlight why Pepenode (https://pepenode.io/) is being framed as a high-risk, high-reward complement to large-cap assets like XRP, they also underline the speculative nature of the trade: the token’s future path depends on successful game rollout, exchange liquidity and ongoing community engagement, factors that can change rapidly in the meme-coin segment.
Outlook: XRP Price Prediction And High-Beta Meme Coin Themes
For now, the clearest takeaway for traders following XRP price prediction headlines is that the token has finally moved beyond its regulatory limbo and into a new phase driven by ETF adoption, macro conditions and real-world payments growth, even as technical analysts debate whether $2 will hold as a durable support zone. In parallel, smaller plays such as Pepenode continue to capture attention as leveraged expressions of risk-on sentiment in the meme-coin space, capable of amplifying both gains and losses. As always in crypto, all of these projections remain speculative, and observers stress that anyone considering exposure to XRP or emerging altcoins should treat third-party forecasts as informational only, combine them with independent research and personal risk management, and be prepared for outcomes that could diverge sharply from even the most carefully modeled predictions.
Buchenweg 15, Karlsruhe, Germany
For more information about Pepenode (PEPENODE) visit the links below:
Website: https://pepenode.io/
Whitepaper: https://pepenode.io/assets/documents/whitepaper.pdf
Telegram: https://t.me/pepe_node
Twitter/X: https://x.com/pepenode_io
Disclosure: Crypto is a high-risk asset class. This article is provided for informational purposes and does not constitute investment advice.
CryptoTimes24 is a digital media and analytics platform dedicated to providing timely, accurate, and insightful information about the cryptocurrency and blockchain industry. The enterprise focuses on delivering high-quality news coverage, market analysis, project reviews, and educational resources for both investors and enthusiasts. By combining data-driven journalism with expert commentary, CryptoTimes24 aims to become a trusted global source for emerging trends in decentralized finance (DeFi), NFTs, Web3 technologies, and digital asset markets.
This release was published on openPR.
No news for EURJPY pair’s new sideways trading and its fluctuating near 181.15, but its stability above the support level near 179.40 and attempting to form extra support at 180.25 level, these factors support the chances of renewing the bullish attempts, attempting to breach the barrier at 181.75, targeting new positive stations that might begin at 182.30 reaching the main target at 183.05.
Note that stochastic approach from 80 level will increase the chances of achieving extra bullish momentum, to pave the way for achieving the breach and reaching the suggested targets.
The expected trading range for today is between 180.35 and 182.30
Trend forecast: Bullish
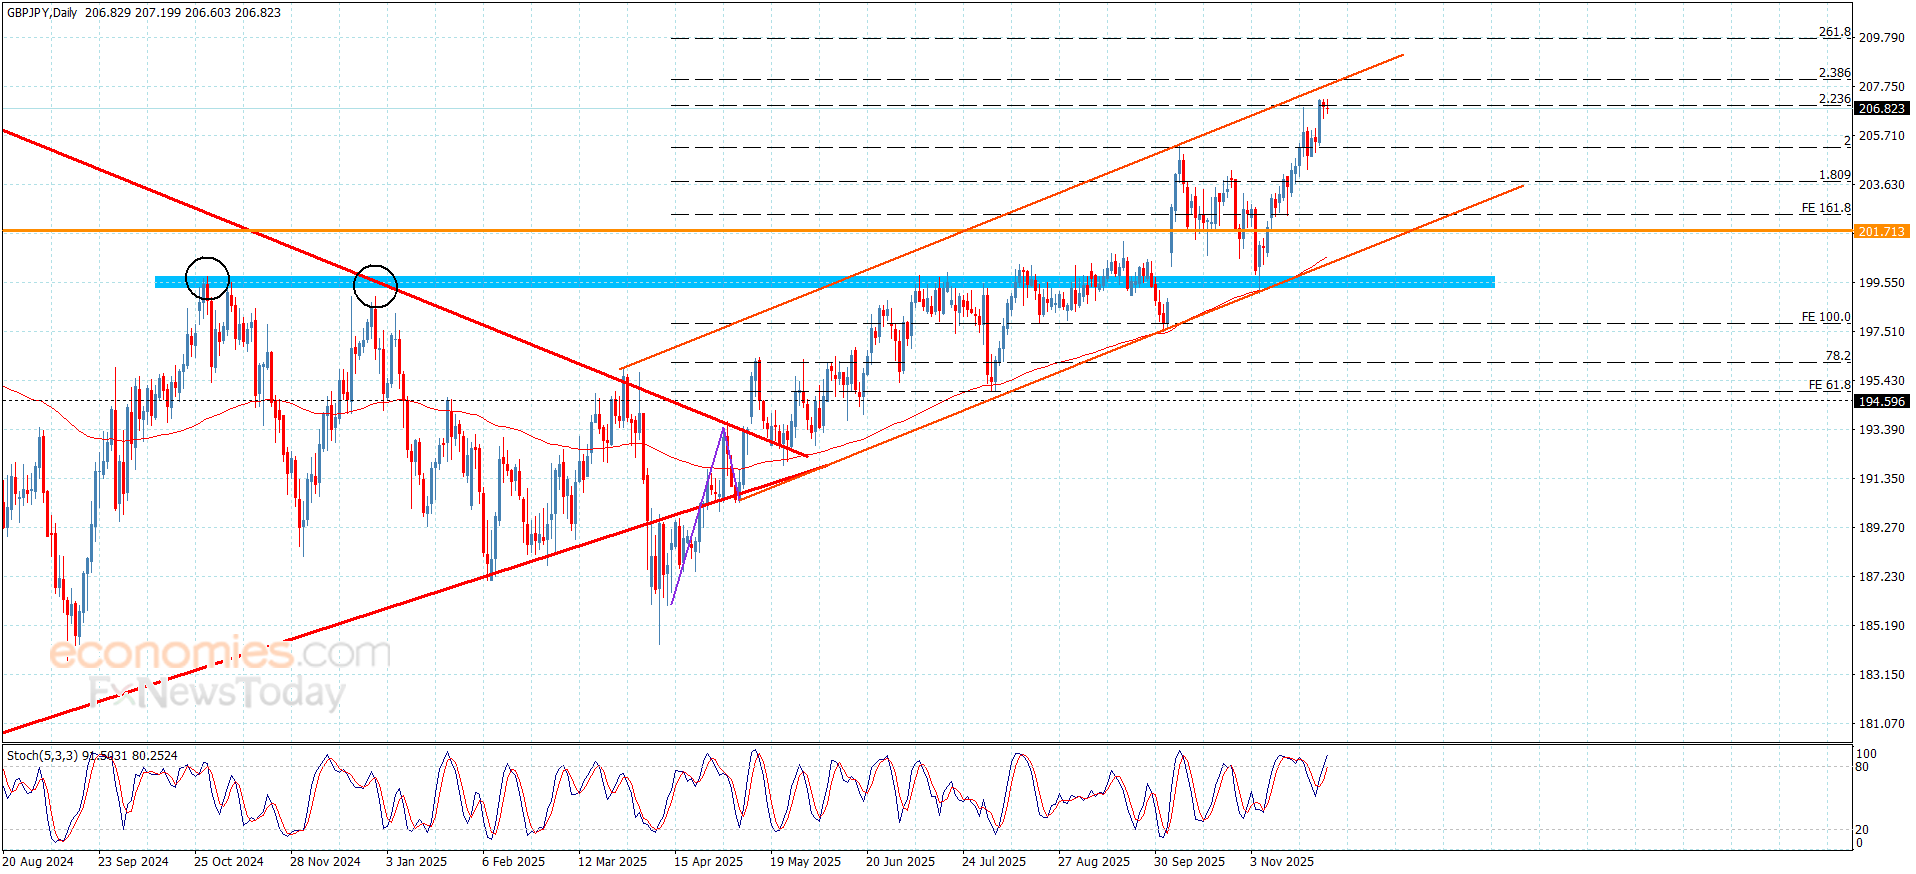
Despite the weakness of the GBPJPY pair’s trading, there are positive factors that begin by the main stability within the bullish channel’s levels, by the continuation of forming extra support at 205.20 level, these factors confirm the continuation of the positivity in the near and medium period.
Providing positive momentum by stochastic reach towards overbought level makes us prefer attacking the resistance of the bullish channel on 207.70, confirming that breaching it is important to record new gains by its rally towards 208.25 and 208.70.
The expected trading range for today is between 206.25 and 207.70
Trend forecast: Bullish
InsightAce Analytic Pvt. Ltd. announces the release of a market assessment report on the “Global Pandan Tea Market – (By Form (Loose Leaves, Powder, Tea Bags), By Distribution Channel (Offline, Online)), Trends, Industry Competition Analysis, Revenue and Forecast To 2031.”
According to the latest research by InsightAce Analytic, the Global Pandan Tea Market Size is valued at USD 292.3 million in 2023 and is predicted to reach USD 514.5 million by the year 2031 at a 7.5% CAGR during the forecast period for 2024-2031.
Request for Sample Pages:
https://www.insightaceanalytic.com/request-sample/2769
Pandan tea, an aromatic herbal infusion derived from pandan leaves, is known for its delicate sweetness and soothing fragrance. Traditionally favored in Southeast Asian cuisine, it has gained popularity due to its calming properties and numerous health benefits.
Tea made from pandan leaves is thought to help with digestion & lower blood sugar and inflammation because of the high levels of antioxidants in the leaves. Pandan tea is seeing increased demand as health-conscious consumers look for sugar-free and caffeine-free beverage options. However, high production costs and limited knowledge about pandan tea have hindered market growth. In addition, a growing interest in self-care and health is making pandan tea more popular. Growing numbers of people are looking for natural, healthy ways to improve their health. Because it is soothing and helpful, pandan tea is a popular choice, thereby boosting market growth.
List of Prominent Players in the Pandan Tea Market:
• Tsaa Laya
• ETTE TEA COMPANY
• My Blue Tea
• Rishi Tea & Botanicals
• FreshDrinkUS
• Dilmah Ceylon Tea Company PLC
• T2 Tea
• Zhejiang Chunli Tea Co., Ltd.
• WILD & TEA
• Thienthanhtea Ltd.
• Tea Too Pty Ltd.
• Thienthanhtea Ltd
• Gong Cha
• Royal T Group Pte Ltd
Market Dynamics:
Drivers-
The increasing preference for herbal and natural remedies as alternatives to conventional caffeinated beverages is a key factor fueling the growth of the pandan tea market. Health-conscious consumers are drawn to its distinctive flavor and potential wellness benefits, making it a sought-after choice. Additionally, the rising global appreciation of Southeast Asian cuisine has contributed to greater demand for pandan tea. The growing interest in fragrant, soothing beverages with medicinal properties, coupled with the expanding wellness and self-care movement, is further driving market expansion.
Curious About This Latest Version Of The Report? Enquiry Before Buying: https://www.insightaceanalytic.com/enquiry-before-buying/2769
Challenges:
Despite its growing appeal, the pandan tea market faces several challenges that may hinder its expansion. High production and processing costs, along with limited consumer awareness, remain significant barriers. Additionally, pandan tea competes with more established herbal teas, making it a niche product in the global market. Seasonal variations in pandan leaf yield can also affect the supply chain, leading to potential price fluctuations.
Regional Trends:
The Asia Pacific region is expected to hold a significant market share in pandan tea sales, with urban populations increasingly embracing wellness-focused lifestyles. The rising awareness of natural health products and the region’s cultural familiarity with pandan-based beverages contribute to its expansion.
In Europe, pandan tea is gaining popularity due to the increasing demand for unique, functional beverages. Consumers in this region are becoming more knowledgeable about the health benefits of herbal teas, and the rising preference for organic and all-natural products is further driving market growth. This heightened interest in innovative wellness drinks positions Europe as a key emerging market for pandan teaRecent Developments:
• In August 2024, Dilmah, a world-renowned Sri Lankan family-owned tea firm, and the Climate Vulnerable Forum (CVF) inked an MoU to promote climate resilience and sustainable agriculture.
Get Specific Chapter/Information From The Report:
https://www.insightaceanalytic.com/customisation/2769
Segmentation of Pandan Tea Market-
By Form-
• Loose Leaves
• Powder
• Tea Bags
By Distribution Channel-
• Offline
• Online
By Region-
North America-
• The US
• Canada
• Mexico
Europe-
• Germany
• The UK
• France
• Italy
• Spain
• Rest of Europe
Asia-Pacific-
• China
• Japan
• India
• South Korea
• South East Asia
• Rest of Asia Pacific
Latin America-
• Brazil
• Argentina
• Rest of Latin America
Middle East & Africa-
• GCC Countries
• South Africa
• Rest of the Middle East and Africa
Get More Information: @
https://www.insightaceanalytic.com/report/pandan-tea-market/2769
About Us:
InsightAce Analytic is a market research and consulting firm that enables clients to make strategic decisions. Our qualitative and quantitative market intelligence solutions inform the need for market and competitive intelligence to expand businesses. We help clients gain a competitive advantage by identifying untapped markets, exploring new and competing technologies, segmenting potential markets, and repositioning products. Our expertise is in providing syndicated and custom market intelligence reports with an in-depth analysis with key market insights in a timely and cost-effective manner.https://www.insightaceanalytic.com/images_data/148861653.
Contact Us:
info@insightaceanalytic.com
InsightAce Analytic Pvt. Ltd.
Official Site Visit: www.insightaceanalytic.com
Tel.: +1 607 400-7072
Email: info@insightaceanalytic.com
Follow US On :
LinkedIn @ https://www.linkedin.com/company/insightace-analytic-pvt-ltd/
Twitter @ https://x.com/MInsightace
YouTube @ https://www.youtube.com/@InsightAceAnalytic
Instagram @https://www.instagram.com/insight_ace_analytic/
This release was published on openPR.
Dogecoin Price Prediction (https://coinmarketcap.com/currencies/dogecoin/) sounds simple as long as the market keeps delivering clear trends, but once everything slows down and every move becomes a test of patience, the outlook changes completely. Lately DOGE has been trading more like a slow negotiation between patient buyers and exhausted sellers, with volume coming in short bursts instead of one big panic candle. In that environment, any honest Dogecoin Price Prediction shifts toward questions of liquidity, market structure, and resilience. At the same time, Pepenode (https://pepenode.io/) is quietly showing up in the same discussions as a fresher, smaller meme option for traders who want extra volatility without walking away from DOGE entirely.
From Hype To Habits: How Traders Now Look At DOGE
Across the bigger coins the mood has shifted from full risk panic into a more mixed phase where people still respect downside yet are willing to test new positions if conditions are not completely hostile. That matters for Dogecoin because the coin feeds on narrative, but it survives on the boring mechanics of how orders actually clear across exchanges during busy overlaps between European and United States trading hours. Larger desks talk less about jokes and more about whether spreads stay tight, whether depth holds when aggressive orders arrive and whether the current Dogecoin Price Prediction still makes sense once those day to day habits are taken seriously.
Dogecoin Price Prediction In A Market That Refuses To Trend Cleanly
One of the awkward parts of building any Dogecoin Price Prediction right now is that the broader market does not seem interested in giving anyone a straight line to work with. Majors rotate between cautious optimism and fast risk cuts, while altcoin liquidity appears and disappears like a tide that does not follow a simple schedule. For DOGE this usually means long stretches of sideways movement where only the most patient scalpers are active, interrupted by sudden bursts that punish traders who fell asleep on their risk limits. Instead of simple up or down calls, many teams sketch out conditional paths that depend on how those choppy windows play out.
Signals Hiding Behind The Dogecoin Ticker
Desks that still allocate time to Dogecoin rarely stare only at the price line any more, they track a whole cluster of background signals that shape their conviction. Some of them watch whether spot markets start to move before derivatives, whether open interest grows in a healthy way or simply spikes around obvious headlines and whether funding data suggests overcrowded long or short positioning. Others lean on educational sources such as Binance Academy and similar explainers to keep newer traders grounded in what DOGE (https://www.binance.com/en/academy/articles/what-is-dogecoin) actually represents on chain. Those details may not sound exciting, yet they often decide whether a Dogecoin Price Prediction survives more than one news cycle.
Key Zones That Quietly Anchor The DOGE Conversation
Even when chart layouts differ, many teams end up watching similar regions on the Dogecoin chart because history keeps dragging attention back to the same places. Under current price sits a support band that has been tapped several times without giving way completely, which some traders treat as the level that needs to hold if the constructive Dogecoin Price Prediction is going to remain believable. Higher up sits a messy cluster of old supply, trapped longs and prior failures that acts like a ceiling until proven otherwise. Between those two areas a lot of intraday action amounts to noise, so many desks simply wait for clean reactions before making any changes to size.
Pepenode As A Parallel Bet On Meme Risk
While DOGE keeps its place as the veteran meme asset, Pepenode (https://pepenode.io/) is starting to show up in notes from desks that like to keep one eye on newer narratives without going all in on untested experiments. People who already run a core Dogecoin position sometimes treat Pepenode as a smaller satellite, a way to express belief in another meme driven community while still anchoring most exposure in the more liquid name. Attention around the official site reflects that cautious interest, with traders reading through token distribution, roadmap hints and communication habits before deciding whether Pepenode deserves a place next to any Dogecoin Price Prediction they are currently using.
What Makes The Pepenode Story Feel Different To Some Desks
For a new meme project to get mentioned in the same breath as DOGE, it usually needs something other than loud slogans and temporary social buzz, and that is where Pepenode has quietly started to build a small case. Some early observers note that messaging so far has focused more on pacing, community rhythm and realistic expectations than on instant riches, which tends to sit better with desks that have been burned by earlier hype cycles. Liquidity is still developing, spreads are not always perfect and volume can be patchy, yet for traders who enjoy spotting stories earlier than the crowd those imperfections are part of the opportunity rather than an immediate disqualifier.
Risk Management When Splitting Size Between DOGE And Pepenode
Traders who handle both Dogecoin and Pepenode usually accept that one of the few variables they can genuinely control is position sizing, so they build their process around that dull but critical point. Before entering they write down the level that would prove a given Dogecoin Price Prediction wrong and then apply the same logic to any Pepenode idea, making sure that both stops together still leave room to breathe if the whole meme complex wobbles. Adds tend to happen after pullbacks into predefined regions instead of on candles that already scream exhaustion, while partial profit taking is used not as a victory lap but as a way to keep accounts steady enough to participate in the next setup.
Signals That Can Break A Dogecoin Price Prediction In Hours
Even the most careful Dogecoin Price Prediction can unravel in a single difficult session when larger forces line up the wrong way, so traders watch for a handful of warning signs that usually deserve immediate respect. A sharp liquidity drain in Bitcoin or Ethereum often bleeds straight into meme names, especially when books are already thin after a period of complacency. Exchange outages, sudden rule changes or security scares can freeze risk appetite within minutes, leaving both DOGE and Pepenode hunting for bids in places that looked safe a day earlier. Some desks also monitor on chain activity, and when usage slides while leverage metrics stay hot, they often respond by cutting meme exposure faster than usual.
Why Some Traders Keep Coming Back To DOGE And Pepenode
Despite the stress, a certain type of trader keeps returning to Dogecoin and now increasingly glances at Pepenode (https://pepenode.io/), not because they expect straight line gains but because they see repeatable structure inside the chaos. A simple routine helps, for example checking DOGE only at fixed times, refreshing key levels once per week and reviewing whether the current Dogecoin Price Prediction still matches what the market is actually doing. Pepenode then sits on a nearby watchlist as a high beta companion, granted a smaller allocation yet monitored with the same discipline. That kind of measured approach may not look flashy, but over multiple cycles it tends to outlast the louder strategies that burn out on the first real drawdown.
Buchenweg 15, Karlsruhe, Germany
For more information about Pepenode (PEPENODE) visit the links below:
Website: https://pepenode.io/
Whitepaper: https://pepenode.io/assets/documents/whitepaper.pdf
Telegram: https://t.me/pepe_node
Twitter/X: https://x.com/pepenode_io
Disclosure: Crypto is a high-risk asset class. This article is provided for informational purposes and does not constitute investment advice.
CryptoTimes24 is a digital media and analytics platform dedicated to providing timely, accurate, and insightful information about the cryptocurrency and blockchain industry. The enterprise focuses on delivering high-quality news coverage, market analysis, project reviews, and educational resources for both investors and enthusiasts. By combining data-driven journalism with expert commentary, CryptoTimes24 aims to become a trusted global source for emerging trends in decentralized finance (DeFi), NFTs, Web3 technologies, and digital asset markets.
This release was published on openPR.
Pudgy Party was one of the breakout stars of this year’s GAM3 Awards 2025, earning Best Mobile Game and Best Casual Game, and firmly establishing itself as a leading force in the evolving web3 gaming landscape. Its double victory highlights the game’s broad appeal, strong design identity, and standout execution during a year of unprecedented growth and engagement across the industry.
Competing among more than 900 nominated titles and 62 finalists, Pudgy Party distinguished itself with its accessible gameplay, polished mobile experience, and seamless integration of web3 features. Its wins recognized not only its ability to attract and entertain a wide audience but also its success in setting a new standard for casual and mobile-focused blockchain gaming.
The game’s reception reflects a growing shift toward lightweight, highly social experiences in the sector – games designed to be easy to pick up yet deeply engaging for long-term players.
The awards were announced on November 21 in Manila during our global GAM3 Awards ceremony, which showcased some of the most influential developments shaping web3 gaming today. This year’s event broke engagement records, including:
900+ nominated games
700+ nominated creators
62 finalists
80+ jurors
376K+ voters casting more than 2 million votes
600K+ total livestream views, peaking at 75K concurrent viewers
80M+ global impressions
These numbers reflect the rising enthusiasm for titles like Pudgy Party, which enjoyed strong visibility and community conversation leading up to the awards.
Pudgy Party’s dual victory came through our GAM3 Awards’ comprehensive judging system. More than 80 jurors – including representatives from Krafton, Konami, Sony, Ubisoft, Google, Amazon, Animoca Brands, Immutable, and Avalanche – contributed 90% of the vote, with the remaining 10% coming from the global community.
This combination of expert insight and community support underscores the game’s wide-reaching impact and credibility across multiple segments of the industry.
While Off The Grid took home Game of the Year, Pudgy Party solidified its place among the most celebrated titles of the evening. Its success alongside other winners such as Project O, The Bornless, Sunflower Land, and Atia’s Legacy highlights both the diversity of this year’s lineup and the increasing competitiveness of the mobile and casual categories.
Our GAM3 Awards 2025 featured a record-setting prize pool exceeding $7 million, supported by major partners including Forkast, Magic Eden, Hyperplay, Sequence, BGA, Amazon AWS, and AD Gaming. Major backing from platforms like OpenSea, Sui, Arbitrum, and Remix strengthened the industry environment in which games like Pudgy Party continue to thrive.
This momentum signals strong market confidence in developers building scalable, accessible, community-driven web3 experiences.
Following its dual triumph, Pudgy Party enters its next chapter with heightened visibility, strengthened community support, and expanded industry recognition. Its wins position it as a flagship example of what mobile and casual web3 gaming can achieve on a global stage.
With our next GAM3 Awards scheduled for November 2026, Pudgy Party’s ongoing development and player growth will be closely watched as the web3 gaming sector continues to evolve.
The game’s success marks a broader trend toward fun-first, frictionless, community-powered experiences – cementing Pudgy Party as one of the defining titles of 2025 and a standard-setter for what comes next.
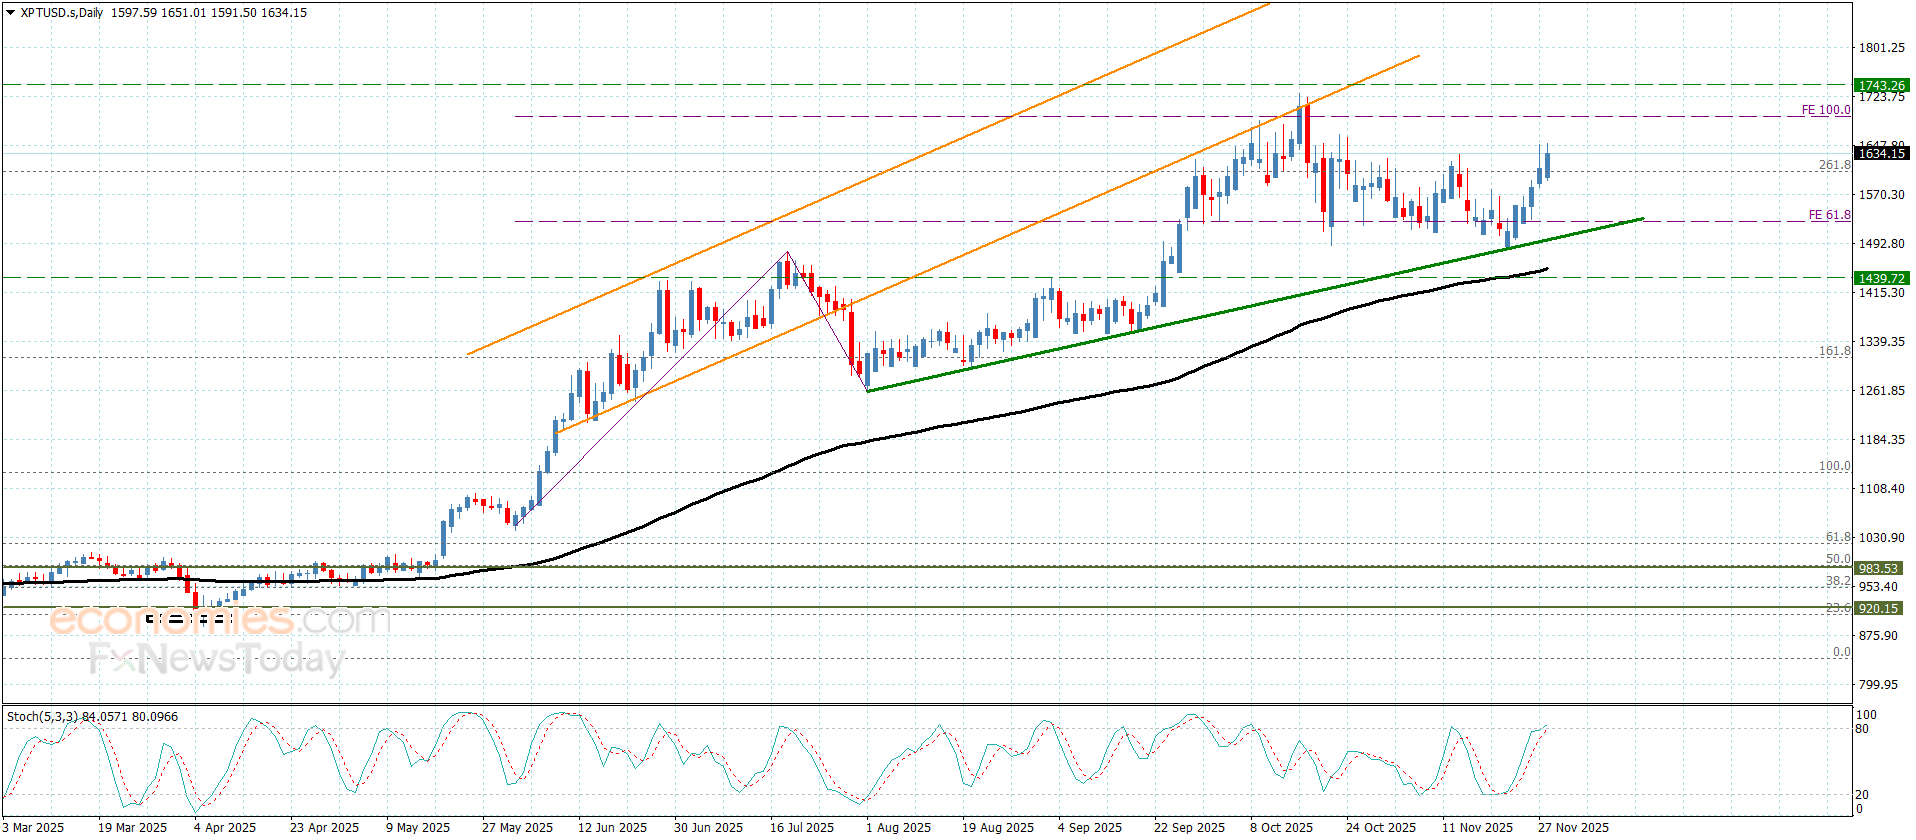
Platinum price succeeded in providing new positive close above $1605.00 level, to confirm its readiness to resume the bullish trend, fluctuating near $1635.00.
The continuation of providing positive signals by the main indicators will ease the mission of breaching $1645.00 level, to open the way for recording extra gains that might begin at $1695.00 and $1745.00.
The expected trading range for today is between $1600.00 and $1695.00
Trend forecast: Bullish