The main category of All News Articles.
You can use the search box below to find what you need.
[wd_asp id=1]
The main category of All News Articles.
You can use the search box below to find what you need.
[wd_asp id=1]
At 9 a.m. Eastern Time today, oil was priced at $104.68 per barrel with Brent serving as the benchmark (we’ll explain different benchmarks later in this article). That’s a drop of $4.08 compared with yesterday morning and around $40.46 higher than the price one year ago.
It’s impossible to forecast oil prices with detailed precision. Many different elements affect the market, but ultimately it boils down to supply and demand. When worries about economic recession, war, and other large-scale disruptions increase, oil’s path can shift fast.
Gas prices at the pump don’t only track crude oil. They also include what it takes to refine and move that fuel, the taxes layered on top, and the extra markup your local station adds to stay in business.
Since crude oil generally makes up a majority of the per-gallon cost, changes in its price have an outsized impact. When oil surges, gas prices typically rise in tandem. But when oil retreats, gas prices often lag on the way down, a trend sometimes described as “rockets and feathers.”
In case of emergency, the U.S. has a store of crude oil known as the Strategic Petroleum Reserve. Its primary purpose is energy security in case of disaster (think sanctions, severe storm damage, even war). But it can also go a long way toward softening crippling price hikes during supply shocks.
It’s not a long-term answer and is more meant to provide temporary relief, assisting consumers and keeping critical parts of the economy running, like key industries, emergency services, public transportation, etc.
Both oil and natural gas are key sources of the energy we use every day. Because of this, a big change in oil prices can affect natural gas. For example, if oil prices increase, some industries may swap natural gas for some segments of their operations where possible, which increases demand for natural gas.
To gauge oil’s performance, we often turn to two benchmarks:
Between these two, Brent better represents global oil performance because it prices much of the world’s traded crude. And, it’s often the best way to track historical oil performance. In fact, even the U.S. Energy Information Administration now uses Brent as its primary reference in its Annual Energy Outlook.
Looking at the Brent benchmark across several decades, oil has been anything but steady. It’s seen spikes due to factors such as wars and supply cuts, and it’s also seen crashes from global recessions and an oversupply (called a “glut”). For example:
All to say, oil’s historical performance has been anything but smooth. Again, it’s hugely affected by wars, recessions, OPEC whims, evolving energy initiatives and policies, and much more.
Looking to stay up-to-date regarding the latest energy developments? Check out our recent coverage:
The current price of oil per barrel depends largely on supply and demand, including news about potential future supply and demand (geopolitics, decisions made by OPEC+, etc.). In the U.S., prices also move based on how friendly an administration is to drilling, as it can affect future supply. For example, 2025 saw the Trump administration move to reopen more than 1.5 million acres in the Coastal Plain of the Arctic National Wildlife Refuge for oil and gas leasing, reversing the Biden administration’s policy of limiting oil drilling in the Arctic.
The price of oil updates constantly when the “futures” markets are open. A futures market is effectively an auction where people agree to buy or sell oil in the future. As long as people and companies are trading contracts, the oil price is changing.
In short, shale is rock that contains oil and natural gas. Think of shale as energy yet to be tapped. The more shale the U.S. accesses, the more energy we’ll have—and the more easily oil prices can keep from spiking as much thanks to a greater supply.
When oil is expensive, it tends to make everyday items cost more. This can be related to energy (your heating, gas utilities, etc.), but it’s also due to the logistics involved with making those items accessible to you. Shipping, for example, can affect the price of things at the grocery store, as it’s more expensive to get those products from warehouses and farms onto the shelf.
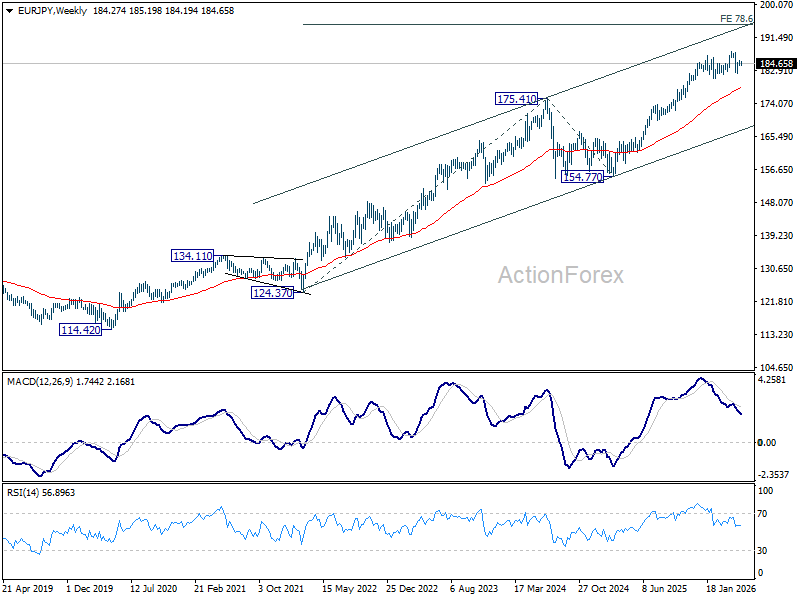
EUR/JPY was bounded in range below 185.44 last week and outlook is unchanged. Initial bias remains neutral this week first. Fall from 187.93 should have completed at 182.01. Above 185.44 will extend the rebound from there to retest 187.93. However, firm break of 184.02 support will bring deeper decline back to 182.01.
In the bigger picture, the pullback from 187.93 is steep, there is no sign of reversal yet. Uptrend from 114.42 (2020 low) is still expected to resume at a later stage to 78.6% projection of 124.37 (2022 low) to 175.41 (2025 high) from 154.77 at 194.88. However, sustained break of 55 W EMA (now at 178.27) will argue that it’s already in a medium term down trend to 175.41 resistance turned support and below.

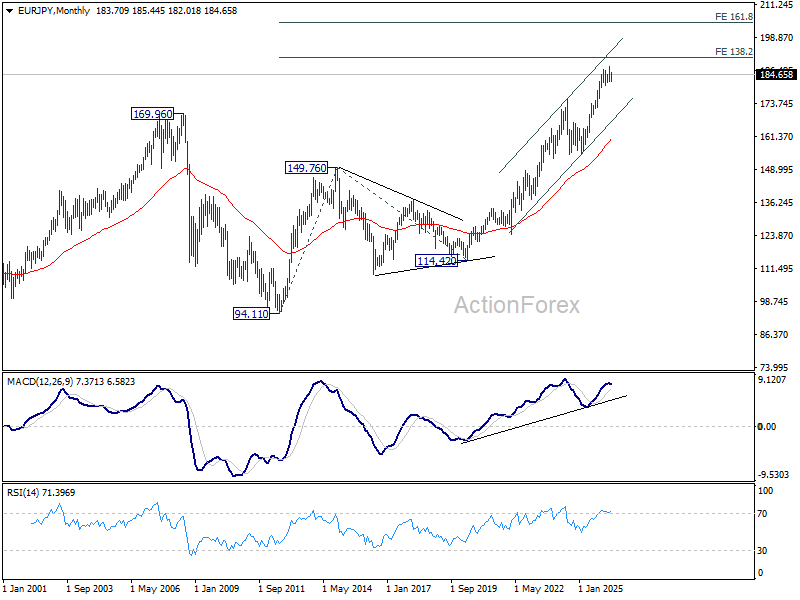
In the long term picture, up trend from 94.11 (2021 low) is in progress. Next target is 138.2% projection of 94.11 to 149.76 (2014 high) from 114.42 (2020 low) at 191.32. This will remain the favored case as long 55 W EMA (now at 178.27) holds.
Copper price was forced to provide weak trading due to the continuation of the main indicators’ contradiction against the negative stability below the barrier at $6.3800 level, to force it to delay the corrective decline and hold near $6.2800 level.
Note that confirming the dominance of the bearish corrective trend needs to break the initial support at $6.1000, to ease the mission of the corrective stations, which might begin at $5.9500 and $58000, while surpassing the barrier will provide a chance for recording some gains, to expect attacking the resistance near $6.5800.
The expected trading range for today is between $6.1000 and$6.3500
Trend forecast: Bearish
The Japan caffeine free ground coffee market sits within the broader consumer goods and FMCG landscape, where coffee consumption per capita exceeds 3.5 kg annually, placing Japan among the top Asian markets. Decaffeinated ground coffee, however, remains a small niche. Its penetration of roughly 2–4% of ground coffee volume contrasts with leading markets such as the United States (12–15%) and Germany (10–13%). This gap reflects both cultural preferences for full-caffeine brews and a historically limited range of decaf offerings.
The product is a tangible, shelf-stable consumer good sold predominantly through grocery retail, convenience stores, and increasingly through e-commerce. Decaf ground coffee in Japan is almost exclusively roasted and ground domestically from imported decaffeinated green beans; no raw coffee is grown locally, and decaffeination infrastructure does not exist at commercial scale within the country. The market is thus shaped by global supply chains for green beans and decaffeination services, regional trade agreements, and domestic branding strategies.
Over the past five years, the segment has gradually moved from a functional alternative for medical caffeine restrictions to a lifestyle choice, supported by improved decaffeination technologies that preserve aroma and flavour. This evolution is expected to continue as health awareness deepens among Japan’s ageing population and younger cohorts adopt flexible caffeine consumption patterns.
Although exact absolute volumes for the caffeine free ground coffee market are not publicly disaggregated in official statistics, market signals point to steady, above-average expansion. The segment is likely growing at a compound annual rate of 4–6% in volume terms from a 2024–2025 base, compared with 1–2% for the overall ground coffee market in Japan. Decaf ground coffee retail volume is estimated to have reached 6,000–9,000 tonnes in 2025, representing roughly 2.5–3.5% of total ground coffee consumption.
Growth is underpinned by structural demographic shifts: Japan’s population aged 65 and older will exceed 33% by 2035, a cohort with higher incidence of doctor-recommended caffeine reduction. Additionally, the evening coffee occasion—once rare due to caffeine concerns—is being actively cultivated by roasters through decaf offerings, particularly in the premium segment. Foodservice and office coffee service (OCS) channels are also increasing decaf menu presence, with several major OCS operators reporting 8–12% year-on-year growth in decaf pod sales in 2024.
The market’s relatively small base means that even modest shifts in consumer behaviour can translate into double-digit growth rates for individual brands. Over the forecast horizon to 2035, market volume could double if decaf’s share of ground coffee rises to 5–7%, which is plausible given the convergence of health drivers, product quality improvements, and marketing investment.
Demand for caffeine free ground coffee in Japan breaks down clearly by process type, application, and buyer group. By decaffeination method, the Swiss Water Process and CO2 Process segments together account for an estimated 40–50% of volume, driven by consumer preference for “chemical-free” claims. Ethyl Acetate (sugar cane) process holds roughly 20–25%, while direct solvent (methylene chloride) methods have declined to under 15% due to negative perception. At-home consumption dominates end-use, representing 60–70% of volume, as health-conscious households integrate decaf into morning or evening routines.
Office and workplace consumption accounts for 15–20%, with simple drip or pour-over formats preferred due to convenience. Foodservice (cafés, small hotels, B&Bs) makes up the remainder; however, many specialty coffee shops still prioritise whole bean decaf, limiting ground decaf foodservice penetration. Buyer groups are led by individual consumers—particularly those aged 45+, health-oriented, and caffeine-sensitive. Grocery retail category managers increasingly allocate shelf space to decaf, typically assigning 2–4% of the coffee aisle, up from 1–2% a decade ago.
Corporate procurement for office supply is a smaller but growing channel, with procurement managers responding to employee wellness requests. End-use sectors are predominantly consumer households; healthcare facilities (hospitals, nursing homes) represent a niche but stable demand for decaf in institutional catering. Premium/specialty decaf brands are gaining share within the home segment, while private label remains concentrated in the value tier, accounting for an estimated 10–15% of retail decaf volume.
Pricing in Japan’s caffeine free ground coffee market is stratified across four distinct layers. Ultra-value private label and economy brands retail at ¥600–900 per 200g bag, typically using lower-cost ethyl acetate decaf and commodity-grade washed arabica. Mainstream national brands—such as AGF, UCC, and Key Coffee’s mass-market lines—sit at ¥800–1,200, offering consistent flavour and widespread availability. Premium/specialty brands, including imported names like Illy Decaf and Lavazza Dek, along with domestic specialty roasters, command ¥1,500–2,500 per 200g, often labelled Swiss Water or CO2 processed and single-origin.
Super-premium artisan DTC brands can exceed ¥3,000 for small-batch, micro-lot decaf. The 15–25% premium over regular ground coffee across all tiers reflects the added cost of decaffeination, which adds roughly ¥150–250 per kg of green bean input. Logistics for imported decaf green beans—shipped from dedicated processing hubs in Canada, Germany, or Colombia—incur freight and storage costs that can add 10–15% to landed cost.
Currency fluctuations also affect pricing: the yen’s depreciation against the US dollar in 2023–2025 raised import costs by an estimated 20–30% for green coffee, compressing margins for roasters that hesitated to pass through full increases. Domestic roasting, packaging, and distribution costs are relatively stable, but packaging lead times during peak demand (pre-summer and year-end seasons) can create short-term price volatility for specialty packs. Organic certification and fair-trade premiums add ¥200–400 per pack at retail, a growing sub-segment that appeals to younger urban buyers.
The competitive landscape for caffeine free ground coffee in Japan is shaped by a mix of global brand owners, domestic mass-market roasters, and an emerging cohort of specialty challengers. Among global brand owners, Nestlé’s Nescafé Gold Blend Decaf and Starbucks’ retail decaf offerings hold significant shelf presence, distributed through grocery and convenience channels. Domestic mass-market portfolio houses—UCC Holdings, Key Coffee, and AGF (Ajinomoto General Foods)—dominate the mid-tier segment, each offering decaf lines that leverage established distribution networks and consumer trust.
These firms source decaf green beans primarily from Swiss Water (Canada) and CO2-process (Germany) suppliers under long-term contracts. Premium and innovation-led challengers include Doutor Coffee’s retail line, along with specialty roasters such as Kurasu (Kyoto) and Obubu Tea & Coffee, which focus on single-origin decaf and direct-to-consumer sales. The private-label segment is led by major retailer groups—Seven & i Holdings (Seven Premium brand), Aeon (Topvalu), and Don Quijote (Donki)—which use contract manufacturing and white-label partners for decaf ground coffee.
Vertical DTC decaf specialists, though small in volume, are growing rapidly through subscription models and social media marketing. Competition is intensifying as more roasters introduce decaf to capture the growing health-conscious consumer base. Market evidence points to moderate concentration: the top five branded suppliers likely control 65–75% of decaf ground coffee volume, with private label taking 10–15% and specialty brands the remainder. Product differentiation increasingly hinges on decaffeination process claims, origin transparency, and packaging technology (aroma-lock bags, resealable formats) rather than price alone.
Japan has no coffee bean cultivation due to its temperate climate; all green coffee beans are imported. Domestic production of caffeine free ground coffee therefore consists entirely of roasting, grinding, and packaging of decaffeinated green beans received from overseas processing hubs. Roasting capacity in Japan is substantial—the country operates over 200 industrial and artisanal roasting facilities—but decaffeination is not performed at any meaningful scale domestically.
The absence of local decaffeination plants is driven by high capital investment requirements (a Swiss Water or CO2 plant typically costs US$20–40 million), stringent environmental regulations for solvent use, and the lack of sufficient green coffee throughput to achieve economies of scale for a dedicated decaf-only operation. Consequently, all decaf ground coffee sold in Japan starts with green beans that have been decaffeinated in origin countries or specialised processing centres: Swiss Water Process in Vancouver, Canada; CO2 process in Bremen, Germany; and ethyl acetate process in Colombia and Mexico.
These imported decaf green beans are stored in Japanese roasters’ warehousing, then roasted in small-to-medium batches to preserve the delicate flavour profile that decaf requires. Roasting parameters (lower initial charge temperature, shorter development time) are critical to avoid over-roasting and bitterness. The domestic supply chain for decaf ground coffee is thus a chain of international links: origin farm → decaffeination facility → shipping to Japan → roasting/grinding → packaging → distribution. Lead times from order to retail shelf range from 6 to 14 weeks, depending on origin, decaf process, and seasonal demand peaks.
Any disruption at a key decaffeination hub (e.g., plant maintenance, labour strike, shipping lane congestion) can create short-term supply constraints for Japanese roasters, who typically hold 8–12 weeks of decaf green bean inventory as a buffer.
Japan is a net importer of all coffee forms, and the decaf ground coffee segment follows this pattern. Trade flows occur at two levels: imports of finished roasted decaf ground coffee (HS 090122) and, more significantly, imports of decaffeinated green coffee beans (HS 090112) for domestic roasting. In 2025, estimated imports of roasted decaf coffee into Japan totalled 2,500–3,500 tonnes, with principal origins being Germany (home to several large CO2 decaf roasters), Switzerland (Swiss Water process roasted packs), and Italy (Illy, Lavazza).
However, the larger volume by far—approximately 12,000–16,000 tonnes—is imported as decaf green beans (HS 090112) for domestic roasting. These green decaf beans primarily arrive from Canada (Swiss Water), Germany (CO2), and Colombia (EA process). Japan also exports negligible quantities of caffeine free ground coffee, mainly to neighbouring Asian markets for Japanese expatriate communities.
Tariff treatment is an important trade consideration; under the World Trade Organization (WTO) most-favoured-nation (MFN) regime, Japan applies a duty of approximately 12% on roasted coffee (HS 090122) and 10% on green coffee (HS 090112), though preferential rates exist under Economic Partnership Agreements (EPAs) with Europe, Switzerland, and Canada. For instance, roasted decaf from Switzerland enters duty-free under the Japan-Switzerland EPA, providing a cost advantage for Swiss Water process brands.
The yen’s exchange rate directly affects import costs: during periods of yen depreciation (as in 2022–2025), landed costs for decaf green beans rose 25–30%, leading to retail price increases and margin compression for roasters unable to fully pass through costs. Trade data patterns suggest that decaf imports have grown 5–8% annually in volume since 2020, outpacing total coffee import growth, reflecting the segment’s nascent expansion.
Retail grocery channels dominate distribution for caffeine free ground coffee in Japan. Supermarkets and hypermarkets—including chains like Aeon, Ito-Yokado, and Seiyu—account for an estimated 50–60% of retail decaf volume, offering both national brands and private-label options. Convenience stores (Seven-Eleven, FamilyMart, Lawson) represent 15–20% of volume, with smaller pack sizes (100–150g) and single-serve drip bags gaining popularity for on-the-go consumption. Drugstores and health food stores contribute a further 5–10%, often carrying organic and fair-trade certified decaf.
E-commerce is the fastest-growing channel, estimated at 15–20% of decaf ground coffee sales in 2026, driven by specialty DTC brands and subscription models. Amazon Japan, Rakuten, and brand-specific websites offer wider assortments than physical stores, particularly for premium imported decaf. Office coffee service (OCS) distributors serve corporate and institutional buyers, providing decaf ground coffee in bulk packs and single-serve pods; this channel accounts for 10–15% of total decaf volume and is expanding as wellness initiatives in workplaces increase.
Foodservice distribution to cafés and small hospitality venues represents 8–12% of decaf ground coffee consumption, though many specialty cafés still prefer whole bean decaf. Buyer groups vary by channel: at retail, the primary purchaser is the health-conscious individual aged 45–65, while online buyers skew younger (25–44) and more experimental. Grocery category managers make stocking decisions based on category growth rates and margins; decaf typically commands 20–25% higher gross margins than regular coffee, incentivising increased shelf allocation.
Corporate procurement for office supply selects decaf based on staff surveys and price per cup, often favouring mainstream national brands or OCS-specific blends. Institutional buyers in healthcare facilities prioritise low-caffeine compliance and often require packaging that clearly indicates caffeine content and process type.
Caffeine free ground coffee sold in Japan must comply with the Food Sanitation Act and the Food Labelling Standards enforced by the Consumer Affairs Agency. Key requirements include accurate ingredient listing, net weight, and allergen declarations. The term “caffeine free” is regulated: products must contain no more than 0.1% caffeine on a dry weight basis, aligning with international norms set by the Codex Alimentarius. Any decaffeination process claim—such as “Swiss Water Process” or “CO2 Process”—must be substantiated and must not mislead consumers regarding chemical residues.
For organic certification, the Japan Agricultural Standards (JAS) system provides third-party verification; although voluntary, JAS Organic certification is increasingly used by premium decaf brands to differentiate. Imported decaf products must also clear inspection by the Ministry of Health, Labour and Welfare (MHLW) under the Food Sanitation Act, which includes random sampling for pesticide residues and processing contaminants. For decaf processed with methylene chloride, residue limits are strictly enforced; Japan’s maximum residue level (MRL) for methylene chloride in coffee is 0.1 mg/kg, consistent with international standards.
The Act on Promotion of Recycling and Related Matters (Container and Packaging Recycling Law) affects packaging design, requiring roasters to minimise plastic use and promote recyclability—a factor influencing the shift toward paper-based, compostable packaging for decaf ground coffee. Fair trade and sustainability certifications (Fairtrade, Rainforest Alliance) are not legally mandated but are increasingly displayed on packaging to appeal to environmentally and socially conscious buyers.
The regulatory environment is stable and well-defined, with no imminent changes expected to categorically disrupt the market, though stricter labelling of residual solvents could emerge in line with EU trends, which would advantage process methods that avoid chemical solvents.
The Japan caffeine free ground coffee market is projected to sustain robust growth through 2035, with volume likely to expand at a compound annual rate of 4.5–6.5% from the 2026 base. This growth rate is 2–3 times the expected pace for the overall ground coffee market, reflecting the combination of structural demographic demand (aging population, increasing doctor-recommended caffeine reduction) and behavioural shifts (evening consumption occasions, health optimisation).
By 2035, decaf ground coffee’s share of total ground coffee volume could reach 5–7% in Japan, up from 2–4% in 2026—a range that would see annual volume in the 13,000–19,000 tonne region, depending on base assumptions. The premium segment is forecast to grow fastest, outpacing mass-market decaf by 2–3 percentage points per year, as consumers trade up to single-origin, flavour-preserved, and certified decaf products. E-commerce and subscription channel share is expected to rise from 15–20% in 2026 to 25–35% by 2035, driven by DTC brand growth and the convenience of repeat ordering for a staple product.
Office and institutional demand will likely grow in line with corporate wellness programmes, while foodservice decaf penetration will increase modestly as more cafés add ground decaf options. Import dependence will persist; however, domestic roasters may invest in smaller-scale, specialised decaffeination partnerships (e.g., mini-CO2 plants at roasteries) to reduce lead times and differentiate. The most significant upside risk is the possibility that Japanese consumer acceptance of decaf accelerates faster than modelled, particularly if mainstream media and health influencer endorsements broaden the perceived benefits.
Downside risks include prolonged yen weakness, which would raise import costs and potentially dampen volume growth in the value tier, and the emergence of alternative caffeine-free coffee substitutes (e.g., chicory-based, mushroom coffee) that could compete for the same consumer spend. Overall, the market outlook is positive, with steady expansion anchored by solid macro-demographic drivers and improving product quality.
The most compelling growth opportunities in Japan’s caffeine free ground coffee market lie in premiumisation and channel innovation. Domestic roasters that have traditionally focused on mass-market blends can develop proprietary decaf lines using high-quality single-origin beans (e.g., Colombian Excelso or Ethiopian Yirgacheffe) decaffeinated via Swiss Water or CO2, then marketed on flavour preservation and origin story. Such products can command prices 50–100% above standard decaf, improving margins while attracting the health-conscious premium segment.
Another opportunity exists in the office coffee service (OCS) segment: few OCS operators currently offer a differentiated decaf product, leaving a gap for a branded decaf ground coffee tailored to corporate wellness initiatives, possibly in compostable single-serve pods that align with ESG goals. Direct-to-consumer subscription models also present a scalable path for niche decaf specialists; the combination of automated replenishment, personalised roast profiles, and educational content (e.g., “evening brew” positioning) can build recurring revenue and customer loyalty.
Furthermore, there is room for collaboration between Japanese roasters and international decaffeination hubs to develop co-branded products that leverage Japan’s reputation for precision and quality—for instance, a Japanese roasting company contracting a dedicated production run at a Swiss Water facility and marketing it as “precision-decaf for Japanese palates.” On the certification front, obtaining JAS Organic and Fairtrade labels for decaf offerings can open doors to high-margin channels such as natural food stores (e.g., Bio c’ Bon, Natural House) and hospital cafeterias.
Finally, the aging population creates an underserved segment of consumers who are caffeine-sensitive but still desire a full coffee experience; roasters that design easy-to-brew ground decaf formats (e.g., drip bags with clear brewing instructions for older adults) could capture significant loyalty. These opportunities, while requiring upfront investment in sourcing and marketing, are well aligned with the demographic and lifestyle trends that will define the Japanese coffee market over the next decade.
This report is an independent strategic category study of the market for caffeine free ground coffee in Japan. It is designed for brand owners, general managers, category leaders, trade-marketing teams, e-commerce teams, retail partners, distributors, investors, and market entrants that need a clear read on where growth sits, which brands control the category, how pricing and promotion shape demand, and which channels matter most for scale and margin.
The framework is built for Consumer Packaged Goods (CPG) – Beverage markets within consumer goods, where performance is driven by need states, shopper missions, brand hierarchies, price-pack architecture, retail execution, promotional intensity, and route-to-market control rather than by a narrow technical specification alone. It defines caffeine free ground coffee as Ground coffee specifically processed to remove caffeine, targeting consumers seeking the taste and ritual of coffee without its stimulant effects and maps the market through category boundaries, consumer segments, usage occasions, channel structure, brand and private-label positions, supply and availability logic, pricing and promotion mechanics, and country-level commercial roles. Historical analysis typically covers 2012 to 2025, with forward-looking scenarios through 2035.
This report is designed to answer the questions that matter most to brand, category, channel, and strategy teams in consumer-goods markets.
At its core, this report explains how the market for caffeine free ground coffee actually works as a consumer category. It is built to show where demand comes from, which need states and shopper missions matter most, which brands and private-label players shape the category, which channels control visibility and conversion, and where pricing power, repeat purchase, and margin are actually created.
Rather than framing the category through narrow technical attributes, the study breaks it into decision-grade commercial layers: product format, benefit platform, shopper segment, purchase occasion, pack-price architecture, channel environment, promotional intensity, route-to-market control, and company archetype. It is therefore useful both for teams shaping portfolio strategy and for teams executing growth through End Consumers (Health-conscious, caffeine-sensitive), Grocery Retail Category Managers, Foodservice Distributors, and Corporate Procurement for Office Supply.
The report also clarifies how value pools differ across Home brewing (drip, pour-over, French press), Office coffee service, and Small-scale foodservice where whole bean grinding is impractical, how premiumization and private label reshape category economics, how retail concentration and route-to-market design affect scale, and which countries matter most for brand building, sourcing, packaging, and channel expansion.
The report is based on an independent market-intelligence methodology that combines category reconstruction, public company evidence, retail and channel mapping, pricing review, and multi-layer triangulation. It is built for consumer categories where no single public dataset captures the real structure of demand, brand power, promotion, and channel control.
The evidence stack typically combines company disclosures, investor materials, brand and retailer product pages, e-commerce assortment checks, packaging and claims analysis, public pricing references, trade statistics where relevant, regulatory and labeling guidance, and observable route-to-market evidence from distributors, retailers, merchandisers, and marketplace ecosystems.
The analytical model then reconstructs the category across the layers that matter commercially: category scope, shopper need states, consumer segments, pack-price ladders, brand and private-label hierarchy, channel power, promotional intensity, route-to-market design, and country role differences.
Special attention is given to Health concerns (anxiety, sleep, blood pressure), Doctor/lifestyle recommendations to reduce caffeine, Demand from aging population, Growth of evening coffee consumption occasion, and Premiumization within decaf segment. The objective is not only to size the market, but to explain where value pools sit, which segments drive mix and repeat purchase, which channels shape growth, and how leading brands defend or expand their positions across End Consumers (Health-conscious, caffeine-sensitive), Grocery Retail Category Managers, Foodservice Distributors, and Corporate Procurement for Office Supply.
The report does not rely on survey-based opinion as its core evidence base. Instead, it uses observable commercial signals and structured public evidence to build a decision-grade view for brand, category, retail, e-commerce, investment, and market-entry teams.
This report defines caffeine free ground coffee as Ground coffee specifically processed to remove caffeine, targeting consumers seeking the taste and ritual of coffee without its stimulant effects and treats it as a branded consumer category rather than as a narrow technical product class. The objective is to capture the real commercial market that category, brand, trade-marketing, and channel teams are managing.
Scope is determined by how the category is sold, merchandised, priced, and chosen in market. That means the report follows product formats, claims, price tiers, pack architecture, need states, and retail environments that shape Home brewing (drip, pour-over, French press), Office coffee service, and Small-scale foodservice where whole bean grinding is impractical.
The study deliberately separates the category from adjacent baskets when they distort the economics or shopper logic of the market being measured. Typical exclusions therefore include Whole bean decaffeinated coffee, Instant/soluble decaffeinated coffee, Decaffeinated coffee pods/capsules (e.g., K-Cups), Ready-to-drink (RTD) decaf coffee beverages, Caffeinated ground coffee, Herbal coffee substitutes (e.g., chicory, barley), Tea and other hot beverages, Coffee flavorings and syrups, and Coffee brewing equipment.
The report provides focused coverage of the Japan market and positions Japan within the wider global consumer-goods industry structure.
The geographic analysis explains local consumer demand conditions, brand and private-label balance, retail concentration, pricing tiers, import dependence, and the country’s strategic role in the wider category.
This study is designed for strategic and commercial users across brand-led consumer categories, including:
In many brand-driven, channel-sensitive, and consumer-demand-led markets, official trade and production statistics are not sufficient on their own to describe the true market. Product boundaries may cut across multiple tariff codes, several product categories may be bundled into the same official classification, and a meaningful share of activity may take place through customized services, captive supply, platform relationships, or technically specialized channels that are not directly visible in standard statistical datasets.
For this reason, the report is designed as a modeled strategic market study. It uses official and public evidence wherever it is reliable and scope-compatible, but it does not force the market into a purely statistical framework when doing so would reduce analytical quality. Instead, it reconstructs the market through the logic of demand, supply, technology, country roles, and company behavior.
This makes the report particularly well suited to products that are innovation-intensive, technically differentiated, capacity-constrained, platform-dependent, or commercially structured around specialized buyer-supplier relationships rather than standardized commodity trade.
The report typically includes:
Risks to oil prices are firmly skewed higher amid plunging global oil inventories in the worst supply disruption in history, according to Barclays.
The investment bank on Friday kept its $100 per barrel Brent forecast for 2026, but warned that the risks are skewed to the upside as the closure of the Strait of Hormuz has been draining U.S. and global inventories to multi-year lows.
“Inventory trends are signaling a 6-8 (million bpd) deficit with the U.S. inventories within reach of the lowest levels since 2020,” analysts at Barclays wrote in a note carried by Reuters.
Even if the Strait of Hormuz were to fully open to tanker traffic today, the starting point for inventories – in the most optimistic scenario – would be about 20 million barrels below the tightest level they have been recently, according to Barclays.
Earlier this week, Goldman Sachs warned that global oil inventories are falling at an accelerated rate, as April draws from inventories had run at double the rate for March.
Since the start of May, global draws from inventories have been running at 8.7 million barrels per day (bpd), which is the highest ever, the investment bank’s analysts said.
“Physical markets continue to tighten, as estimated oil exports through the strait remain at a very low 5% of normal,” they said.
Earlier this month, Goldman said that global oil inventories were crashing and approaching an eight-year low, with the rate of depletion so fast that it exposes the market to further shocks.
Meanwhile, asset managers and energy market experts said in a Bloomberg Intelligence survey that oil prices are set to average between $81 and $100 per barrel over the next 12 months as demand destruction would help balance a market that continues to price in a lasting war risk premium.
Early on Friday, oil prices were rising by about 2% in Asian trade, with Brent Crude up 2.3% at $105 and WTI Crude rising 1.7% to $98 per barrel.
By Tsvetana Paraskova for Oilprice.com
As volatility has declined recently, the price range has contracted, as gold builds energy for its next move. Given the sustained bull trend, the expectation is for an eventual upside continuation. That moment is getting closer given the symmetrical triangle consolidation that has formed, alongside two major moving averages. The 50-day shows dynamic resistance and the 200-day average support. Notice that like the trendlines, the distance between the two indicators has been narrowing.
Key resistance for the bearish correction is near the falling 50-day moving average at $4,660 and it aligns closely with the downtrend line. The latest lower swing high at $4,774 provides key structure resistance, as a recovery of that level signals a trend reversal. Also nearby is the rising 100-day moving average at $4,802, which was confirmed as resistance during the latest swing high. A reclaim of that average would further confirm bullish sentiment. It may quickly be followed by a lower swing high at $4,891 from April.
Collectively, these resistance levels highlight the ongoing compression in price action, reinforcing the broader theme of declining momentum within a longer-term bullish structure. This tightening range continues to build pressure for a decisive expansion move once market equilibrium resolves.
Silver price (XAG/USD) faces selling pressure near $76.00 during the European trading session on Friday. The white metal trades lower due to uncertainty over whether the United States (US) and Iran will reach a deal.
Comments from Tehran, as reported by the Iranian Labour News Agency (ILNA), state that the final draft of the peace proposal with the US has been reached; however, Iran’s hard stance on preserving uranium stockpiles and a prolonged toll system over the Strait of Hormuz keep the hopes of the deal announcement under pressure.
The Silver price has underperformed in the past few months, as oil prices remain elevated due to the closure of the Hormuz. Higher oil prices have prompted US inflationary pressures, a scenario that has forced traders to price out the possibility of interest rate cuts by the Federal Reserve (Fed) this year.
According to the CME FedWatch tool, the odds of the Fed holding benchmark lending rates at their current levels or delivering at least one interest rate hike are 50.8% and 48.1%, respectively.
Theoretically, squeezed dovish Fed bets diminish the appeal of non-yielding assets, such as Silver.
XAG/USD trades lower at around $75.90 at the press time. The white metal reflects a bearish near-term bias as price holds below the 20-day Exponential Moving Average (EMA) at $77.79 and struggles to return above the upward-sloping trendline, which is plotted from the March 23 low of $61.01.
The Relative Strength Index (14) around 47 leans slightly negative but not yet oversold, hinting at persistent but moderate downside pressure.
On the topside, initial resistance is located at the 20-day EMA at $77.79, with the broken ascending trend line at $78.07 reinforcing a nearby cap that bulls would need to clear to ease the current downside bias. The white metal could rise to near $80.00 if it manages to return above the 20-day EMA.
On the downside, the spot could slide to $70 if it fails to hold the May 19 low of $73.09.
(The technical analysis of this story was written with the help of an AI tool.)
Silver is a precious metal highly traded among investors. It has been historically used as a store of value and a medium of exchange. Although less popular than Gold, traders may turn to Silver to diversify their investment portfolio, for its intrinsic value or as a potential hedge during high-inflation periods. Investors can buy physical Silver, in coins or in bars, or trade it through vehicles such as Exchange Traded Funds, which track its price on international markets.
Silver prices can move due to a wide range of factors. Geopolitical instability or fears of a deep recession can make Silver price escalate due to its safe-haven status, although to a lesser extent than Gold’s. As a yieldless asset, Silver tends to rise with lower interest rates. Its moves also depend on how the US Dollar (USD) behaves as the asset is priced in dollars (XAG/USD). A strong Dollar tends to keep the price of Silver at bay, whereas a weaker Dollar is likely to propel prices up. Other factors such as investment demand, mining supply – Silver is much more abundant than Gold – and recycling rates can also affect prices.
Silver is widely used in industry, particularly in sectors such as electronics or solar energy, as it has one of the highest electric conductivity of all metals – more than Copper and Gold. A surge in demand can increase prices, while a decline tends to lower them. Dynamics in the US, Chinese and Indian economies can also contribute to price swings: for the US and particularly China, their big industrial sectors use Silver in various processes; in India, consumers’ demand for the precious metal for jewellery also plays a key role in setting prices.
Silver prices tend to follow Gold’s moves. When Gold prices rise, Silver typically follows suit, as their status as safe-haven assets is similar. The Gold/Silver ratio, which shows the number of ounces of Silver needed to equal the value of one ounce of Gold, may help to determine the relative valuation between both metals. Some investors may consider a high ratio as an indicator that Silver is undervalued, or Gold is overvalued. On the contrary, a low ratio might suggest that Gold is undervalued relative to Silver.
The EUR/USD pair fell for a second consecutive week, settling not far above a fresh multi-week low of 1.1576. War-related headlines kept driving financial markets, coupled with mounting speculation that the United States (US) Federal Reserve (Fed) will deliver a rate hike before the year is over.
Optimism about a possible resolution of the US-Iran conflict fluctuated throughout the week, reaching its peak on Thursday when headlines suggested both countries reached an agreement via Pakistan mediation, putting temporary pressure on the safe-haven US Dollar (USD).
Early on Friday, however, reports clarified that there is no actual deal, although there’s progress toward peace. Iran’s uranium enrichment and control over the Strait of Hormuz are the remaining sticking points, the same issues that have been dragging on ever since the first idea of an agreement.
Easing Oil prices suggest investors are optimistic about a deal, although taking it with a pinch of salt. By the end of the week, the positive tone of equities also supports the idea of a better mood heading into the weekend.
Still, the Greenback remains strong as focus is also on the Fed. Kevin Warsh was sworn in as the 17th Fed Chair on Friday, facing quite a tumultuous scenario. Warsh will have to deal on the one hand with increasing inflationary pressures and tepid growth and on the other hand, with a President that demands lower interest rates, the opposite of what markets are betting on. Warsh will preside over his first Federal Open Market Committee (FOMC) monetary policy meeting in mid June.
Across the pond, the situation does not differ much. The Old Continent faces the same inflationary pressures steaming from the Iran war, with recent data showing that the euro area annual inflation rate was 3.0% in April 2026, after printing at 2.6% in March. The European Union (EU) annual inflation was 3.2% in April 2026, up from 2.8% in the previous month.
The European Central Bank (ECB) is widely expected to deliver a rate hike in June, after keeping rates unchanged in April, albeit policymakers are working to temper expectations of more rate hikes coming in July. The ECB is scheduled to announce its next monetary policy decision on June 11.
The Euro (EUR) enjoyed some temporary demand after the initial headlines indicating that a rate hike in June is pretty much a done deal, but it was not enough to overshadow broad USD strength.
The macroeconomic calendar had little to offer, but the released figures fueled growth-related concerns. S&P Global released the preliminary estimates of the May Purchasing Managers’ Indexes (PMIs). European figures were the most worrisome, as the German Composite PMI came in at 48.6, while for the EU, the index printed at 47.5, both indicating contraction. In the US, however, the Composite PMI was confirmed at 51.7, matching the April print.
In the upcoming days, the US will release the April Personal Consumption Expenditures (PCE) Price Index, the Fed’s favorite inflation gauge, which was previously at 3.5% YoY. The country will also publish an update on the Q1 Gross Domestic Product (GDP), while Germany will publish the preliminary estimate of the May Harmonized Index of Consumer Prices (HICP).
Market players are excited, yet cautious about a peace deal in the Middle East, but have learned that weekends do not equal absent news on the matter. Be aware of whatever happens, triggering some opening gaps on Monday’s Asian open.
EUR/USD is technically bearish according to the daily chart. The pair holds beneath both the 20-day simple moving average (SMA) at 1.1692 and the 100-day SMA at 1.1699, with the shorter one crossing below the longer one, an early sign of further slides ahead. The 200-day SMA, in the meantime, holds flat around 1.1660. At the same time, technical indicators hold within negative levels with neutral-to-bearish slopes, not enough to confirm further slides but supporting the downward case.
In the weekly chart, EUR/USD holds well above the 100- and 200-week simple moving averages (SMAs) at 1.1256 and 1.0959, but extended its slide below the 20-week SMA at 1.1689, in line with mounting selling pressure. The Relative Strength Index (RSI) indicator gains downward traction just under the 50 mark, while the Momentum indicator also aims south in negative territory, hinting that sellers are gaining ground.
On the topside, initial resistance could be found at 1.1660, the weekly top, followed by the 1.1690 region, where multiple SMAs converge. The area is likely to hold in a risk-averse scenario and without a clear war deal. If somehow the US and Iran reach an agreement and reopen the Strait of Hormuz, next in line are 1.1740 and 1.1800. On the downside, the broader trend backdrop is underpinned by the weekly low, with additional losses exposing a long-term static support area at 1.1470. A clear break below the latter could open the door for a steeper decline towards the 100-week SMA at 1.1256.
(The technical analysis of this story was written with the help of an AI tool.)
Domestic coffee prices
The domestic coffee market on the morning of May 23, 2026, received a major boost when purchasing prices simultaneously surged strongly on a large scale.
After the slight and somewhat cautious recovery of the previous trading session, soybean kernel prices in key Central Highlands provinces added from 1,200 to 1,300 VND/kg, helping the market officially regain the 88,000 VND/kg mark.
Specifically, in Dak Nong province (old), coffee prices recorded an increase of 1,300 VND, pushing the purchase price to 88,100 VND/kg and continuing to maintain the highest position in the whole region.
Dak Lak province also reached the milestone of 88,000 VND/kg after increasing by 1,300 VND. Gia Lai and Lam Dong provinces respectively recorded purchase prices of 87,900 VND/kg and 87,400 VND/kg after recovering by 1,200 VND compared to yesterday’s session.
Contrary to the boom of coffee, pepper prices today stood still at the mark of 142,000 VND/kg, while the USD/VND exchange rate at Vietcombank maintained stability at 26,130 VND/USD.
World coffee prices
Developments on futures exchanges last night showed a dramatic opposite situation between the two main coffee flows.
The London exchange became the main driving force for domestic prices when Robusta futures for July delivery increased by 57 USD (equivalent to 1.68%), closing at 3,456 USD/ton.
Conversely, the New York exchange continued to face slight downward adjustment pressure as Arabica futures for July delivery lost an additional 1.05 cent (equivalent to 0.38%), falling to 272.35 cents/lb. The fact that Robusta reversed the trend and accelerated above 1.5% clearly reflects investors’ concern about the actual nut supply situation.
Coffee price assessment
The core cause of this strong differentiation stems from complex weather developments that directly affect large production areas.
In Vietnam, the weather forecasting agency forecasts that recent rains in the key growing region of the Central Highlands are extremely scarce and scattered. The serious shortage of rainfall during the period when coffee trees are bearing young fruit has raised great concerns about year-end harvest yields, forcing speculative funds to boost purchases for defense.
In addition, the market also received support from the warning of the US National Oceanic and Atmospheric Administration (NOAA) about 82% chance of El Niño phenomenon appearing and 67% probability of turning into “Super El Niño”, which could delay the rainy season and affect the flowering process of the next crop year in Brazil. Arabica inventories on the ICE exchange continued to fall to a 3-month low of 449,567 bags along with transport congestion through the Strait of Hormuz also contributing to maintaining a solid support for prices.
However, the breakthrough momentum of international prices is still significantly restrained by pressure from the new harvest that is taking place favorablely in South America. Reputable organizations such as StoneX and Marex Group Plc continuously maintain forecasts for a global super-surplus crop year of up to 10 million bags in 2026 thanks to Brazil’s record output expected to reach 75.9 million bags. Along with the fact that Vietnam’s export growth in the first 4 months of the year increased sharply by 15.8% to 810,000 tons, today’s increase is mainly a short-term reaction to weather risks in the Central Highlands.
The EURGBP provided a new negative close below the minor bearish channel’s resistance at 0.8685, forming several bearish waves, to settle near 0.8645 level, confirming the dominance of the previously suggested bearish trend.
By the above image, we notice the stability of moving average 55 near the main resistance, besides stochastic attempt to reach the oversold level will increase the negative pressure on the current period trading, which makes us prefer targeting new negative stations that might begin at 0.8610 and 0.8585.
The expected trading range for today is between 0.8610 and 0.8640
Trend forecast: Bearish


 Price Forecast: Compression Signals Major Breakout Potential")


