The main category of All News Articles.
You can use the search box below to find what you need.
[wd_asp id=1]
The main category of All News Articles.
You can use the search box below to find what you need.
[wd_asp id=1]
Silver prices fell towards $57.20 per ounce on Tuesday as a stronger US dollar and growing expectations of tighter Federal Reserve policy outweighed support from another year of structural supply deficits. With the Fed set to announce its latest policy decision on Wednesday, traders are watching whether XAG/USD can hold the key $56.81 Fibonacci support before the next directional move.
Silver came under renewed selling pressure as investors reduced exposure ahead of the Federal Reserve’s two-day policy meeting. Spot silver traded near $57.23 per ounce, down around 2% on the day, extending its retreat after briefly approaching the $60 mark last week. The stronger US dollar remained the primary headwind, making dollar-denominated precious metals more expensive for overseas buyers.
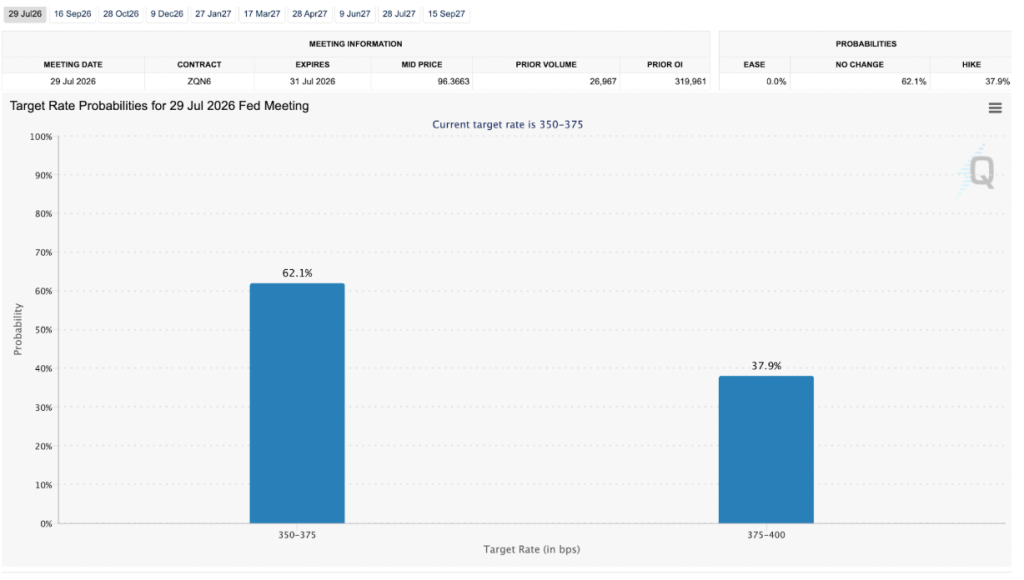
Markets are increasingly focused on the Fed’s policy guidance rather than the rate decision itself. According to CME FedWatch, investors assign a 62% probability that policymakers will leave interest rates unchanged this week, while the likelihood of a 25-basis-point increase has climbed to 38%, up sharply from around 16% a week ago. Markets are also pricing roughly an 81% chance of a September rate increase, reflecting expectations that inflation risks remain elevated.
Higher interest rates generally reduce the appeal of non-yielding assets such as silver by increasing returns on cash and government bonds. A hawkish statement from the Fed could therefore keep pressure on both silver and gold, even if rates remain unchanged this week.
Unlike gold, silver derives much of its value from industrial demand, particularly in electronics, renewable energy, electric vehicles and advanced manufacturing. While concerns over slower global growth have weighed on industrial metals in recent weeks, the long-term supply picture remains supportive.
The Silver Institute expects the global silver market to record its sixth consecutive annual supply deficit in 2026. Its latest estimates indicate the market could remain undersupplied by approximately 46.3 million ounces, even after modest improvements in mine production and recycling. Earlier projections had suggested a deficit closer to 67 million ounces, highlighting that global consumption continues to exceed newly available supply.
Physical investment demand also remains resilient. The Silver Institute forecasts demand for silver coins and bars to increase by roughly 20% to around 227 million ounces this year, the strongest level in three years. Although industrial fabrication is expected to soften slightly, silver continues to benefit from growing demand across electrical infrastructure, electronics and clean energy technologies.
Another supportive factor comes from India, where tighter import restrictions and higher import duties have significantly reduced silver imports, creating regional shortages and lifting domestic premiums above international benchmark prices.
Following Wednesday’s Fed decision, attention will quickly shift to Thursday’s US GDP, personal income, spending and Core PCE inflation reports. The Core PCE index remains the Federal Reserve’s preferred inflation gauge, and any upside surprise could reinforce expectations for another rate increase in September.
Conversely, softer economic growth or easing inflation would weaken the US dollar and improve the outlook for precious metals, particularly silver, which tends to react more sharply than gold to changes in monetary policy expectations.
Silver’s technical picture has weakened after breaking below the ascending trendline that supported the rally from the July 17 low. The decline has brought prices towards the 50% Fibonacci retracement at $56.81, where buyers have begun to emerge. However, the recovery remains tentative as XAG/USD continues to trade below both the former trendline and its key moving averages.
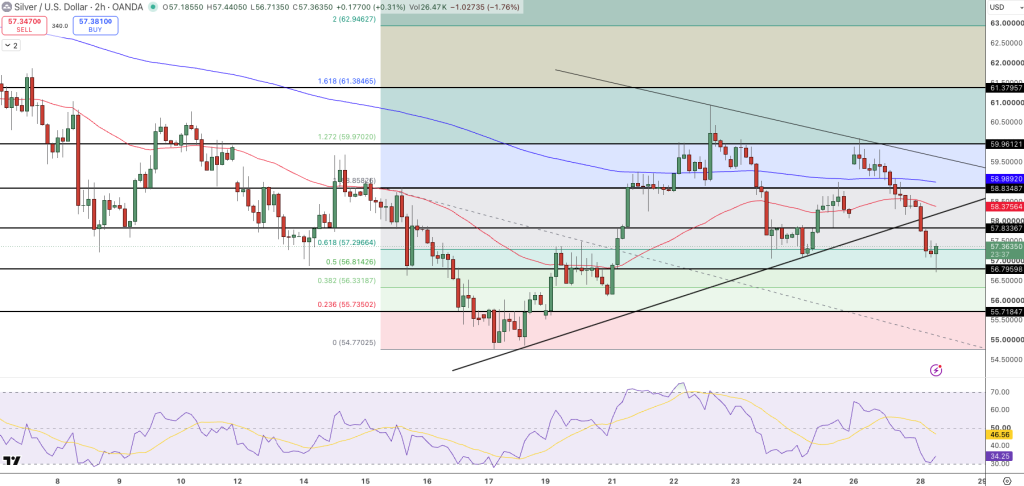
The 50-period EMA at $58.38 has turned lower and now acts as immediate resistance, while the 200-period EMA at $58.99 remains firmly above price, confirming that sellers retain short-term control. Meanwhile, the RSI has fallen to around 34, approaching oversold territory but not yet signalling a confirmed bullish reversal.
A sustained recovery above $58.34 would improve the near-term outlook and expose the 200-period EMA at $58.99, followed by the descending trendline near $59.96. If buyers regain control above these levels, the next upside objective comes in at $61.38.
On the downside, $56.81 remains the first key support. A decisive break below this Fibonacci level would expose $56.33, followed by $55.72, while a deeper correction could extend towards $54.77.
Bullish scenario: Buy on a confirmed break above $58.34.
Target 1: $58.99
Target 2: $59.96
Extended Target: $61.38
Stop-loss: Below $56.81
Bearish scenario: A confirmed break below $56.81 could accelerate losses towards $56.33, followed by $55.72 and $54.77.
Silver is under pressure because the US dollar has strengthened ahead of the Federal Reserve’s policy decision, reducing demand for non-yielding precious metals and increasing the cost of silver for international buyers.
Unlike gold, more than half of global silver consumption comes from industrial applications, including electronics, solar panels, electric vehicles and electrical infrastructure. Economic growth expectations therefore have a greater influence on silver prices.
Yes. The Silver Institute expects another annual supply deficit in 2026, with global demand continuing to exceed mine production and recycling. Persistent shortages could provide longer-term support once monetary policy uncertainty begins to ease.

Arslan Ali Butt
Lead Markets Analyst – Multi-Asset (FX, Commodities, Crypto)
Arslan Ali Butt serves as the Lead Commodities and Indices Analyst, bringing a wealth of expertise to the field. With an MBA in Behavioral Finance and active progress towards a Ph.D., Arslan possesses a deep understanding of market dynamics.
His professional journey includes a significant role as a senior analyst at a leading brokerage firm, complementing his extensive experience as a market analyst and day trader. Adept in educating others, Arslan has a commendable track record as an instructor and public speaker.
His incisive analyses, particularly within the realms of cryptocurrency and forex markets, are showcased across esteemed financial publications such as ForexCrunch, InsideBitcoins, and EconomyWatch, solidifying his reputation in the financial community.
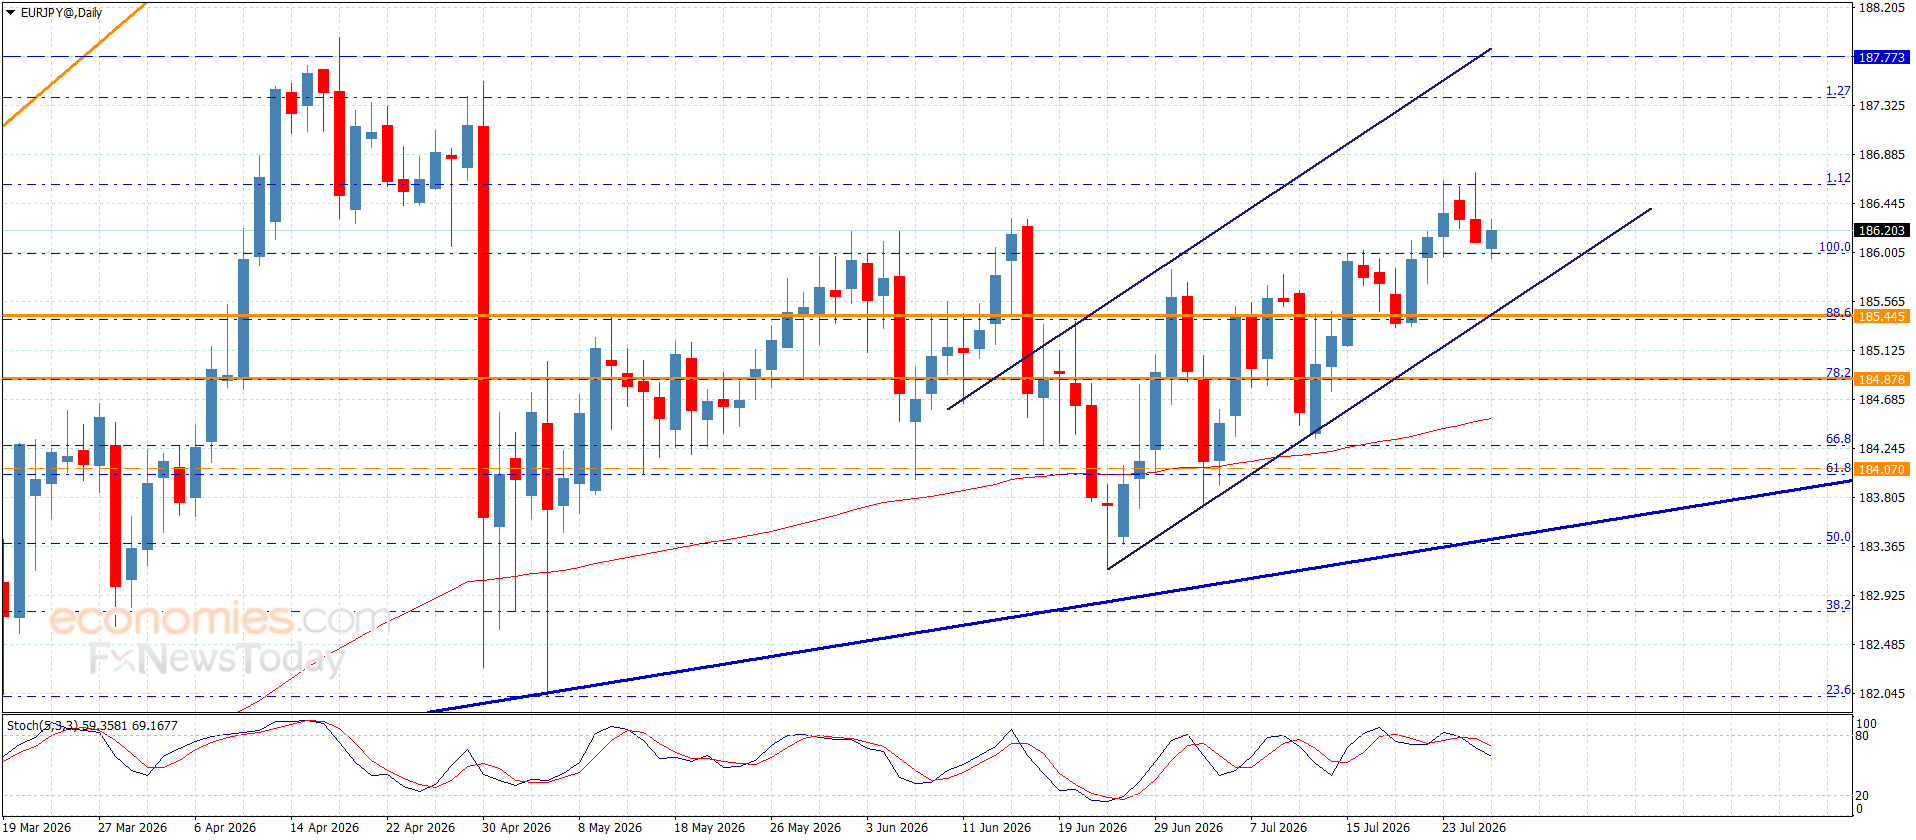
EUR/JPY holds ground after two days of losses, trading around 186.20 during the Asian hours on Tuesday. The currency cross is holding a bullish near-term bias as it trades above both the nine-period and 50-period Exponential Moving Averages (EMAs), keeping the broader uptrend supported.
The 14-day Relative Strength Index (RSI) at 57.46 leans to the bullish side without yet signaling overbought conditions, suggesting buyers still retain control while upside momentum remains moderate. However, the daily chart technical analysis shows that the EUR/JPY cross is remaining within a rising wedge, indicating a strong bearish reversal risk.
The EUR/JPY cross could rise toward the upper boundary of the rising wedge around 186.90. Further advances could support the currency cross to target the all-time high of 187.95, which was recorded on April 17.
On the downside, the initial support lies at the nine-day EMA of 186.01, followed by the lower boundary of the rising wedge around 185.50 and the 50-day EMA at 185.33. A break below this confluence support zone could cause a bearish emergence and put downward pressure on the EUR/JPY cross to navigate the region around the five-month low of 181.87, recorded on March 16, and the seven-month low of 180.81.
(The technical analysis of this story was written with the help of an AI tool. Know more.)
The table below shows the percentage change of Euro (EUR) against listed major currencies today. Euro was the strongest against the Australian Dollar.
| USD | EUR | GBP | JPY | CAD | AUD | NZD | CHF | |
|---|---|---|---|---|---|---|---|---|
| USD | 0.03% | -0.01% | 0.00% | -0.00% | 0.33% | 0.16% | -0.00% | |
| EUR | -0.03% | -0.04% | -0.02% | -0.05% | 0.29% | 0.14% | -0.03% | |
| GBP | 0.00% | 0.04% | 0.02% | 0.04% | 0.36% | 0.19% | 0.03% | |
| JPY | 0.00% | 0.02% | -0.02% | -0.01% | 0.32% | 0.16% | 0.01% | |
| CAD | 0.00% | 0.05% | -0.04% | 0.00% | 0.34% | 0.15% | 0.02% | |
| AUD | -0.33% | -0.29% | -0.36% | -0.32% | -0.34% | -0.14% | -0.33% | |
| NZD | -0.16% | -0.14% | -0.19% | -0.16% | -0.15% | 0.14% | -0.14% | |
| CHF | 0.00% | 0.03% | -0.03% | -0.01% | -0.02% | 0.33% | 0.14% |
The heat map shows percentage changes of major currencies against each other. The base currency is picked from the left column, while the quote currency is picked from the top row. For example, if you pick the Euro from the left column and move along the horizontal line to the US Dollar, the percentage change displayed in the box will represent EUR (base)/USD (quote).
The GBPJPY pair remains affected by the contradiction of the main indicators, delaying the bullish trend and it settles near the initial support level at 217.65 level, facing the moving average 55.
Reminding you that the positive scenario will remain valid by holding above 216.55 level, which forms initial main support against the bullish attempts, therefore, we will keep waiting for gathering positive momentum to help it form bullish waves, to target 218.65 level and surpassing this barrier will extend the trading towards 219.40 reaching 220.00.
The expected trading range for today is between 217.30 and 218.65
Trend forecast: Bullish
The US Dollar to Japanese Yen exchange rate is expected to remain elevated in the near term, with Nomura arguing that strong US fundamentals and higher Treasury yields continue to outweigh growing intervention risks from Japanese authorities.
USD/JPY has climbed back towards the 164 level, close to its highest levels since the 1980s, as rising oil prices, resilient US economic data and renewed expectations of further Federal Reserve tightening have boosted demand for the Dollar.
Nomura believes those factors should keep the pair trading within a 162.00 to 165.50 range, although it warns that official action becomes increasingly likely if the exchange rate pushes higher.


The Japanese Yen has weakened against the US Dollar over recent weeks as higher US yields have widened interest-rate differentials.
According to Nomura, markets are effectively testing Japan’s tolerance for further Yen weakness.
The bank notes that although Finance Minister Katayama has reiterated that authorities stand ready to take “decisive action whenever necessary”, verbal warnings have yet to intensify significantly and there has been no evidence of fresh currency intervention.
Instead, investors remain focused on the widening gap between US and Japanese interest rates.
Higher crude oil prices have also weighed on the Yen by worsening Japan’s import bill, while stronger-than-expected US labour-market data have reinforced expectations that the Federal Reserve may need to keep monetary policy restrictive for longer.
Nomura believes those forces continue to favour Dollar strength despite the growing political sensitivity surrounding Yen depreciation.
MUFG shares a similar view, arguing that persistent US rate-hike expectations remain the dominant driver of USD/JPY.
The bank said stronger US inflation risks and resilient employment data have pushed Treasury yields higher, offsetting expectations that the Bank of Japan will continue gradually normalising policy.
Attention now turns to this week’s Bank of Japan policy meeting, where rates are widely expected to remain unchanged.
Nomura says any indication that policymakers are becoming more willing to raise rates at the September meeting could help stabilise the Yen by narrowing expected policy divergence with the Federal Reserve.
The bank also believes markets will closely watch Governor Ueda’s press conference and any changes in the voting pattern for clues that the BOJ is becoming less tolerant of above-target inflation.
Goldman Sachs likewise expects the BOJ to leave policy unchanged, with investors instead focusing on the latest Tokyo inflation figures and industrial production data for guidance on the timing of future tightening.
For now, however, the US Dollar continues to enjoy a substantial yield advantage.
Nomura expects that to keep USD/JPY supported within its projected 162.00–165.50 range, while warning that any move towards the upper end of that band could significantly increase the likelihood of intervention by Japanese authorities.
Our currency coverage draws on live market data, official economic releases and published bank research.

12
UK Stock Market Forecast Today (July 28 2026): The prospects of the UK equity market continue to remain positive as the FTSE 100 Index has managed to rise to a five-month peak of 10,781.75, helped by better global sentiment and lower levels of anxiety regarding inflation. The main reason for this positive shift is the sharp fall in the price level of global crude oil, where the price of Brent crude oil declined below $91 a barrel owing to a brief pause in US-Iran military disputes.
UK Stock Market Forecast Today (July 28): FTSE 100 Market Outlook
| Index | Importance |
|---|---|
| FTSE 100 | Tracks the UK’s largest listed companies and global businesses |
| FTSE 250 | Reflects UK-focused mid-cap companies and domestic economic sentiment |
| FTSE All-Share | Represents a broader picture of UK equities |
| AIM All-Share | Covers smaller and growth-oriented companies |
The shares in the UK will continue to be in the spotlight today on account of the influence of the significant drop in the global prices for crude oil, the publication of interim results from major companies, and the diminishing of the geopolitical risks owing to the temporary easing of tensions between the United States and Iran.
| Stock | Key Developments |
|---|---|
| Unilever (ULVR) | Unilever is attracting investor attention after reporting a strong performance, with underlying sales growth of 4.8% in the first half of the year. The growth was supported by improved core volumes, while the planned separation of its Unilever Foods division remains on schedule. |
| AstraZeneca (AZN) | AstraZeneca continues to gain momentum after posting better-than-expected earnings, with H1 revenue rising 9%. Positive survival data from trials of its gastric cancer treatment has emerged as a major growth driver for the pharmaceutical giant. |
| Games Workshop (GAW) | Games Workshop is expected to see increased trading activity after announcing an interim dividend of £1.40 per share, drawing attention from income-focused investors. |
| DCC plc (DCC) | DCC remains in focus after agreeing to the £5.75 billion acquisition of DCC Energy by KKR and ECP, marking a major strategic development for the company. |
Investors will continue to monitor energy prices, corporate earnings, and global risk sentiment for further direction in UK equities.
The key lesson for any investor is that creating long-term value is not dependent on anticipating the market moves but rather on being disciplined, taking care of the risks, and letting the investments compound over time. Reinvestment of earnings allows an investor to grow exponentially over time, whereas diversification into various assets prevents an individual from facing losses. Investors need to be aware of the fact that excess cash held by them becomes less valuable due to increasing inflation levels. Excessive investment costs can prove detrimental for the investment returns.
Disclaimer: This article is for informational purposes only and does not constitute financial advice. Investors should consult a qualified financial advisor before making investment decisions. Stock market investments are subject to market risks.
The GBPJPY pair remains affected by the contradiction of the main indicators, delaying the bullish trend and it settles near the initial support level at 217.65 level, facing the moving average 55.
Reminding you that the positive scenario will remain valid by holding above 216.55 level, which forms initial main support against the bullish attempts, therefore, we will keep waiting for gathering positive momentum to help it form bullish waves, to target 218.65 level and surpassing this barrier will extend the trading towards 219.40 reaching 220.00.
The expected trading range for today is between 217.30 and 218.65
Trend forecast: Bullish
Ni news for copper price due to the contradiction of the main indicators, providing weak sideways trading by its stability near $6.3000 level, confined between $6.5100 barrier and $6.1000 level.
Stochastic approach from 20 level makes us expect forming some bullish bearish corrective waves, attempting to reach $6.2000, attacking the previously mentioned support, which represents initial key to confirm the suggested targets in the upcoming trading.
The expected trading range for today is between $6.1000 and $6.4100
Trend forecast: Bearish
Silver (XAG/USD) rallies on Monday and trades around $59.45 at the time of writing, up 2.27% on the day. The white metal benefits from a sharp decline in Oil prices following renewed hopes for de-escalation between the United States (US) and Iran, a backdrop that strengthens expectations of a more accommodative monetary policy from major central banks.
TMGM Analysis: Financial Market News, Economic Calendar & Market Insights
Military tensions between the two countries have paused after US Ambassador to the United Nations Mike Waltz said US President Donald Trump had decided to suspend military strikes to allow more time for diplomacy. According to Reuters, an Iranian official also stated that Tehran would halt its attacks as long as Washington does the same.
This development is weighing heavily on Oil prices, with West Texas Intermediate (WTI) falling by nearly 8% at the time of press. Lower energy prices help ease concerns over persistently high inflation, reducing the likelihood of additional monetary tightening and supporting non-yielding assets such as Silver.
At the same time, lower US Treasury yields and a weaker US Dollar (USD) are providing additional support to the precious metal. Investors have scaled back expectations for further interest rate hikes as inflation risks linked to energy prices continue to fade.
Market attention now turns to the Federal Reserve (Fed) monetary policy decision on Wednesday. The central bank is widely expected to leave interest rates unchanged, but investors will closely scrutinize the policy statement and Chair Jerome Powell’s remarks for further clues about the future path of monetary policy.
Silver is a precious metal highly traded among investors. It has been historically used as a store of value and a medium of exchange. Although less popular than Gold, traders may turn to Silver to diversify their investment portfolio, for its intrinsic value or as a potential hedge during high-inflation periods. Investors can buy physical Silver, in coins or in bars, or trade it through vehicles such as Exchange Traded Funds, which track its price on international markets.
Silver prices can move due to a wide range of factors. Geopolitical instability or fears of a deep recession can make Silver price escalate due to its safe-haven status, although to a lesser extent than Gold’s. As a yieldless asset, Silver tends to rise with lower interest rates. Its moves also depend on how the US Dollar (USD) behaves as the asset is priced in dollars (XAG/USD). A strong Dollar tends to keep the price of Silver at bay, whereas a weaker Dollar is likely to propel prices up. Other factors such as investment demand, mining supply – Silver is much more abundant than Gold – and recycling rates can also affect prices.
Silver is widely used in industry, particularly in sectors such as electronics or solar energy, as it has one of the highest electric conductivity of all metals – more than Copper and Gold. A surge in demand can increase prices, while a decline tends to lower them. Dynamics in the US, Chinese and Indian economies can also contribute to price swings: for the US and particularly China, their big industrial sectors use Silver in various processes; in India, consumers’ demand for the precious metal for jewellery also plays a key role in setting prices.
Silver prices tend to follow Gold’s moves. When Gold prices rise, Silver typically follows suit, as their status as safe-haven assets is similar. The Gold/Silver ratio, which shows the number of ounces of Silver needed to equal the value of one ounce of Gold, may help to determine the relative valuation between both metals. Some investors may consider a high ratio as an indicator that Silver is undervalued, or Gold is overvalued. On the contrary, a low ratio might suggest that Gold is undervalued relative to Silver.
Domestic coffee prices today
Coffee prices today in the domestic market remain stable compared to the previous session. According to the updated table on July 27, the purchase price in the Central Highlands ranges from 95,300-96,000 VND/kg.
In Dak Lak, coffee prices are recorded at 95,800 VND/kg. Gia Lai also has a purchase price of 95,800 VND/kg.
In Lam Dong, coffee prices are at 95,300 VND/kg, the lowest among the surveyed areas.
The old Dak Nong area, now belonging to Lam Dong province, continues to have the highest price, reaching 96,000 VND/kg.
Domestic coffee prices are currently flat after the previous recovery session. Compared to the end of last week, the price level is still about 1,900 VND/kg lower, showing that the market has not escaped the short-term correction.
World coffee prices
In the world market, data recorded on July 27th showed no new fluctuations in the main terms.
On the London exchange, the September 2026 Robusta futures contract remained at $3,757/ton. The November 2026 term remained at $3,738/ton.
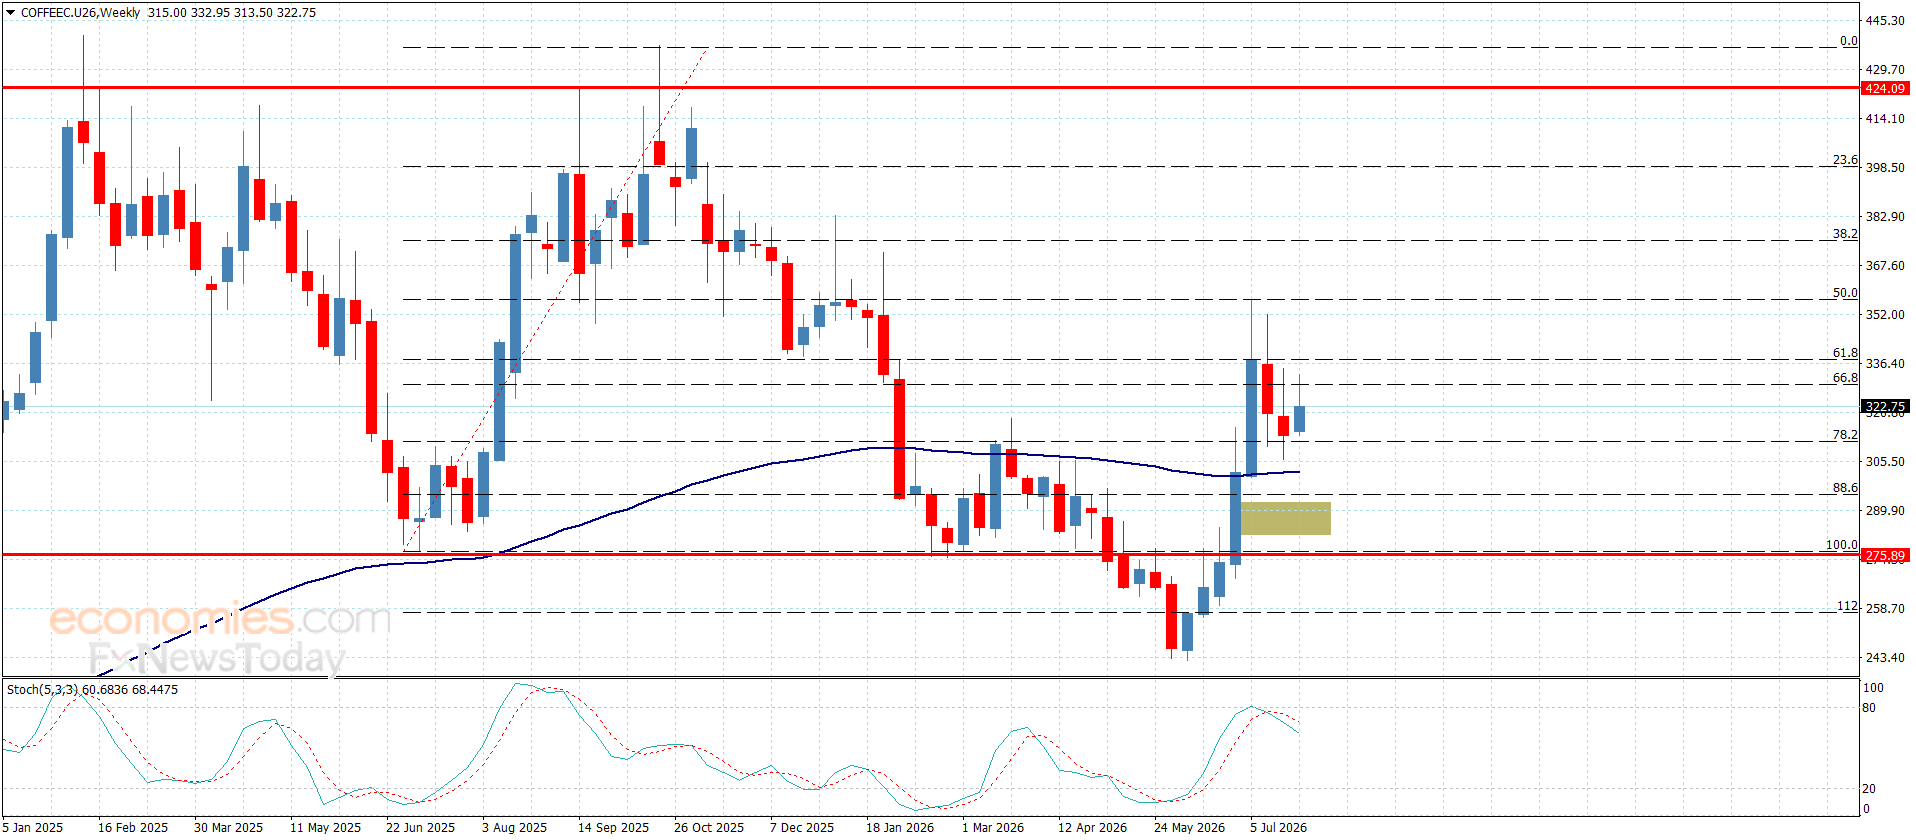
On the New York floor, the Arabica contract for September 2026 is at 313.80 US cents/lb. The December 2026 term is kept at 298.05 US cents/lb.
Compared to the most recent session, some price tables recorded Robusta July futures decreasing, while longer-term futures recovered; Arabica slightly increased in the main terms.
Coffee price assessment
Domestic coffee prices went sideways around the 96,000 VND/kg range after the recovery session, but were still significantly lower than the approaching 99,000 VND/kg range previously recorded.
From a global market perspective, the International Coffee Organization (ICO) said that the average ICO aggregate price index in June 2026 reached 248.90 US cents/lb, down 2.8% compared to May 2026. This shows that world coffee prices are still under adjustment pressure after a period of strong increase.
With Robusta, the Coffee Annual report of the Foreign Agricultural Services Agency of the US Department of Agriculture (USDA/FAS) forecasts that Vietnam’s coffee production in the 2026-2027 crop year will reach 32.5 million bags converted to green beans. The prospect of increased supply continues to be a factor that can curb the upward momentum in the medium term.
Regarding the weather, the Central Highlands is in the rainy season. The National Center for Hydro-Meteorological Forecasting forecasts that the Central Highlands region will have showers and thunderstorms in some places; especially in the afternoon and night, there will be rain, moderate rain and scattered thunderstorms, locally heavy rain, concentrated in the South.
In the coming sessions, developments on the London exchange, New York exchange, USD/VND exchange rate, inventory and demand for export purchases will continue to dominate the market.