The main tag of cryptocurrency price today Articles.
You can use the search box below to find what you need.
[wd_asp id=1]
The main tag of cryptocurrency price today Articles.
You can use the search box below to find what you need.
[wd_asp id=1]
Ripple (XRP) price trims gains to exchange hands at $2.44 at the time of writing on Tuesday, as the crypto market puts the brakes on the rally triggered by the trade deal between the United States and China, on top of last week’s limited bilateral trade agreement with the United Kingdom (UK). The sudden pullback from Monday’s highs triggered massive liquidations totaling $35 million in the last 24 hours, according to CoinGlass data. Longs accounted for the lion’s share of the liquidations at $22.82 million, hinting at declining trader interest in XRP’s short-term price action.
Meanwhile, Securities and Exchange Commission (SEC) Chair, Paul Atkins, said during the Crypto Task Force roundtable on Monday that the Commission needs to keep pace with innovation, calling for regulatory changes to position the United States (US) as the “crypto capital of the planet,” as envisioned by President Donald Trump.
The Crypto Task Force roundtable with SEC Chair Paul Atkins discussed varying issues, including the transition of securities from off-chain to on-chain systems, President Trump’s commitment to elevating the US as a global cryptocurrency hub, and policymaking and digital assets-focused regulations.
Atkins said that the agency has for a long time suffered due to “policymaking siloes,” a situation he is keen on changing to ensure regulations are on par with innovation. With the help of the Crypto Task Force, Atkins believes the “Commission can establish clear and sensible guidelines for distributions of crypto assets that are securities or subject to an investment contract.”
Chairman Paul Atkins’ remarks at the Crypto Task Force roundtable on tokenization:
The topic of this afternoon’s discussion is timely as securities are increasingly migrating from traditional (or “off-chain”) databases to blockchain-based (or “on-chain”) ledger systems.
— U.S. Securities and Exchange Commission (@SECGov) May 12, 2025
Atkins revealed his intentions for the Commission, promising that “policymaking will no longer result from ad hoc enforcement actions.” Instead, the agency will focus on developing fit-for-purpose standards for market participants.
The Chair’s remarks come after Ripple and the SEC agreed to settle the longstanding lawsuit. Ripple will pay $50 million in penalties to the agency, significantly lower than the $125 million fine imposed by the court last year. The two parties also agreed to drop their respective appeals in the case, effectively resolving the lawsuit that began in December 2020.
XRP’s price extended the previous week’s uptrend, reaching highs of $2.65 on Monday before correcting to trade at $2.44 at the time of writing. The cross-border money remittance token gained traction amid renewed risk-on sentiment, as investors welcomed trade talks between the US and China.
Based on the 12-hour chart, XRP sits significantly above key moving averages, including the 50-, 100- and 200 Exponential Moving Average (EMA), forming a confluence support around $2.23.
The Relative Strength Index (RSI) indicator’s rejection from near overbought territory to 63.17 exemplifies a strong bearish momentum. If the indicator slides toward the midline, the path with the least resistance could stay downwards, risking the progress made over the last week.
Beyond the immediate support at $2.40, the confluence area around $2.23, and the critical level at $2.20 would come in handy to absorb the potential selling pressure as traders adjust positions due to changing dynamics.
XRP/USDT 12-hour chart
Notably, the Moving Average Convergence Divergence (MACD) indicator upholds the buy signal sent on Thursday. This, along with the MACD line (blue) divergence above the signal (red) and the green histograms, suggests that it’s not over for the bulls as they could still push for a trend continuation above the short-term support at $2.40. Targets on the upside include the supply zone at $2.80, tested as resistance in February and the psychological level at $3.00, tested last in March.
Ripple (XRP) price trims gains to exchange hands at $2.44 at the time of writing on Tuesday, as the crypto market puts the brakes on the rally triggered by the trade deal between the United States and China, on top of last week’s limited bilateral trade agreement with the United Kingdom (UK).
The Ethereum price today is trading around $2,445, following a sharp surge earlier this week that brought ETH to a local high of $2,623. After this bullish breakout, the market is showing signs of consolidation as sellers test the newly formed support around $2,420. This level sits just above the 38.2% Fibonacci retracement ($2,424) on the weekly chart — a zone critical for sustaining upward Ethereum price action.

From a weekly perspective, Ethereum remains above both the 23.6% and 38.2% retracement levels, signaling a structurally bullish recovery from its March lows near $1,385. However, a decisive move above the 50% zone at $2,745 would be needed to confirm a broader trend reversal.

On the 4-hour chart, Ethereum appears to be forming a bullish flag — a continuation pattern, after its strong vertical move from $2,100 to $2,600. Price is currently correcting within a descending channel, trading near the lower bound. If bulls defend the $2,420–$2,430 support cluster (which aligns with EMA20 and lower Bollinger Band), we could see a breakout continuation toward $2,550 and even $2,600.

This short-term correction is not unexpected after recent Ethereum price spikes. The RSI on the 30-minute and 4-hour charts hovers near 43–45, suggesting a neutral to slightly bearish bias. However, a reversal in momentum could come quickly if RSI moves back above 50. The MACD histogram has flattened, indicating waning bearish pressure for now.

The answer to why Ethereum price going down today lies in lower time frame exhaustion. After a parabolic rally between May 8–11, ETH faced overhead resistance at $2,600, triggering mild profit-taking. Price is also reacting to the red zone marked around $2,555–$2,600, which aligns with prior liquidity pockets seen on the 30-minute chart. This area remains a stubborn resistance and will likely define whether ETH continues higher or breaks below $2,420.

The broader structure on the daily chart shows that ETH remains above the major downtrend breakout level near $1,940, which was reclaimed last week. That said, Bollinger Bands are starting to contract on the 4H timeframe — signaling reduced Ethereum price volatility in the near term.

As long as ETH holds above $2,420, bulls retain the upper hand. A bullish breakout from the descending flag could lead to a retest of $2,555 followed by $2,600. Beyond that, the next key target lies at $2,745 (Fib 0.5 level). On the downside, a breakdown below $2,420 opens the door toward $2,300 and then the $2,246 (EMA50) zone.
Traders should watch for a breakout from the flag structure and volume confirmation near $2,460–$2,480. If momentum fails, Ethereum may retrace toward its EMA100 ($2,071) as a deeper retest.
| Technical Indicator | Value / Signal |
| Ethereum price today | $2,445 |
| Key Resistance Levels | $2,555, $2,600, $2,745 |
| Key Support Levels | $2,420, $2,300, $2,246 |
| RSI (4H) | 43.2 (Neutral-Bearish) |
| MACD (30-min) | Bearish Crossover Fading |
| Pattern Watch | Bullish Flag Formation |
| Trend Bias (Short Term) | Sideways to Bullish |
| Volatility Outlook | Decreasing in short term |
Disclaimer: The information presented in this article is for informational and educational purposes only. The article does not constitute financial advice or advice of any kind. Coin Edition is not responsible for any losses incurred as a result of the utilization of content, products, or services mentioned. Readers are advised to exercise caution before taking any action related to the company.
As the crypto market enters a renewed bullish phase in May, analysts are projecting a trillion-dollar market cap for XRP.
In a recent tweet, analyst Capt Toblerone shared his expectations for how high the global crypto market could grow by the end of this bull cycle. Specifically, he is projecting a massive $35 trillion market by 2026, with XRP expected to capture a significant share.
For context, the global crypto market currently stands at only $3.03 trillion. Essentially, Toblerone is predicting more than a 10X expansion of the market by next year. In this scenario, he projects Bitcoin’s dominance, currently around 64%, will drop significantly to 16%.
This substantial decline would provide the broader altcoin market ample room to thrive, allowing tokens like XRP to reach historic peak values.
Specifically, Toblerone projects that in a $35 trillion market, Bitcoin’s price would be $300,000 per coin—about 3X today’s price of $96,500. This would equate to a $5.928 trillion market cap for Bitcoin.
Meanwhile, he projects that Ethereum would reach an astonishing market cap of $3.609 trillion. This would propel ETH’s price to $30,000 per coin.
For context, Ethereum is trading today at $1,830 with a market cap of $220 billion. Reaching $30,000 with a $3.61 trillion cap would mean a massive growth of 1,540%.
Toblerone projects a similarly promising scenario for XRP. Specifically, he estimates that XRP could reach a lofty $1.2 trillion market cap.
Currently, XRP is trading at $2.20 with a market cap of $129 billion. Toblerone anticipates that XRP’s unit price could reach $22 if its market cap climbs to $1.29 trillion. This is essentially a 10X increase from today’s price.
To put this in perspective, $10,000, which could buy approximately 4,500 XRP today, would be worth around $100,000 at that projected price.
Toblerone’s $22 price target for XRP aligns with forecasts from other analysts. Bitcoin analyst Davinci Jeremie recently reiterated his $24 price target for XRP, stating that XRP has a good chance to hit that level this year.
Likewise, Korea’s Elliott Wave analyst XForceGlobal projects XRP could reach $10 to $40 during this cycle. A $40 price would imply a $2.32 trillion market cap for XRP.
Others, such as Javon Marks, have proposed even more ambitious projections, calling for a $100 XRP price by the end of this cycle. This would equate to a nearly $6 trillion market cap.
In his broader market cap projection, Toblerone also envisions lofty valuations for other top-ranking altcoins like Solana (SOL), BNB, Cardano (ADA), and Dogecoin (DOGE). He projects SOL could reach a $3.5 trillion market cap, BNB $872 billion, ADA $407 billion, and DOGE $290 billion.
Essentially, Toblerone sees only Ethereum, Solana, and XRP reaching trillion-dollar valuations this cycle.
DisClamier: This content is informational and should not be considered financial advice. The views expressed in this article may include the author’s personal opinions and do not reflect The Crypto Basic opinion. Readers are encouraged to do thorough research before making any investment decisions. The Crypto Basic is not responsible for any financial losses.
Solana (SOL) price is approaching a major resistance as it soars in its prevailing uptrend. Solana (SOL) is currently trading in a critical supply zone, which is improving from a bullish double bottom, accreting institutional interest, and getting technical positives. Analysts are monitoring Solana possible price spike over $200, as this could indicate a significant trend change.
Solana price recently formed a double bottom pattern, a classic bullish reversal structure. This pattern developed between the $114 and $130 demand zone, as highlighted in recent analysis by talentino. The double bottom is often seen as a strong indicator of a potential trend reversal, signaling that buyers are gaining control after a prolonged downtrend.
The recent chart shared by CryptoVirtuos showed that Solana price has now pushed into the critical $176 to $185 supply zone. This area represents a significant resistance region, where past attempts to break higher have failed.
According to CryptoVirtuos, the $180 level is a critical barrier that previously triggered sharp corrections, nearly driving the price to two-digit levels. He noted that this is a “scary region” but expressed confidence that Solana could break through this time, given the strong buying interest.
The double bottom pattern is further supported by strong volume spikes, confirming the growing interest in the asset. This setup aligns with the analysis from Talentino, who noted that Solana’s momentum is just getting started. A successful breakout above this level could push SOL price toward the $200 mark, a major psychological barrier.

Institutional interest in Solana is also growing, providing a strong foundation for its recent rally. Notably, major funds like SOL Strategies and DeFi Dev Corp have collectively added over 200,000 SOL to their holdings, pushing their total to over 395,000 SOL. This accumulation reflects increasing confidence in Solana’s long-term potential and its ability to capture a larger share of the decentralized finance (DeFi) and tokenized asset markets.
These large-scale purchases suggest that institutional investors are positioning themselves for further upside. The increase in institutional holdings aligns with the broader trend of growing interest in blockchain networks that offer high-speed transactions and lower fees, areas where Solana excels.
Technical indicators also point to strong bullish momentum for Solana. The relative strength index (RSI) for SOL has surged close to 80, signaling robust buying interest. An RSI reading above 70 typically indicates overbought conditions, suggesting that the current rally may be reaching a critical point.
Noteworthy, high RSI scores represent strong momentum, but can also be used as a warning for traders. Whereas, high RSI values usually are associated with strong price spikes, they may also signal potential for short-term pullbacks.
SOL price needs a breakout above $185, a breakout that would be held for a substantial amount of time, as otherwise, the coin could be faced not by an increase, but by a minor pull-back.
Meanwhile, Solana price is now trading at $171.91, up 0.23% in the last 24 hours. Solana combined market cap also stays at $89.27 billion and its daily traded volume has gained $4.57 billion, showing an 814% increase. Currently, the circulating supply of Solana stands at 519.32 million SOL and its fully diluted value stands at $ 103.23 billion.
Such data indicate a continuous investor interest for Solana, supporting the future perspective of a sustainable boom if Solana price succeeds in overcoming major resistance.
When trading volume increases, it indicates increased market enthusiasm to support the liquidity needed if the market moves out of the $185 resistance zone.
In this article, the views and opinions stated by the author or any people named are for informational purposes only, and they don’t establish the investment, financial, or any other advice. Trading or investing in cryptocurrency assets comes with a risk of financial loss.

The majority of the coins keep rising, according to CoinStats.CoinStats”>
Unlike other coins, the rate of Bitcoin ![]() BTCUSD has gone down by 1.37% over the last day.TradingView”>
BTCUSD has gone down by 1.37% over the last day.TradingView”>
On the hourly chart, the price of the main crypto is near the local support of $102,563. If the daily bar closes around that mark, one can expect a test of the $102,000 range soon.TradingView”>
On the larger time frame, the picture has changed from bullish to bearish.
If bulls cannot seize the initiative, there is a chance to see an ongoing decline to the $100,000-$102,000 area.TradingView”>
From the midterm point of view, the rate of BTC has made a false breakout of the $104,985 level. If the weekly candle closes far from it, traders may expect an ongoing downward move to the $100,000 mark.
Bitcoin is trading at $103,153 at press time.
XRP price prediction discussions are making the rounds at a crucial moment—Ripple’s XRP price continues to climb above $2.40 and momentum is growing following news of a pause in US-China tariffs.. After a 11.2% recovery this week, along with stronger technical signals, multiple XRP price forecasts are now edging closer towards a $3 breakout, with some even eyeing levels as high as $5.
Yet, some market analysts argue that the XRP price outlook reflects a broader shift, as the US and China agree to slash tariffs. One of the most talked-about disruptors right now is JetBolt (JBOLT)—a zero-gas altcoin that has just skyrocketed beyond a 350 million tokens sold presale milestone.
In this well-researched piece, we’ll break down the latest XRP price prediction, discover whether XRP will pump to $5, and explore why JetBolt’s presale constantly dominates headlines.
Crash or Moonshot? XRP’s Battle to $5
The XRP price prediction debate is heating up after Ripple’s Q1 report and new developments in its legal battle with the SEC. Earlier this month, XRP exhibited a clear downtrend, slipping from above $2.21 to its to just below $2.10.
In the last week however, XRP has reclaimed higher levels, edging adobe $2.40 and growing by 11.2% in that time. If this trajectory continues, it may raise speculation about a possible climb closer to the $3 zone.
XRP 7-day price chart showing an uptrend from below $2.10 to above $2.40
XRP’s technical analysis also points to stronger momentum, with its RSI hovering at 63 and oscillators moving towards “Buy” territory.
Many XRP price forecasters and economists would consider the new deal struck between the US and China and the slashing of tariffs as one of the catalysts driving new growth and interest in XRP and crypto markets.
Still, Ripple is expanding aggressively. It now directly holds 4.56 billion XRP and controls 37.1 billion in escrow, while also acquiring Hidden Road for $1.25 billion to boost XRPL and RLUSD integration. On-chain data also reveals a growing number of whale wallets—over 300,000 addresses now hold over 10,000 XRP—indicating confidence despite price volatility.
Adding to the positive news, Ripple’s legal clarity and institutional traction, including the Teucrium 2x XRP ETF’s $5 million debut, support long-term optimism. However, the pending SEC vote on Franklin Templeton’s ETF application, now delayed to June 17, remains a wildcard.
For now, any XRP price prediction talks—whether about to move adobe $3 or a pump to $5—appear more bullish, with current technicals suggesting growing positive sentiment. In another story, growing attention is shifting toward emerging Web3 entrants like JetBolt (JBOLT), as users seek out faster, zero-gas blockchain solutions with real utility and explosive momentum.
JetBolt (JBOLT): The Zero-Gas Juggernaut Disrupting the Crypto World
JetBolt (JBOLT) is swiftly becoming the central topic of crypto users’ discussions. With over 350 million JBOLT tokens already snapped up in a scorching presale run, JetBolt is dominating headlines as it disrupts the status quo with its plethora of groundbreaking innovations. This isn’t hype—it’s traction, and the numbers are doing the talking.
Built on the ultra-fast Skale Network, JetBolt obliterates the outdated barrier of gas costs. Thanks to this, users’ transactions are all near-instant and gas-free. Moreover, JetBolt’s revolutionary zero-gas technology creates new ground worrying about a gas fee meter running in the background.
If that wasn’t enough to flip the script—JetBolt has turned staking into a whole new experience. With its sleek Web3 wallet, even crypto newbies can enter the staking arena without any hassle. The cherry on top? Staking with JetBolt isn’t just about earning from staking tokens. Here, engagement becomes a possible way to get more rewards—the more stakers interact and participate within JetBolt’s ecosystem, the more extra rewards they unlock.
As for the presale? It’s not slowing down. JetBolt’s Alpha Boxes are flying off the shelves—designed for supercharging token holdings from day one with discounts of up to 25% bonus JBOLT tokens. Combine that with JetBolt’s daily price increases and attractive live features, and it’s clear why whales are circling JetBolt’s presale, which is a huge difference from any typical ‘wait-and-see’ scenario.
In a presale cycle packed with noise, JetBolt has managed to stand out—not with flash, but with function. While others echo, JetBolt generates exciting headline—louder, sharper, and impossible to scroll past.

Conclusion: XRP’s Road Ahead after slashing of US tariffs and JetBolt’s Breakout Moment
This week, XRP climbed above key levels following positive macroeconomic news as the US and China agreed to slash tariffs for 90 days. As Ripple awaits the SEC’s final vote to vacate the injunction, XRP price prediction ranges remain wide, with discourses focused on whether it will climb to $3 or pump to $5.
On the other hand, JetBolt (JBOLT) has stormed headlines with over 350 million JBOLT tokens already sold during its presale that’s constantly gaining explosive momentum. Unsurprisingly, JetBolt has emerged as a standout narrative in this cycle—one shaped by cutting-edge innovations and growing traction.
As XRP steadies following the cutting of tariffs, JetBolt fuels a fresh narrative—fast, zero-gas, and flying off the presale charts. The stage is set, and crypto watchers now face a split screen of high-volume movement, institutional headlines, and new contenders reshaping the market.
Dive into JetBolt’s world—where zero-gas innovation meets breakout presale buzz—through the links below:
JetBolt’s Official Website: https://jetbolt.io/
JetBolt on X: https://x.com/jetboltofficial
Disclaimer: This content is not financial or crypto trading advice. Always remember that the crypto world moves fast—headlines change, charts flip, and predictions swing. Don’t forget to do your own research before jumping into any crypto activity. Never risk more than what you can afford to lose.
Key points:
Bitcoin price saw profit booking near $105,819, signaling that bears remain active at higher levels.
Select altcoins have continued to move higher, indicating increased investor interest.
The SPX and the DXY are playing catch-up to Bitcoin following the US-China trade deal.
Bitcoin BTCUSD has started the new week on a cautious note, falling below $103,000, but the S&P 500 Index (SPX) and the US Dollar Index (DXY) have risen sharply following the announcement of the US-China trade agreement. One of the reasons could be that other assets are trying to play catch up with Bitcoin, and the sharp rally in the US dollar may be acting as headwinds for Bitcoin in the near term.
Bitwise European Head of Research André Dragosch said in a post on X that the firm’s proprietary indicator has reached its highest level since 2024. Historically, high levels of the indicator have resulted in a short-term correction or sideways price action.

The short-term uncertainty has not stopped the long-term bulls from adding more Bitcoin to their portfolio. Michael Saylor’s Strategy acquired 13,390 Bitcoin at an average price of $99,856 between May 5 and May 11. The latest purchase has boosted the firm’s haul to 568,840 Bitcoin.
What are the crucial support levels to watch out for in Bitcoin and altcoins? Let’s analyze the charts of the top 10 cryptocurrencies to find out.
S&P 500 Index price prediction
The S&P 500 Index gapped up sharply on May 12 and rose above the stiff overhead resistance at 5,800.

Time is running out for the bears. If they want to prevent the upside, they will have to fiercely defend the 5,800 level and quickly drag the price below the 20-day exponential moving average (5,570). If they manage to do that, the index could start a deeper correction toward 5,400.
Instead, if the price closes above 5,800, the up move may continue toward the 6,000 level. There could be a minor halt at 6,000, but if the bulls prevail, the index could retest the all-time high at 6,147.
US Dollar Index price prediction
The US Dollar Index pierced the 20-day EMA (100.42) on May 8, indicating that the bears are losing their grip.

Sellers tried to pull the price back below the 20-day EMA on May 9, but the bulls held their ground. The index has reached the 50-day simple moving average (102.08), which is expected to behave as a resistance.
If the price turns down from the 50-day SMA but finds support at the 20-day EMA, it suggests a positive sentiment. That increases the likelihood of a rally to 103.54 and thereafter to 104.68.
Bitcoin price prediction
Bitcoin has turned down from $105,819, indicating that the bears are defending the $107,000 to $109,588 zone.

The first support on the downside is the $100,000 level, and below that, the 20-day EMA ($97,238). If the price rebounds off the support zone, the bulls will again try to kick the ![]()
![]() BTCUSDT pair above $109,588. If they can pull it off, the pair could ascend to $130,000.
BTCUSDT pair above $109,588. If they can pull it off, the pair could ascend to $130,000.
Conversely, if the price turns down and breaks below the 20-day EMA, it signals that buyers are booking profits at higher levels. That opens the doors for a fall to $93,000 and then to the 50-day SMA ($89,302).
Ether price prediction
Ether (ETH) bulls are trying to sustain the price above $2,550, but the bears have kept up the selling pressure.

If the price skids below $2,435, the ![]()
![]() ETHUSDT pair may fall to $2,320. If the price rebounds off $2,320, the bulls will try to resume the up move. There is resistance at $2,850, but if it is crossed, the pair could reach $3,000.
ETHUSDT pair may fall to $2,320. If the price rebounds off $2,320, the bulls will try to resume the up move. There is resistance at $2,850, but if it is crossed, the pair could reach $3,000.
Contrary to this assumption, if the price turns down and breaks below $2,320, it suggests that the bulls are booking profits. The pair may drop to the breakout level of $2,111, which is likely to act as support.
XRP price prediction
XRP (XRP) broke above the resistance line on May 10, and the bulls successfully held the retest of the breakout level on May 11.

The bulls have strengthened their position by pushing the price above the $2.50 resistance. There is minor resistance at $2.65, but if the level is scaled, the rally could reach $3. Such a move signals a potential trend change.
Alternatively, if the price turns down sharply from $2.65 and breaks below the 20-day EMA ($2.27), it signals a possible range formation in the near term. The ![]()
![]() XRPUSDT pair could swing between $2 and $2.65 for some time.
XRPUSDT pair could swing between $2 and $2.65 for some time.
BNB price prediction
BNB (BNB) turned down from $679 on May 10 but rebounded off the breakout level of $644 on May 12.

Buyers tried to resume the up move, but the long wick on the candlestick shows selling near the $700 level. If the price stays above $644, the bulls will make another attempt to propel the ![]()
![]() BNBUSDT pair to $745.
BNBUSDT pair to $745.
Sellers will have to pull the price below $644 to weaken the bulls. The pair could then fall to the 20-day EMA ($621). Buyers are expected to defend the 20-day EMA because a break below it could tilt the advantage in favor of the bears.
Solana price prediction
Solana’s (SOL) up move has stalled near the $180 resistance, but a positive sign is that the bulls have not given up much ground to the bears.

A shallow pullback increases the possibility of the continuation of the rally. If buyers drive the price above $180, the ![]()
![]() SOLUSDT pair could rally to $210.
SOLUSDT pair could rally to $210.
The immediate support on the downside is at $168. If the price slides below $168, the pair could descend to the 20-day EMA ($155). A solid rebound off the 20-day EMA suggests the bulls remain in control. That increases the likelihood of a break above $180. Sellers will gain the upper hand on a break below $153.
Dogecoin price prediction
Dogecoin (DOGE) turned down from $0.26 on May 11, indicating profit booking by short-term buyers.

The bulls are expected to aggressively defend the breakout level of $0.21. If the price rebounds off $0.21 with strength, it signals that the bulls have flipped the level into support. The ![]()
![]() DOGEUSDT pair could then climb to $0.31.
DOGEUSDT pair could then climb to $0.31.
On the contrary, a break and close below the $0.21 level suggests that bears remain active at higher levels. The pair could then drop to the moving averages, pointing to a possible range formation between $0.14 and $0.26 in the near term.
Cardano price prediction
Cardano (ADA) is facing resistance near $0.86, but a positive sign is that the bulls have not ceded much ground to the bears.

The 20-day EMA ($0.72) has started to turn up, and the RSI is near the overbought area, indicating an advantage to buyers. If the price rebounds off the neckline, the bulls will try to propel the ![]()
![]() ADAUSDT pair above $0.856. If they can pull it off, the pair could travel to the target objective of $1.01.
ADAUSDT pair above $0.856. If they can pull it off, the pair could travel to the target objective of $1.01.
If sellers want to prevent the upside, they will have to swiftly yank the price below the moving averages. If they do that, the pair could descend to the solid support at $0.58.
Sui price prediction
Sui (SUI) is facing selling at $4.25, but a positive sign is that the bulls have maintained the price above the breakout level of $3.90.

Both moving averages are sloping up, and the RSI is near the overbought zone, indicating that the path of least resistance is to the upside. If buyers clear the $4.25 level, the ![]()
![]() SUIUSDT pair could soar to $5.
SUIUSDT pair could soar to $5.
The first sign of weakness will be a break and close below the $3.90 level. That opens the doors for a fall to the 20-day EMA ($3.48). A bounce off the 20-day EMA signals that the positive momentum remains intact. The bulls will then again try to clear the overhead hurdle at $4.25.
This article does not contain investment advice or recommendations. Every investment and trading move involves risk, and readers should conduct their own research when making a decision.
Cardano Price Prediction targets $0.90 as Whale Accumulation, Bullish Charts, and On-Chain Strength Signal Growing Momentum.
Cardano’s momentum is starting to build again, with smart money stepping in and early technical signs pointing up. With on-chain strength adding to the picture, ADA could be setting the stage for its next breakout.Whales Wake Up: 40M ADA Bought
Big players are back, and they’re buying Cardano in large chunks. In the last 48 hours alone, whale activity has bought up over 40 million ADA, signaling a sudden and serious return of deep-pocket interest. When these large holders make moves like this, it usually means they see something big coming. It’s not hype, it’s just smart money getting in early while prices are still low.
Cardano whales accumulate over 40 million ADA in 48 hours. Source: Santiment via Ali Martinez.
According to analyst Ali Martinez, the chart from Santiment reveals a clean, vertical spike in whale holdings, coinciding with ADA’s rise toward the $0.73 zone. If this smart money influx continues and price sustains above the $0.70 support base, momentum could build quickly.
“ADA is exploding,” says Splash, and looking at the chart, it’s hard to disagree. The price just surged with a strong green candle, backed by big volume. This move comes right after whales bought over 40 million ADA, and interest from big players picked up again. All these signs are pointing in the same direction: buyers are in control, and if this momentum keeps going, the ADA Cardano Price could still have room to climb.

Cardano’s ADA breaks out with surging volume following major whale accumulation, signaling strong buyer momentum. Source: Splash via X
The price is currently sitting around the middle point of the Bollinger Bands, which often acts as a pivot. When combined with these oversold RSI readings, it hints at possible upside pressure building up. The analyst believes a V-shaped recovery is often seen after such conditions and even marked $0.85 and $0.90 as the next targets if momentum holds steady. If bulls keep control and the RSI stays above the middle zone, ADA could push higher in the coming hours.
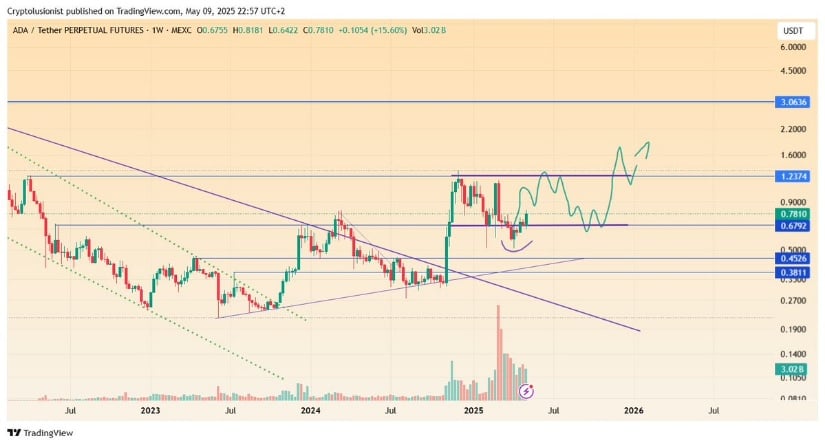
ADA forms a bull flag on the weekly chart, pointing to potential targets of $1.23 and $3.06 in a sustained breakout. Source: TheCryptolusionist via X
The latest chart shared by TheCryptolusionist puts a spotlight on a classic bull flag formation unfolding on Cardano’s weekly timeframe. After a strong breakout earlier in 2025, ADA entered a healthy consolidation range, which is now likely to observe a breakout soon. The analyst believes that once this consolidation phase completes, ADA could break higher, targeting levels like $1.23 in the mid-term, and potentially even $3.06 further down the road if momentum sustains. In the bigger picture, this adds another layer to the evolving Cardano Price Prediction narrative, where ADA’s quiet grind may be laying the groundwork for its next major leg up.
Right after the breakout, another strong technical signal showed up, this time from the Stochastic RSI. A popular crypto analyst highlighted that ADA’s RSI on the 1 to 4-hour chart dipped into oversold territory. CryptoA4 believes this is a good time for stocking ADA based on the Stochastic RSI oversold conditions.
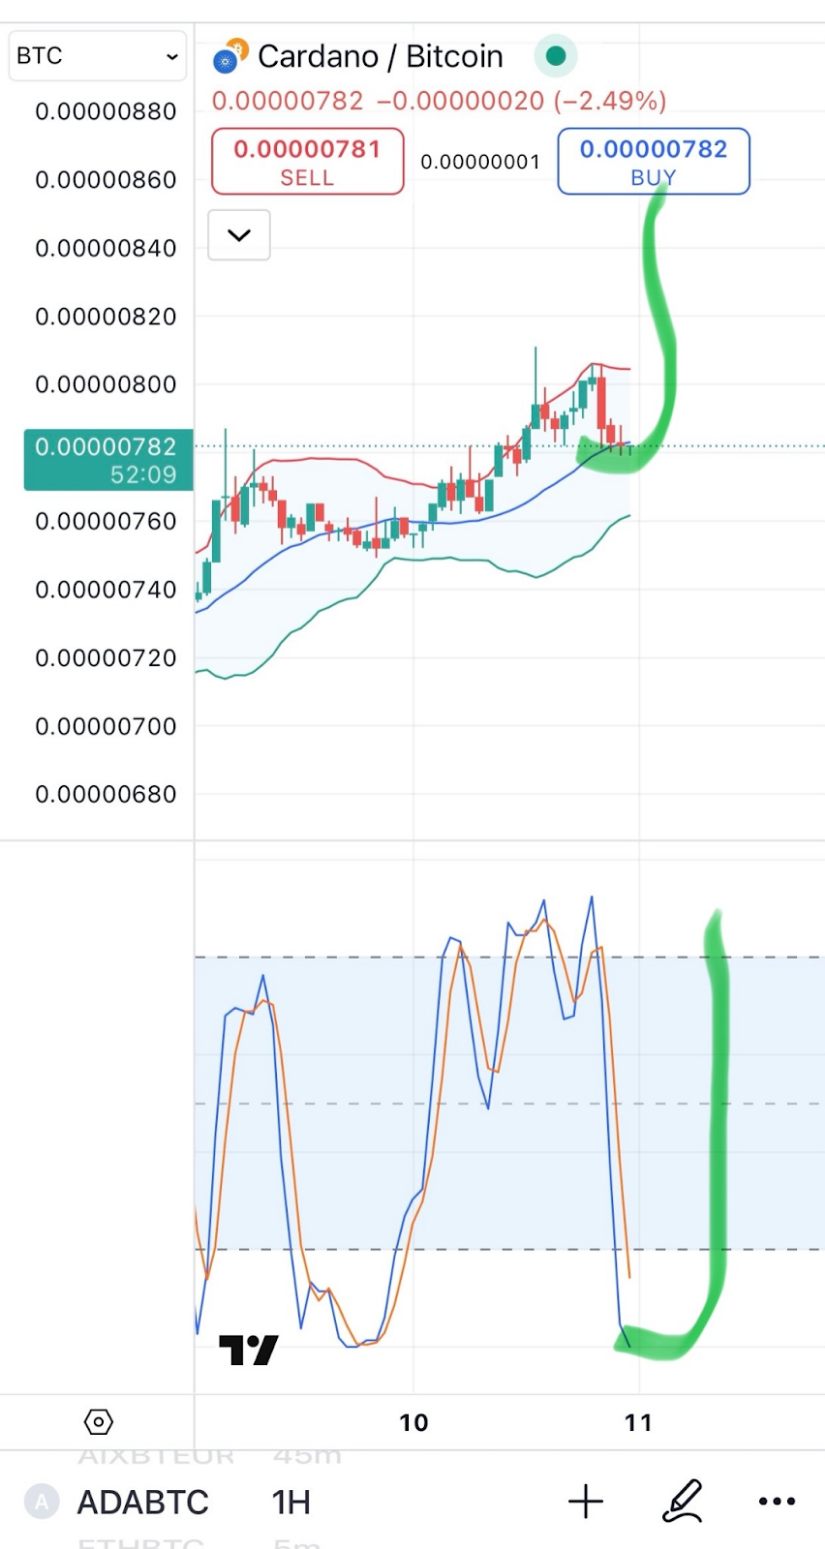
Cardano’s Stochastic RSI flips from oversold on lower timeframes, signaling a potential accumulation opportunity. Source: CryptoA4 via X
While price charts light up and whales continue stacking ADA, there’s something deeper driving confidence in Cardano. As analyst Cardano YOD₳ highlights, this blockchain is governed entirely on-chain by its community through DReps. That’s not just a feel-good feature; it’s a real structural edge. With no CEO or central authority, Cardano avoids the single points of failure. As this governance model matures and power shifts fully into the hands of users, it’s no surprise that smart money is quietly positioning ahead of the curve.
Cardano’s quiet strength is starting to speak up. From whale accumulation to rising volumes and bullish setups, Cardano is quietly stacking positive signals across the board. The recent 40M ADA whale buy-in shows smart money isn’t sitting idle, while the volume surge confirms that interest is coming back fast.
On the technical side, ADA is having $0.85 and $0.90 as short-term targets, while the weekly bull flag suggests potential for $1.23 and higher if the trend holds. With the RSI bouncing from oversold and buyers stepping in, the Cardano price prediction is starting to lean bullish, but in a technically supported way.
XRP is once again at the center of investor speculation, with its price climbing toward the key psychological barrier of $2.50.
The bullish rally, fueled by technical indicators and shifting macroeconomic dynamics, has traders asking whether Ripple’s native token can break through resistance and retest the $3 mark later this May.
According to market data, XRP is currently trading around $2.40, maintaining an upward trajectory despite short-term volatility. Analysts attribute this move to a breakout above a long-standing descending trendline, coupled with growing optimism following the partial resolution of the XRP SEC lawsuit.
Even as the XRP price surges, recent whale activity has raised questions about the sustainability of this rally. Blockchain tracker Whale Alert reported two massive transactions—each involving 29.53 million XRP—moved to centralized exchange Coinbase within six days. Valued at nearly $134 million, these transfers are interpreted as potential sell-offs by large holders.
29.5 million XRP, worth $69.5 million, was transferred from an unknown wallet to Coinbase. Source: Whale Alert via X
“High-volume transfers to exchanges often suggest liquidation intent,” said on-chain analyst Ali Martinez, noting that these movements came just as XRP crossed the $2.35 threshold. While these sales could suppress short-term gains, on-chain data also shows a sharp drop in total XRP exchange inflows—from over 2 billion to just 14.5 million, signaling reduced sell pressure.
The contradictory behavior hints at a divided market sentiment. Some large holders may be taking profits, while others seem content to hold their Ripple assets off exchanges in anticipation of further gains.
Several technical signals reinforce the bullish outlook. The SuperTrend indicator, widely used to identify trend reversals, turned green for the first time since March after XRP broke above $2.36. The last time this occurred—in November 2024—XRP surged from $0.50 to over $3.30.

Ripple is forming a symmetrical triangle on the 8-hour chart, hinting at a possible breakout toward $3. Source: Whales_Crypto_Trading via X
“The breakout above $2.36 triggered a new buy signal,” Martinez said on X (formerly Twitter), adding that a move beyond $2.50 could open the door to targets of $2.70 and $3.00. The inverse head-and-shoulders pattern identified by analyst Jeff Moore adds further weight to these projections, with extended targets ranging up to $3.10.
Momentum indicators support this thesis. The Moving Average Convergence Divergence (MACD) remains firmly in bullish territory, while the Relative Strength Index (RSI) sits at a healthy 61.77, suggesting room for further upside without overbought conditions.
Fueling the bull case is the latest XRP lawsuit news, Ripple has reached a settlement with the U.S. Securities and Exchange Commission (SEC) for $50 million. This is significantly less than the original $125 million penalty pursued by regulators, and market participants view this as a win for Ripple and the crypto community at large.
The deal provides badly needed clarity and closure,” said a source familiar with the Ripple legal team. The court must still approve, but the ruling has already infused new life into Ripple XRP news reports and investor demand.
The resolution marks a turning point for the Ripple market, which has long been overshadowed by regulatory uncertainty. Improved clarity around SEC Ripple policies, especially with Paul Atkins leading a more crypto-friendly SEC, could provide a more stable environment for Ripple exchange activity going forward.
XRP’s rally is part of a broader altcoin recovery, driven by Bitcoin’s surge past $104,000 and Ethereum’s 26% weekly gain. In the last seven days, the Ripple currency price has gained over 9%, with trading volumes surpassing $4.2 billion and total market cap reaching $140 billion.
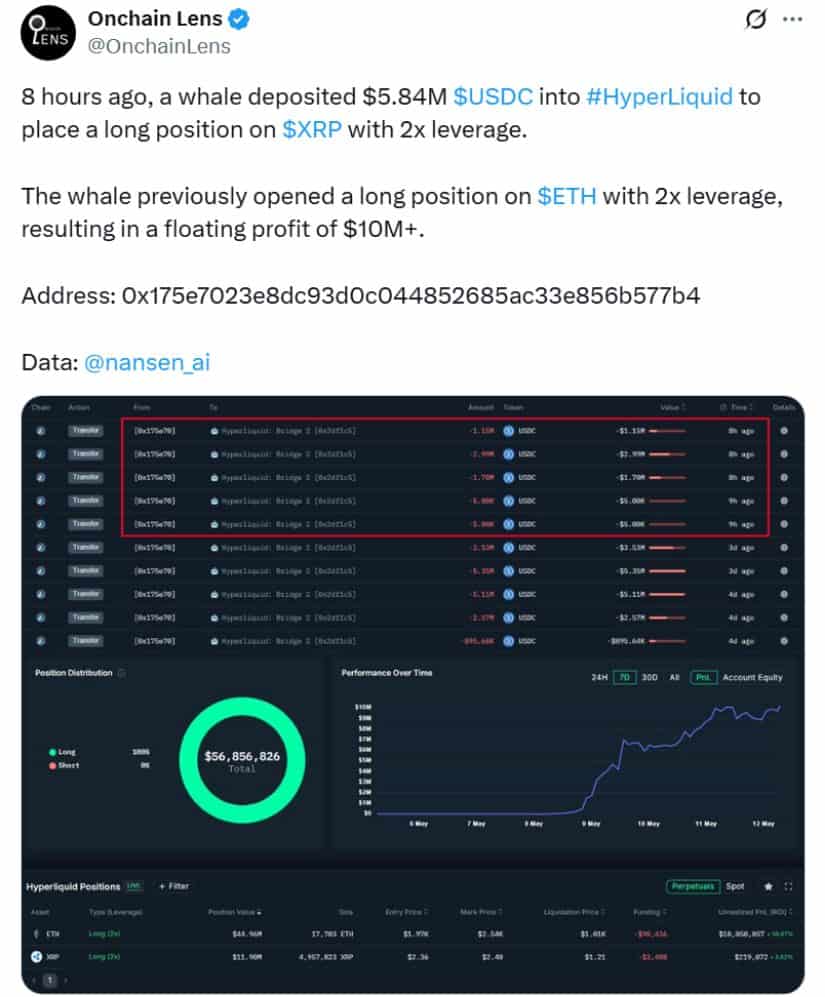
A whale placed a 2x leveraged long on XRP by depositing $5.84M USDC into HyperLiquid. Source: Onchain Lens via X
Adding fuel to the fire, a major whale made headlines by placing a $6 million long position on XRP via decentralized derivatives exchange HyperLiquid. The same investor previously profited from a leveraged ETH position and now appears confident that Ripple crypto has more room to run.
Meanwhile, geopolitical optimism, spurred by a recent U.S.-U.K. trade pact and ongoing discussions with China—is boosting global investor confidence. The Fear and Greed Index has surged to 78, marking a sharp rise from last week’s neutral reading of 49.
Despite the positive indicators, caution is warranted. XRP is currently consolidating around $2.34–$2.40, with immediate resistance between $2.45 and $2.50. A clean break above this range could set the stage for a retest of $2.70 and, ultimately, $3.00 or higher.
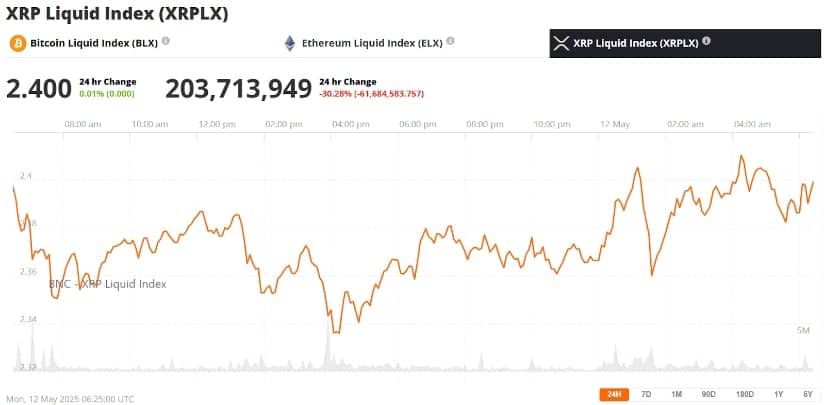
XRP was trading at around $2.40 at press time. Source: Source: XRP Liquid Index (XRPLX) via Brave New Coin
However, failure to breach $2.50 decisively may lead to a short-term correction. Analysts are watching support at $2.32 and $2.28 closely. A slip below $2.05 could invalidate the bullish setup.
Open Interest (OI) data also shows a 2.21% decline, reflecting cautious sentiment in derivatives markets. Total long liquidations in the past 24 hours reached $8.85 million, compared to $762,000 in shorts, signaling ongoing volatility.
The XRP price prediction for May hinges on whether it can break the $2.50 resistance—a key milestone that could catalyze a run toward $3.00. While technical indicators, macro trends, and Ripple lawsuit updates favor the bulls, whale activity and falling derivatives interest suggest the path upward may not be straightforward.
For now, traders and investors are watching closely as XRP teeters on the edge of a potential breakout.
Solana price has rallied for two straight weeks and is now hovering at its highest level since February, and technicals suggest that the rally is just getting started.
Solana (SOL) rose to $177 on Monday, up by 85% from its lowest level in April, giving it a market cap of over $90 billion.
The surge has coincided with ongoing gains in the crypto and stock markets. Most importantly, it happened as most Solana meme coins jumped, bringing their market cap from $6 billion in April to $15 billion today.
Some of the top-gaining Solana meme coins have been Dogwifhat (WIF), Popcat (POPCAT), Peanut the Squirrel (PNUT), and Gigachad (GIGA).
This growth has triggered more inflows in decentralized finance protocols in the Solana ecosystem, bringing the total value locked to almost $10 billion.
It has also led to further stablecoin growth on the network, with total funds rising to nearly $14 billion. Higher stablecoin activity is a sign that a crypto network is more active, as these tokens are commonly used to facilitate transactions.
Solana’s price has jumped as volume on its decentralized exchanges (DEXs) continues to rise. It handled transactions worth over $3.4 billion in the last 24 hours, higher than BSC’s $2.65 billion and Ethereum’s $2.1 billion. It processed transactions worth $82 billion in the last 30 days, much higher than Ethereum’s $37 billion.
Solana also has more potential catalysts, including the upcoming SOL ETF approvals and accumulation by Wall Street firms like Janover and Upexi. It will likely benefit further as Bitcoin (BTC) is expected to continue rising in the coming months.
The weekly chart shows that Solana has rallied from last month’s low of $94.50 to $176. It remains slightly below the critical resistance level at $258, which marks the upper boundary of the cup-and-handle pattern that has been forming since November 2021.
Solana has stayed above the 50-week moving average, while both the Relative Strength Index (RSI) and the MACD are pointing upward.
The cup has a depth of about 97%, suggesting a potential price target of $500. This target is derived by projecting the same distance from the top of the cup. A drop below the lower boundary of the handle at $94.50 would invalidate the bullish outlook.


