The main tag of cryptocurrency price today Articles.
You can use the search box below to find what you need.
[wd_asp id=1]
The main tag of cryptocurrency price today Articles.
You can use the search box below to find what you need.
[wd_asp id=1]
Despite sellers’ pressure, most of the coins remain in the green zone at the beginning of the week, according to CoinMarketCap.
The rate of DOGE has risen by 4.43% over the last 24 hours.
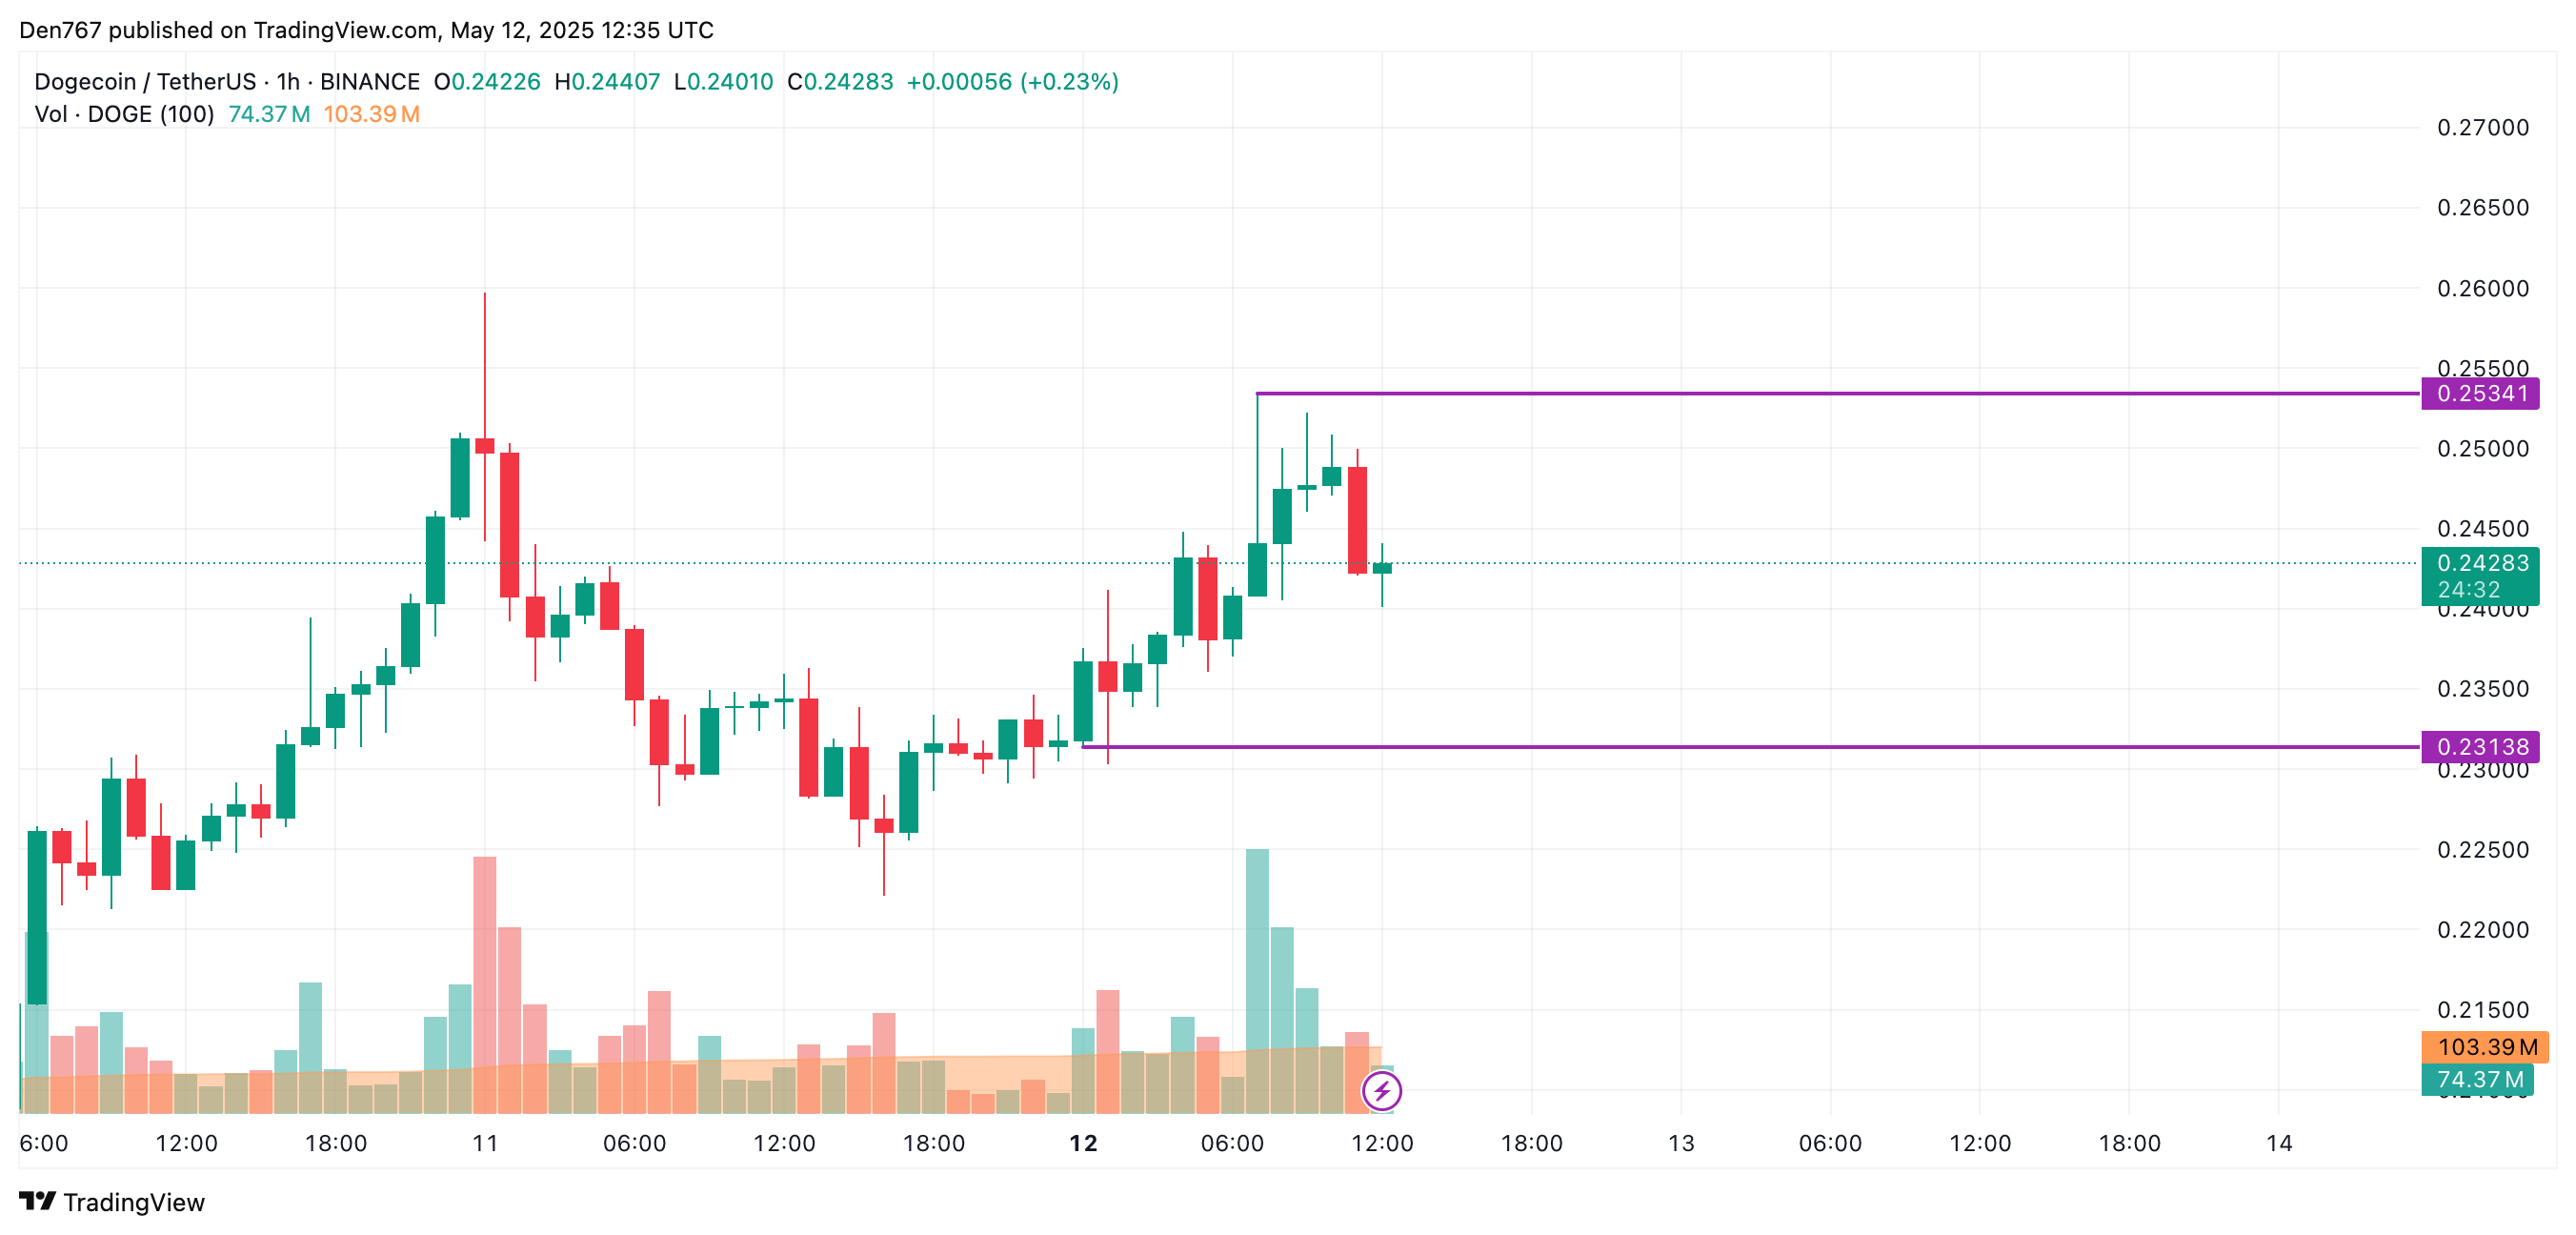
On the hourly chart, the price of DOGE might have set a local resistance of $0.2534. As most of the daily ATR has been passed, there are low chances of seeing sharp moves by tomorrow.
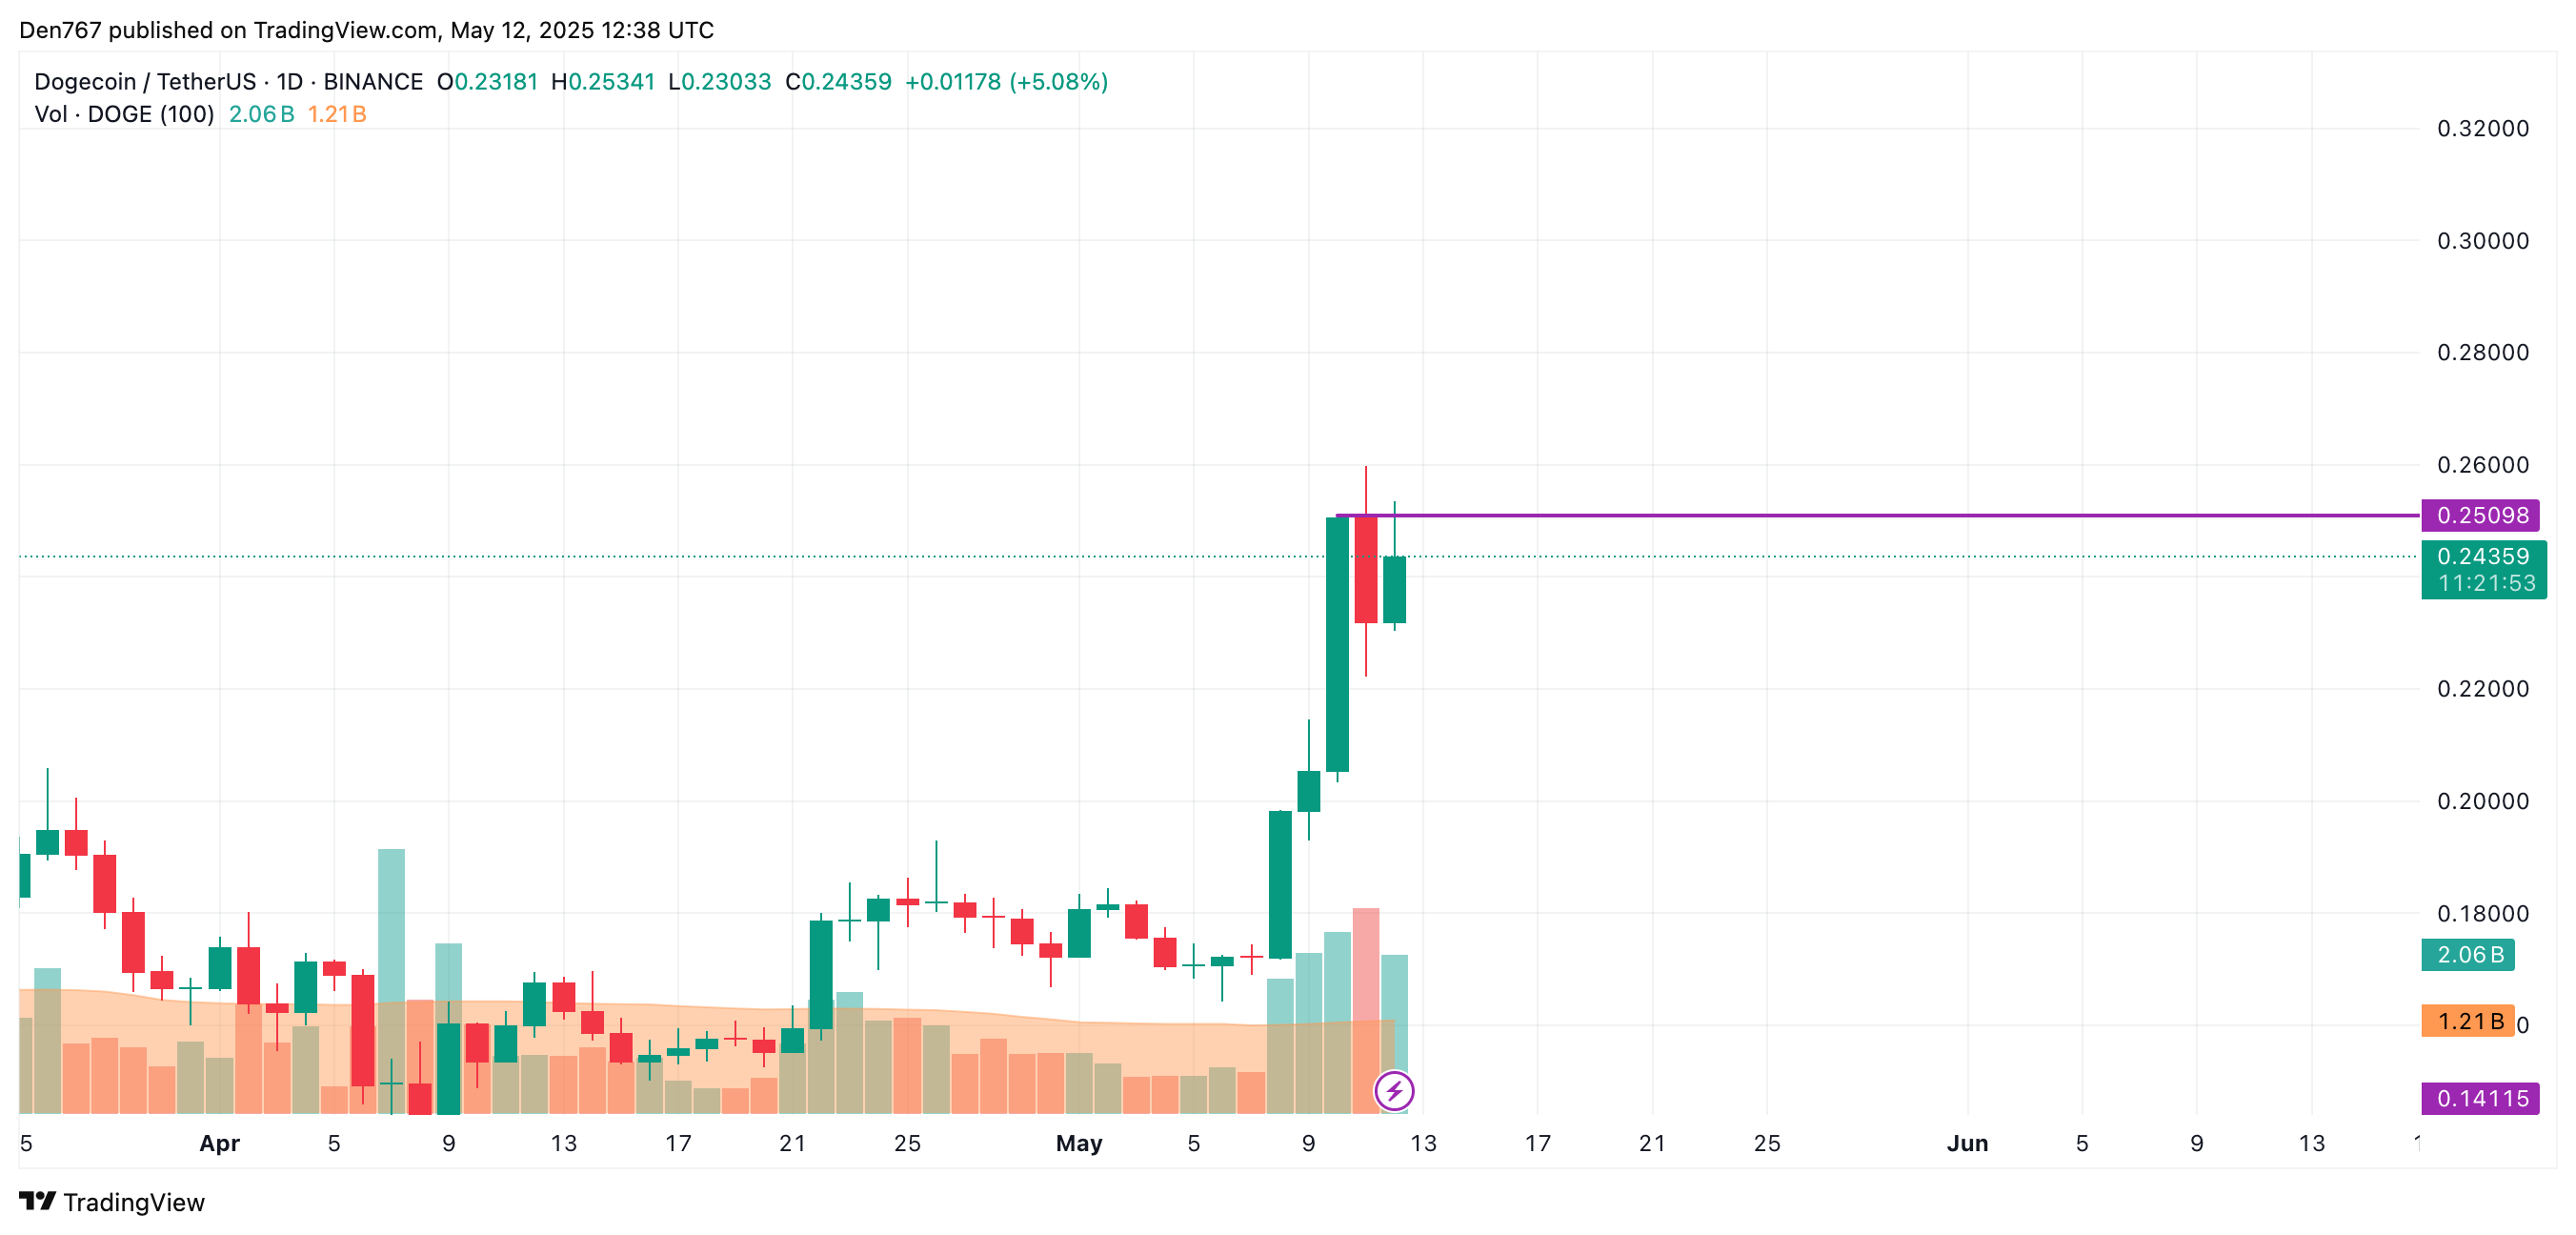
On the bigger time frame, the rate of the meme coin has once again bounced off the resistance of $0.2509.
You Might Also Like
If the daily candle closes far from that mark, one can expect correction to the $0.23 zone.
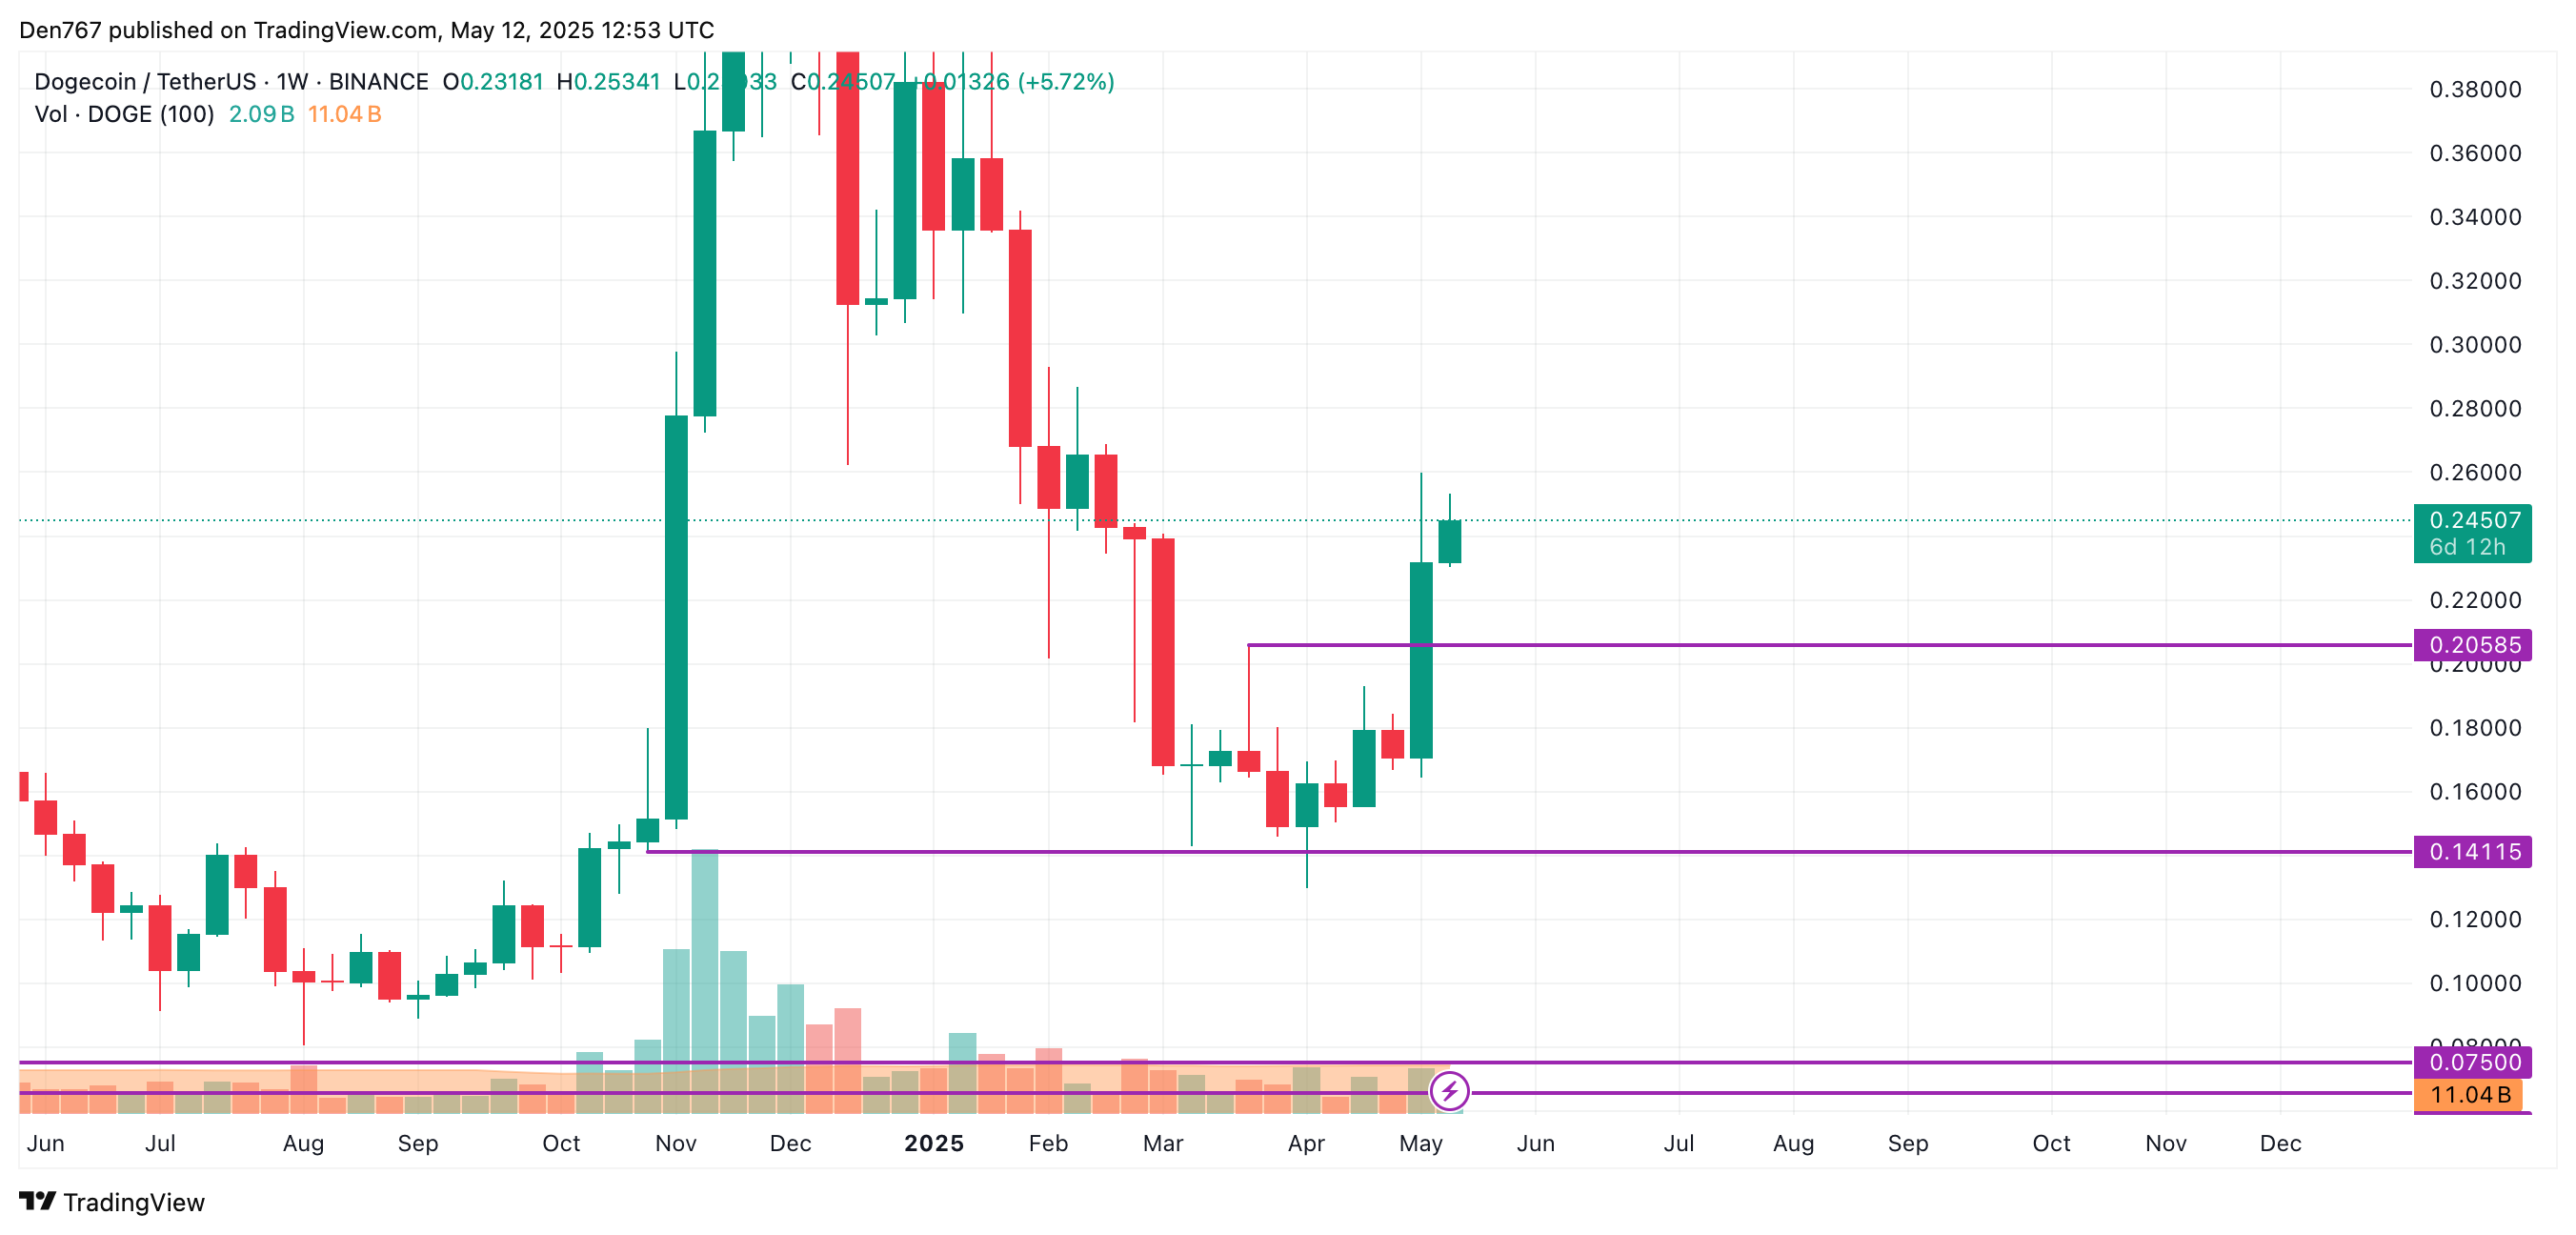
From the midterm point of view, one should focus on the bar’s closure in terms of the previous candle high. If it happens around $0.26 or above, the growth is likely to continue to the $0.30 range.
DOGE is trading at $0.2450 at press time.
XRP’s price has performed well since 2024, and analysts predict further growth in the coming years. The bullish case rests on key catalysts such as a potential Ripple ETF approval, its growth in the money transfer industry, and its role in the stablecoin market. This article explores XRP’s potential price if its market cap hits $1 trillion.
XRP has grown to become the fourth-biggest cryptocurrency with a market cap of over $138 billion. It is only smaller than Bitcoin, Ethereum, and Tether.
Therefore, XRP needs to rise by 625% from the current price for its valuation to reach $1 trillion. This is plausible considering it previously increased by almost 500% between its lowest and highest levels in November last year.
XRP’s price has increased from $0.005 in August 2013 to $2.37, reflecting a 47,100% rise. As such, it is possible to increase by 625%. If this happens, the price needs to reach $17.20.
This estimate, however, is based on the current circulating supply of 58.55 billion. Its circulating supply increases by about 1 billion monthly, with unsold tokens returning to escrow. If XRP surges to $17, then its fully diluted valuation would reach $1.7 trillion.
Based on the current XRP and BTC market ratio of 0.0721, this implies Bitcoin would reach a market cap of over $13.53 trillion. Going by the current circulating supply, it means that Bitcoin’s price would be trading at $683,333, lower than BlackRock’s target of $700,000.
Read more: Ethereum Price Hits $2,500: Smart Money Targets $3K
The XRP price has several catalysts that may push its market cap to over $1 trillion. Its low-hanging fruit is the upcoming ETF approval by the Securities and Exchange Commission (SEC). Analysts expect the agency to approve these funds, with the Polymarket odds rising to 77%.
Further, Brad Garlinghouse aims to disrupt the $150 trillion a year business that Swift currently dominates. It aims to enroll more banks to its RippleNet platform, offering faster transactions.
XRP may also benefit from its focus on stablecoins, a market projected to reach $1.6 trillion by 2030. The company owns Ripple USD (RLUSD), and it recently wanted to acquire Circle, the owner of USD Coin (USDC).
Further, Ripple Labs acquired Hidden Road, a move expected to boost the volume handled by the XRP Ledger. This, in turn, will lead to a higher XRP burn rate since a portion of transactions are incinerated.

The daily chart shows that the XRP price has moved above the descending trendline that connects the highest swings since January 16. This was an important move as it has crossed the upper side of the falling wedge pattern, a popular bullish reversal sign.
The coin has formed a mini golden cross with the 50-day and 100-day moving averages intersecting. Therefore, the coin will likely have a bullish breakout, with the next point to watch being at $3.40, the highest swing in January. A move above that price will point to gains to $5.
Read more: Crypto Chart of the Week: Pi Network Price Eyes a 70% Surge Ahead of Key News
The Ethereum price today is trading near the $2,500 mark after staging an aggressive breakout from a multi-month downtrend. On the daily chart, ETH surged past the descending resistance line drawn from the December 2024 high, clearing key horizontal levels at $1,950 and $2,200. This Ethereum price spike follows a sharp impulse move that saw ETH rally from below $1,800 to nearly $2,550 in just a few sessions.

This breakout also confirmed a long-awaited trend reversal, invalidating the previous bearish channel. The Ethereum price action shows strong buyer momentum, but as the price now hovers near a major resistance zone, traders are closely watching whether this rally can sustain into May 13.
On the 1D chart, the Ethereum price has successfully broken out of the falling wedge that contained it for most of Q1 2025. This breakout has brought ETH into a significant supply zone between $2,500 and $2,600—an area that previously marked the March breakdown. If bulls manage a daily close above $2,550, the next upside targets lie near $2,750 and the psychological $3,000 level.

Zooming out to the weekly chart, Fibonacci retracement levels from the $4,105 peak to the $1,385 low show that ETH is testing the 0.382 Fib at $2,445, with the 0.5 and 0.618 retracement zones at $2,755 and $3,066 respectively. This aligns with long-term resistance and suggests that a deeper pullback may occur before another leg higher.
On lower timeframes like the 3-hour and 30-minute charts, the Ethereum price volatility is showing early signs of fatigue. After the vertical move, ETH has formed a descending parallel channel—often interpreted as a bullish continuation pattern. However, price is still trading within this range, and confirmation is required for breakout strength.

The RSI on the 30-minute chart has dropped to 45, suggesting waning momentum. MACD shows a flattening of the histogram and a nearing bearish crossover. Meanwhile, Bollinger Bands on the 4-hour chart have narrowed after a wide expansion, hinting at reduced volatility and potential consolidation.

On the 4-hour chart, the Ethereum price is still holding above key EMAs — the 20, 50, 100, and 200 — which reinforces bullish market structure. In particular, the 20-EMA and 50-EMA (near $2,395 and $2,182) may act as dynamic support zones if selling pressure increases.

Despite the overall bullish sentiment, Ethereum price today is facing short-term pressure due to profit-taking after the rapid ascent. The Stochastic RSI has dropped into oversold territory on the 4-hour chart, while momentum indicators are cooling down. This retracement is natural after such a sharp move and doesn’t yet signal a trend reversal.
If buyers defend the $2,450–$2,480 region and break above the $2,560 resistance, the Ethereum price could resume its uptrend. However, failure to hold the current level might lead to a short-term retrace back toward $2,395 or even the previous breakout point at $2,180.

Heading into May 13, ETH remains in a bullish structure but may undergo a brief consolidation phase. The descending channel on the 3-hour chart needs to break to the upside for renewed momentum. A clean break above $2,560 opens up a path toward $2,750 and $2,900. On the flip side, losing $2,395 could accelerate a drop toward $2,180.
| Zone | Level (USD) | Significance |
| Immediate Resistance | $2,560 | Supply zone, horizontal resistance |
| Short-Term Support | $2,450 | Lower channel boundary |
| Strong Support | $2,395 | EMA zone, Bollinger Band median |
| Breakdown Risk Level | $2,180 | Previous resistance turned support |
| Upside Target 1 | $2,755 | 0.5 Fib retracement |
| Upside Target 2 | $3,066 | 0.618 Fib, psychological zone |
The Ethereum price update suggests that while momentum has slowed after a vertical run, the bullish structure remains intact. As long as ETH holds above $2,395–$2,450, the rally could extend toward $2,750 or higher. However, traders should watch for any breakdown below $2,180 that could challenge the recent breakout narrative. Stay tuned for further coverage on whether this bullish reversal holds or gives way to renewed Ethereum price volatility.
Disclaimer: The information presented in this article is for informational and educational purposes only. The article does not constitute financial advice or advice of any kind. Coin Edition is not responsible for any losses incurred as a result of the utilization of content, products, or services mentioned. Readers are advised to exercise caution before taking any action related to the company.
Investors with $10,000 in XRP could witness an impressive increase in their investments over the next five years depending on XRP’s growth rate.
Community commentators like Edoardo Farina believe investors should leverage this phase to amass more XRP tokens. In particular, Farina has championed the narrative that an investor ought to hold at least 10,000 XRP to secure a successful future. These suggestions come from confidence in XRP’s potential.
Amid the bullish sentiments, The Crypto Basic sought to determine how much an investment of $10,000 in XRP today could yield by 2030, essentially five years later. To assess this, we sourced XRP price predictions from multiple platforms, including Changelly, and AI chatbots Google Gemini and xAI’s Grok.
Notably, Gemini suggested that XRP’s bear case for 2030 could see the asset trade at a low of $0.13, representing a 94% decline from the current price of $2.18. According to the chatbot, this could materialize if XRP sees limited adoption, heightened competition, and regulatory setbacks.

Meanwhile, Gemini sees XRP rising to between $5.10 and $6.28 by 2030 in its base case, a 134% to 188% rise. It cited the gradual adoption of XRP for cross-border payments. However, the bull case projects an XRP price surge to a range of $12.68 to $29.32, based on institutional adoption, XRP ETF approval, and XRP’s role in tokenization and payments.
Notably, $10,000 in XRP currently amounts to 4,587 XRP tokens. If XRP trades at Gemini’s bear case of $0.13, these tokens would be worth $596 by 2030. However, the base case would push their worth to a range of $23,394 to $28,807. In the bull case, they would be valued at $58,165 to $134,495.
Grok AI believes XRP’s bear case would only see the asset trade at $1.5 by 2030, citing regulatory challenges and competition. It sees XRP hitting $5 by 2030 in the base case if it observes steady adoption in cross-border payments. However, a bull case could push XRP to $12 based on widespread institutional adoption.

Essentially, the 4,587 XRP (currently worth $10,000) would drop to $6,880 in 2030 if Grok’s bear case materializes. For the base case, the tokens would rise to $22,935. Nonetheless, the bull case would push the worth of these tokens to $55,045 by 2030.
Meanwhile, analysts at crypto platform Changelly believe XRP would close 2030 with a minimum price of $18.48 in December and an average price of $19.12. They believe the asset’s maximum price sits at $21.25 for December 2030.

If follows this forecast, the 4,587 tokens would be worth $84,770 in the minimum case and $87,706 for the average case. Further, the investment would grow to $97,477 when considering the maximum price prediction for December 2030.
DisClamier: This content is informational and should not be considered financial advice. The views expressed in this article may include the author’s personal opinions and do not reflect The Crypto Basic opinion. Readers are encouraged to do thorough research before making any investment decisions. The Crypto Basic is not responsible for any financial losses.
XRP is currently trading at $2.37, down a minimal 1.62% for the day. Trading volume for a 24-hour period jumped by 9.84% to $4.32 billion, reflecting increased activity by investors. In a week, XRP is up 9.46% and is showing increased momentum with investors looking toward key support points.
XRP’s current trend, a symmetrical triangle pattern spanning a few years, is seen by crypto analyst Ali as potentially building up for a huge breakout. If true, technical estimates put XRP’s target as high as $15. This is based on measuring the pattern’s peak height, from a high point of $3.50 back in 2018 down to 2020’s lows, and extending it vertically from the expected breakout at about $2.40.

This technical optimism has come at a time when a market-wide bullish mood has been ignited partly by regulatory clarity following Ripple’s partial win in its legal battle against the US Securities and Exchange Commission (SEC). The recent crossing and break of the upper trendline in May 2025 adds additional validity to a breakout thesis.
The extended legal battle spanning years between Ripple Labs and the SEC has been a source of uncertainty for all the holders of XRP. Commencing in December 2020, the dispute was about whether or not XRP is a security. Now, with a settlement agreed, Ripple will pay $50 million, a far lesser figure than the initial $125 million requested by the SEC. The move is regarded as a landmark moment toward firmer crypto regulation within the U.S.
The settlement, achieved by Judge Analisa Torres, also removes earlier injunctions against executives Bradley Garlinghouse and Christian Larsen of Ripple. With regulation relaxed, Ripple is able now to turn attention back to growth measures, including cross-border payment innovations. The price of XRP’s response to this resolution is reflective of renewed confidence among investors as well as release from ongoing legal uncertainty.
This result is also seen as a future benchmark for dealings by the SEC with crypto companies, signaling an approach to more collaborative regulation.
Predictive platforms, such as DigitalCoinPrice, are forecasting that the coin will surpass $5.18 by 2025, crossing over the next hurdle at $3.84. Analysts are predicting that XRP will remain within a band of $4.98 to $5.18 before it goes for even greater highs.
The technical setup, lowered legal burdens, and rising market sentiment put together point towards substantial upside for the coin. However, past volatility is a cautionary note for traders.
Related Reading | Bitcoin’s Hidden Signal Hits Rare Level—Watch What Happens Next
Dogecoin (DOGE) has reignited market excitement, surging more than 24% in a single day as bullish indicators and massive whale accumulation drive optimism for a potential rally toward the long-anticipated $1 mark.
This resurgence marks one of Dogecoin’s strongest rallies in recent months, reinforcing its reputation as a bellwether for meme coins and altcoins alike.
One of the most notable catalysts behind Dogecoin’s explosive move is the substantial accumulation by large holders. On May 11, renowned analyst Ali Martinez revealed that whales snapped up over 600 million DOGE in just 48 hours. This accumulation, captured in on-chain data from Santiment, reflects heightened activity among wallets holding between 100 million and 1 billion DOGE.
Dogecoin whales have accumulated over 600 million DOGE in the past 48 hours, signaling renewed confidence among large investors. Source: Ali Martinez via X
Historically, such buying behavior by major holders—often referred to as “smart money” — has preceded major price movements. The timing of this accumulation aligns closely with Dogecoin’s breakout above key resistance levels, sparking speculation of a larger bullish trend underway.
A number of technical indicators are currently flashing green for Dogecoin, painting an optimistic picture for both short-term traders and long-term investors. According to data from CentralCharts, DOGE has broken past the upper Bollinger Band at $0.234 and the 100-day moving average around $0.197 — both considered significant resistance levels.

DOGE has awakened from its post-ATH slumber, with rising interest and a massive Cup & Handle pattern forming on the 21-day chart. Source: ELON_T3SL4 on TradingView
Now trading near $0.2571, Dogecoin is above a critical pivot zone labeled “Oblique Minor Resistance” on the charts. A daily close above this mark could confirm further upside, potentially targeting $0.30 in the near term. Trading volume supports this move, with CoinMarketCap reporting a 46.8% spike in 24-hour volume, totaling $3.47 billion.
“$DOGE is pumping hard,” crypto trader Ash Crypto posted on X (formerly Twitter). “Historically, DOGE pump starts the altseason. Let’s hope for the same this time!”
Adding to the bullish sentiment, Dogecoin has just recorded a MACD crossover on the weekly timeframe, a signal that has historically preceded major rallies. As highlighted by analyst Trader Tardigrade, previous MACD crossovers in October 2023 and September 2024 triggered price surges of 285% and 460%, respectively.
The current technical setup mirrors those prior events, with a rounded bottom formation and the MACD line crossing above the signal line. This pattern suggests that Dogecoin may be entering a fresh impulsive wave, potentially driving it toward the much-discussed $1 milestone.
DOGE is currently trading around $0.23 to $0.26, but if the trend repeats, analysts believe the meme coin could rally toward $1 by mid-2025, guided by a long-term ascending trendline that has served as resistance in previous cycles.
The Dogecoin network appears to be gaining traction among both retail and institutional traders. On the 1-day timeframe, TradingView’s technical summary shows 15 moving averages issuing “Buy” or “Strong Buy” signals, indicating strong momentum across timeframes.

Dogecoin (DOGE) was trading at around $0.25 at press time. Source: Brave New Coin
While some oscillators suggest DOGE might be entering overbought territory, the Relative Strength Index (RSI) reading of 2.51, although high—isn’t uncommon during early-stage breakouts. For many Dogecoin investors, this remains a bullish confirmation rather than a warning.
In the broader context of Dogecoin prediction models, sentiment varies. Some conservative forecasts see DOGE trading between $0.12 and $0.22 throughout 2025. However, growing community optimism and endorsements from influential figures like Elon Musk continue to fuel belief in a breakout year for the world’s most famous meme coin.
While technicals and market behavior point toward a potential rally, the road to $1 won’t be without resistance. Dogecoin has faced multiple challenges, breaking past major psychological price barriers. However, its recent surge, combined with a macro environment where Bitcoin trades above $100,000, could provide the tailwind needed to reach new highs.
From whale accumulation to key breakout patterns, all signs suggest that Dogecoin is not just making noise—it may be gearing up for one of its most significant runs in years. Whether it can sustain momentum and overcome the $1 resistance remains to be seen, but the current trajectory certainly has Dogecoin investors watching closely.
As it stands, Dogecoin’s rally appears well-supported by both technical indicators and on-chain metrics. The DOGE price is benefiting from a confluence of positive factors — including whale activity, technical crossovers, and bullish sentiment—setting the stage for what could be a landmark moment for the meme coin.
If the current trend holds and past performance repeats, DOGE price prediction models aiming for $1 by mid-2025 may not be far-fetched. For now, all eyes remain on Dogecoin’s next move.
XRP surged to a seven-week high this weekend, briefly touching $2.48 before retracing slightly near the $2.40 support, suggesting potential for further gains ahead.
The rally was largely fueled by speculation that BlackRock may soon file for an XRP-spot ETF—an event that could significantly reshape market sentiment and demand for Ripple’s native token. The XRP price jumped 5.44% on Saturday, May 10, driven by renewed investor optimism surrounding institutional adoption and potential resolution in the ongoing XRP lawsuit.
A leaked letter posted by a crypto enthusiast claimed BlackRock had held discussions with the U.S. Securities and Exchange Commission (SEC) about expanding its crypto ETF offerings. While the asset manager has yet to confirm an XRP spot ETF filing, the rumor was enough to ignite enthusiasm among traders. “BlackRock XRP ETF is coming soon!” the post read, pointing to a broader shift in the SEC’s openness toward digital asset exchange-traded products.
BlackRock is in talks with the SEC Crypto Task Force to pave the way for an XRP ETF approval. Source: XRP Dragon via X
Although BlackRock has not commented, its previous silence and its massive success with the iShares Bitcoin Trust (IBIT)—which has attracted over $44 billion in inflows—suggest the firm could be laying the groundwork for additional crypto market exposure, including XRP.
XRP’s weekend performance underscored a positive technical setup. On the daily chart, XRP closed near the $2.48 mark, signaling bullish continuation. Analysts observed that if the token can decisively break above the $2.50 resistance level, it could open the door to testing higher zones near $2.75 and beyond.

XRP price was ranging from $2.35 to as high as $2.47 on May 11. Source: XRP Liquid Index (XRPLX) via Brave New Coin
According to CoinStats, XRP rose from $1.68 to $2.41 within 24 hours, a gain of roughly $0.73. The market-wide rally also contributed to the momentum, but XRP stood out with a particularly strong performance among large-cap tokens.
Despite this, profit-taking capped gains below $2.50. Market analysts believe XRP needs sustained volume and a strong daily candle close above $2.475 to unlock further upside. “A breakout above this level could unleash enough bullish energy to test the $2.60 area,” noted Sophie Kim in a report for TokenPost.
Another major catalyst in XRP’s rise is a possible resolution in the Ripple lawsuit. The SEC has reportedly filed a settlement letter with the court, requesting the removal of the longstanding injunction against Ripple’s institutional XRP sales. The regulator also hinted that it will cut Ripple’s $125 million penalty to a lesser figure, most likely making a way for the two to forego their reciprocal appeals.
If approved, this would mark the conclusion of perhaps one of the most important legal fights in the crypto world. Ripple has argued for some time now that XRP is not a security, and a favorable court decision could open the door to institutional investment.
Legal expert Eleanor Terrett noted the regulatory tone has shifted dramatically in recent months. “The Crypto Task Force has now held nearly 100 meetings with industry participants since February. That’s a stark contrast to the last four years,” she said.
This potential legal clarity could remove a long-standing cloud over the Ripple crypto project, boosting investor confidence and legitimizing XRP further in the eyes of regulators and institutions.
The broader market mood is also amplifying XRP’s rally. According to the Ripple (XRP) Fear and Greed Index, investor sentiment has reached “Extreme Greed” levels, with a reading of 65. This marks a significant rise from 49 just a week earlier, reflecting a sharp turnaround in market mood.
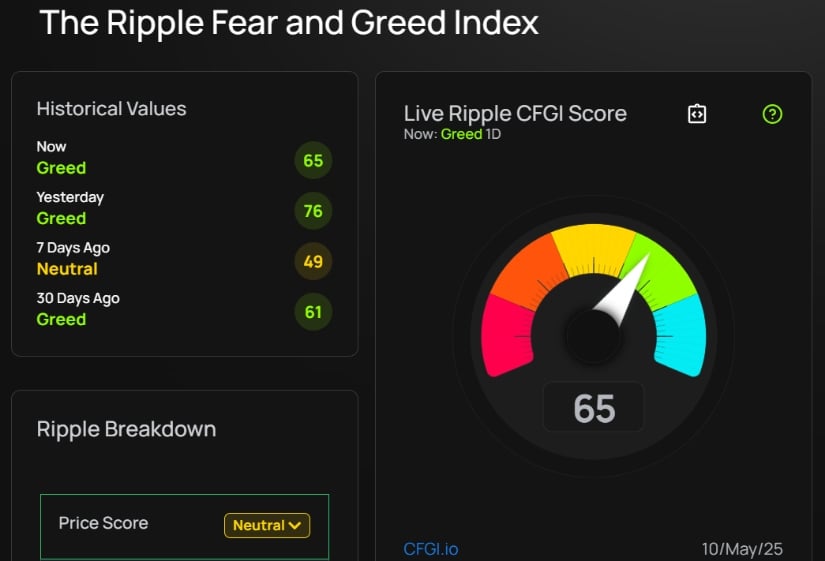
XRP’s Fear and Greed Index has surged to 65, signaling strong greed after jumping from 49 just a week ago. Source: cfgi.io
Social volume, price momentum, and bullish technical indicators all point to heightened investor activity. Notably, XRP has now tested the $2.50 resistance level three times in the past month, each time facing rejection due to profit-booking and market hesitancy. However, current momentum suggests another breakout attempt may be imminent.
“Volume remains elevated, with weekly averages trending 38% above the 30-day mean,” noted analysts from CoinGape. The sustained interest, coupled with strong technical support at $2.24, could create a base for XRP to aim higher in the coming sessions.
Adding to the bullish sentiment is an improvement in global macroeconomic sentiment. High-level trade talks between the U.S. and China resumed in Geneva over the weekend, raising hopes of reduced tariffs and softer trade policies.
President Donald Trump’s recent comments indicated flexibility in ongoing negotiations, stating, “80% tariff on China seems right! Up to Scott B,” referring to U.S. Treasury Secretary Scott Bessent. Analysts believe that Trump’s softer stance could help ease inflation fears and inject renewed confidence into risk assets like cryptocurrencies.
These geopolitical developments are contributing to capital rotation into digital assets, especially those with strong institutional narratives—such as XRP.
As XRP continues to trade firmly above the 50-day and 200-day exponential moving averages, the technical configuration is still bullish. With the Relative Strength Index (RSI) of 63.30, there is still ample space for a move higher prior to reaching overbought status.
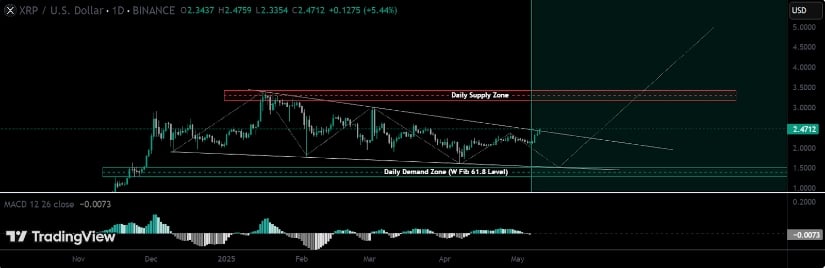
XRP aligns with the weekly 61.8% Fib level, eyeing targets at $3.20–$3.43. Source: ThatBeardedDude on TradingView
Market watchers are now setting their sights on $2.75 as the next key price target. A successful breach of the immediate resistance could open the floodgates towards the $3.00 psychological level and potentially test the 2025 high of $3.3999, especially if regulatory clarity arrives sooner rather than later and BlackRock’s ETF speculation gains credibility.
Conversely, a dip below the support at $2.24 will invalidate the short-term bullish story, subjecting the price of XRP to a potential retracement to $1.93.
XRP is currently navigating a pivotal moment, balancing between technical resistance and strong bullish fundamentals. Speculation about a BlackRock XRP-spot ETF, progress in the XRP SEC lawsuit, and global economic optimism are aligning to provide significant tailwinds.
Whether XRP can convert this momentum into a sustained rally will depend on developments in the Ripple lawsuit update, SEC ripple posture, and broader market sentiment. For now, traders and investors are closely watching the $2.50 mark, which could unlock the next leg in XRP’s journey toward new highs.
SOL Solana Price eyes $212 after bullish pennant breakout, with global liquidity and technical setups fueling momentum.
Solana’s strength is quietly building, with steady weekly trends, strong chart setups, and solid on-chains. The focus is now on the $212 level, and with global liquidity lending a hand, the Solana price prediction is shaping up to be one of the more interesting discussions within the Solana community
After a major rally of almost 25% by Solana in April is gaining attention. A new chart shared by CryptoCurb is turning heads, showing a clear correlation between Solana’s price action and global liquidity trends. The data, pulled from GMI’s Total Liquidity Index with a 12-week lead, reveals how closely SOL Solana price has historically followed moves in broader liquidity cycles.
Solana’s price tracks closely with global liquidity cycles, highlighting a key macro correlation. Source: CryptoCurb via X
While this doesn’t guarantee a rally, the timing is notable. Solana has already been showing strong relative strength among Layer 1s, and this liquidity tailwind could give bulls another reason to lean in. As always, it’s worth keeping an eye on broader macro trends because when liquidity flows, assets like SOL often respond quickly.
With global liquidity turning upward, Solana may be entering a phase where strong technical setups start to matter again, and one is already taking shape. Analyst MartyParty highlights a clear bullish pennant breakout on the daily chart, with a projected target near $212. This kind of formation, typically seen as a continuation pattern, suggests that the upward trend is ready to resume after a healthy consolidation phase.

Solana breaks out of a bullish pennant, eyeing a $212 target as momentum builds. Source: MartyParty via X
Volume has started to pick up, and price structure shows SOL grinding higher with higher lows, indicating growing buyer interest. The $175 to $180 zone remains key in the short term; a solid hold above this range could open the door to that $212 target. While nothing is guaranteed, the alignment of macro liquidity trends and this fresh Solana Price Prediction adds weight to the bullish scenario.
Solana’s recent climb into the $172 to $174 region is drawing more than just technical attention as liquidation activity is heating up fast. According to the 12-hour liquidation heatmap from CoinGlass, this zone is stacked with high-leverage positions, both long and short.
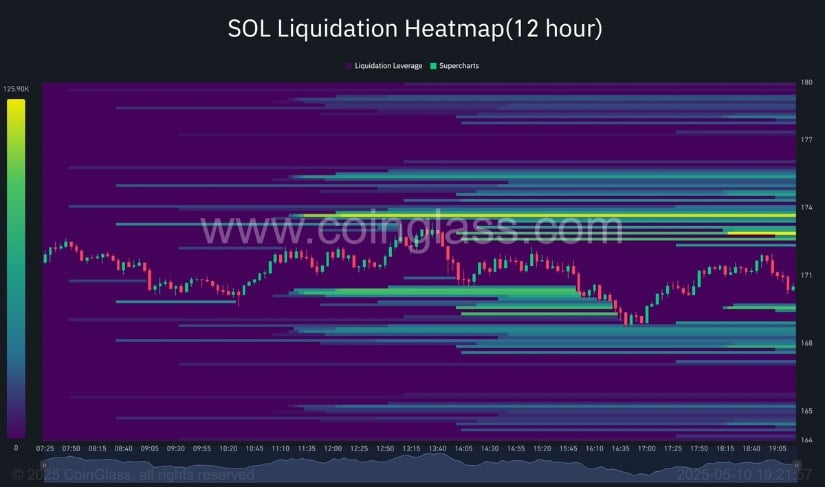
Solana faces growing liquidation pressure as price tests key $172–$174 zone, potentially fueling volatility. Source: Jesse Peralta via X
These kinds of clusters tend to act like a magnet, and once price enters these zones, volatility usually follows. As noted by crypto analyst Jesse Peralta, Solana’s push into this range may trigger further liquidations before momentum continues. It also ties back to the recent bullish pennant breakout, with price still eyeing the $212 target as outlined in earlier Solana price prediction.
While many altcoins have shown immense weakness over the last several months, Solana has quietly maintained its weekly bullish trend for six straight months, a rare show of strength. Crypto analyst Nebraskangooner’s chart underlines how SOL has kept buyers in control even as other names struggled.
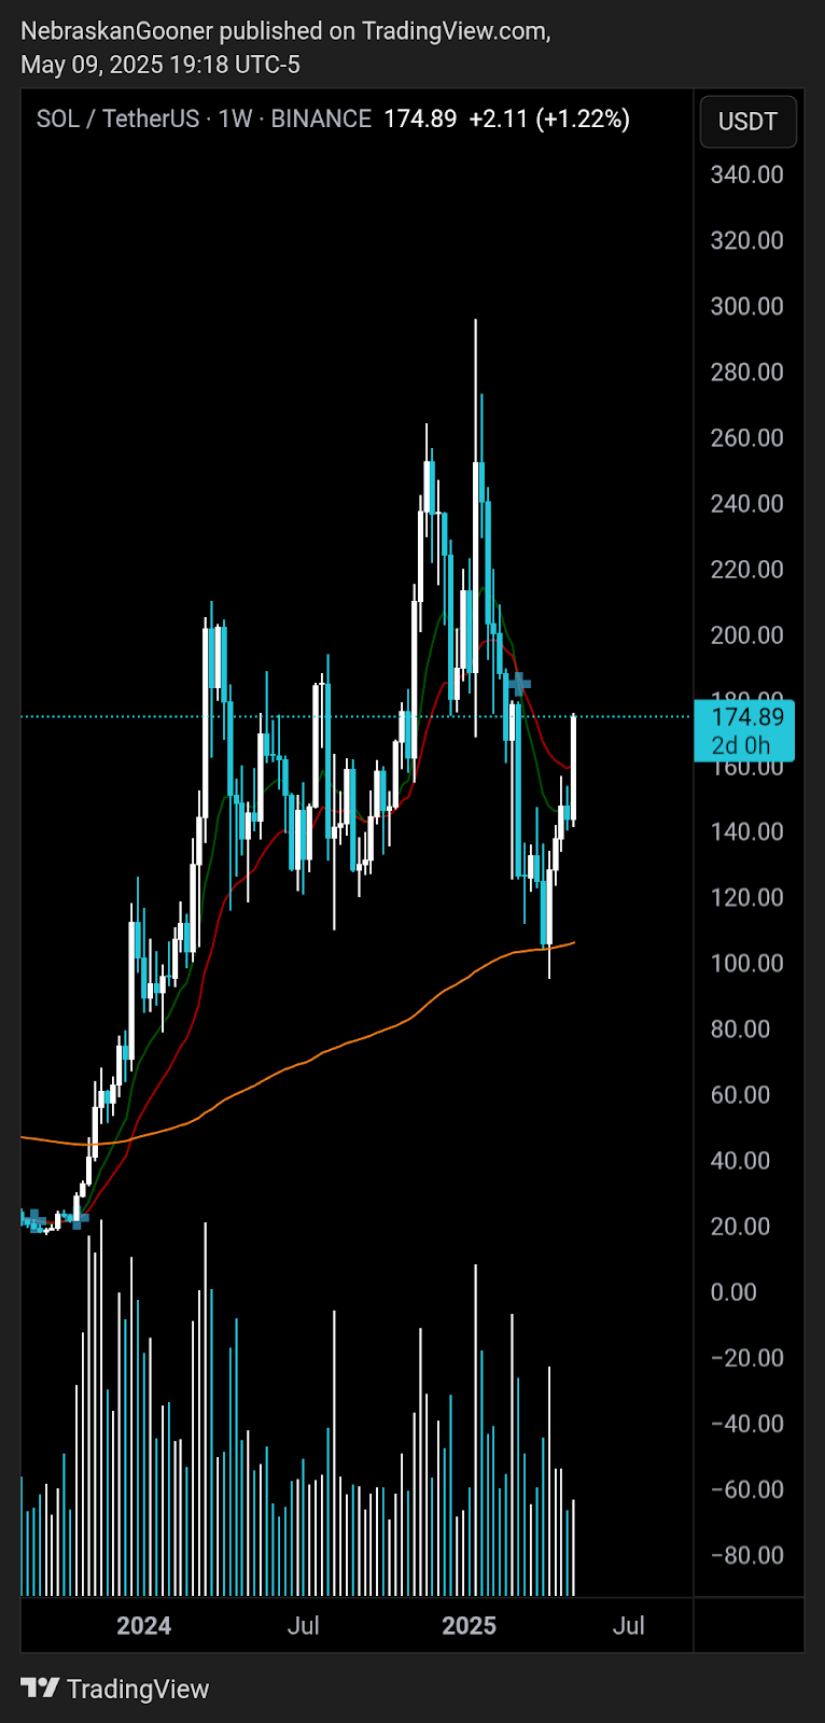
Solana maintains a strong weekly bullish trend for six months, showing resilience even amid broader market weakness. Source: Nebraskangooner via X
What makes this interesting is the way SOL keeps bouncing back at key levels like $175. It’s not just about big moves; it’s about how the price behaves over time. If this strength keeps up, we might see continuation setups emerge, and that’s something the Solana community could be looking into.
With strong global liquidity trends, bullish chart patterns, and solid weekly strength, Solana is showing it’s not just a short-term player. Even as liquidations create near-term noise, the bigger picture points to resilience and potential.
If Solana can keep holding above key levels like $175, it may have the fuel to aim for higher targets like $212 in the coming weeks. While nothing is guaranteed, the mix of technical setups and macro tailwinds makes SOL one of the more interesting names to watch right now.
Dogecoin price predictions are barking back into the spotlight with renewed energy, and crypto watchers are buzzing: could DOGE finally hit the legendary $1 mark within the next 60 days? Backed by bullish technical patterns and influential support, the meme coin seems poised for a major breakout.
But while DOGE aims for the moon, Remittix (RTX), a rising crypto gem, is currently priced at just $0.0757. With a real-world use case in cross-border payments and growing investor interest, RTX might just be the next big crypto to follow the Dogecoin frenzy. Here’s what to watch next.
Dogecoin (DOGE), the original meme coin, is once again capturing the spotlight with bullish momentum. Recent technical indicators, such as the formation of a golden cross, suggest strengthening upward trends. Analysts have made bullish Dogecoin price predictions, suggesting that DOGE could reach the long-anticipated $1 mark in early 2025, driven by increased trading volumes and renewed investor interest.
However, some forecasts are more conservative. For instance, some Dogecoin price predictions project a modest increase, estimating DOGE to reach approximately $0.224 from its current $0.223 in the next 30 days.
Similarly, other Dogecoin price predictions anticipate a trading range between $0.1217 and $0.2093 throughout 2025.

Despite these varying predictions, the Dogecoin community remains optimistic. Influential people like Elon Musk drive this zeal even more; their ongoing backing has traditionally affected Dogecoin price predictions.
Although estimates differ, the mix of technical indications, community support, and powerful endorsements points to a likelihood for Dogecoin’s path towards the $1 goal in the near future.
As Dogecoin price predictions point to Dogecoin potentially reaching the $1 mark within the next 60 days, a lesser-known yet powerful contender, Remittix, is quietly revolutionizing cross-border payments. As an Ethereum-powered decentralized application (dApp), Remittix is crafting a seamless bridge between cryptocurrency and traditional fiat payment networks, allowing everyday users to send and receive global transactions using digital assets.
Through a simple wallet connection, users can access over 30 fiat currencies and more than 50 crypto trading pairs on the Remittix platform. By integrating blockchain technology with conventional payment infrastructures, Remittix removes the need for expensive third-party processors, effectively reducing transaction fees and eliminating multi-day processing delays.
Instead of enduring the standard 2–5 business day wait, users enjoy almost immediate transfers with a consistent, low-cost fee structure. Impressively, recipients experience transactions as standard fiat deposits, unaware that crypto was involved in the background.
With the global remittance market valued at over $750 billion, experts suggest that even a modest market penetration could catapult RTX’s valuation into the billion-dollar territory, positioning it alongside the top-tier cryptocurrencies currently leading the digital finance space.
Experts are bullish on RTX, hailing it as the hidden low-cap treasure ideal for investors chasing high yields. With its groundbreaking PayFi technology and massive market scope, many believe Remittix could even outshine Dogecoin price predictions in the long run.
Astute buyers are already snapping up RTX tokens rapidly, propelling the Remittix presale close to $15 million. Priced at just $0.0757, these tokens are flying off the shelves, yet a price hike to $0.0781 is imminent as the next presale stage approaches. The clock is ticking for those eyeing early entry.
Discover the exciting opportunities of the Remittix (RTX) presale today!
Website: https://remittix.io/
Socials: https://linktr.ee/remittix
Ethereum looks to end its downtrend that has been in play since mid-December after it turned away from its 10-month high of $4,100. Industrial experts are pointing to its recent Pectra upgrade as a major catalyst for the surge, as they spot a similar footprint for Cardano and PayFi sensation Remittix.
While the Cardano price action has formed a bullish breakout structure, the Remittix ICO launch has reached nearly $15 million, with investors buying $532 million tokens. Today, we review Ethereum’s momentum alongside the latest Cardano price prediction and Remittix’s impressive presale numbers.
Source: Remittix
With the crypto market entering a bullish cycle in Q2, Remittix bulls are emerging to catapult RTX from its current price point at $0.0757 to $1. Notably, large accumulation has been happening behind the scenes as investors contribute nearly $15 million, showing strong confidence in the project.
After all, Remittix’s innovation is fuelled by a blockchain-based PayFi solution that presents a payment solution addressing setbacks in cross-border remittances. With Remittix, users can convert more than 40 cryptocurrencies into fiat currencies without foreign exchange charges, delivering a seamless, low-cost solution in a sector plagued with delays.
Remittix’s finance tech extends beyond crypto-to-fiat settlements. The project is building an API for enterprises to integrate their payment protocol for Web2 and crypto-native users alike. This feature is indispensable to companies and local agencies since it allows them to receive crypto payments and convert them to fiat currencies.
Considering Remittix’s native token offer and impressive 8% staking yield, while maintaining its deflationary nature, market experts believe the $1 price target is just the beginning. And with global adoption and major exchange listings coming up, RTX is on track to achieve a top 10 crypto ranking, challenging Cardano and Ethereum.
Cardano’s price action has shifted significantly after BitcoinOS demoed the first bridgeless transfer of Bitcoin between Bitcoin and Cardano. With its latest 20% surge in May, the Cardano price is still down 12.3% from its March peak and 50% lower than its 2024 high.
 and Cardano (ADA) Prices Next After Ethereum Skyrockets 30% 3")
Source: CoinMarketCap
The Cardano price risk model suggests that the bull market for ADA has not yet begun, despite early-stage bullish trend reversal signs. According to an evaluation by Crypto Capital Venture founder Dan Gambardello, Cardano’s Long-Term Risk Score currently stands at 37, categorized as a “Moderate Buy.”
Furthermore, compared with Ethereum, which has a lower Long Term Risk Score of 24, Gambardello sees ADA as better positioned structurally. In the near term, Ali Martinez’s analysis points to a structural break above the $0.8, as it clears the upper boundary resistance of a falling channel.
One of the standout ramifications of the Pectra upgrade is that $ETH is deflationary again, meaning that more of the supply is being burned than new coins are being created. Within a day after the upgrade, the Ethereum price surged by more than 30%, as ETH approached the $2,411 psychological level.
Analyst Cas Abbé called the upgrade “really successful” and suggests the deflationary effect could propel the $ETH price to $3,000 before 2025 ends.
 and Cardano (ADA) Prices Next After Ethereum Skyrockets 30% 4")
Source: Bob Lukas on X
Structurally, Bob Lukas noticed that Ethereum has broken out above a descending trendline resistance level, which could set the tone for a price push above $2,500.
If Ethereum surges towards the $3K and infuses fresh mainstream momentum into its network, Remittix can be a monstrous beneficiary, catapulting the RTX price towards the $1 target. As an early-stage company with its tiny market cap, a progression from $0.0757 to $1.00 or even $3.00 would be 13x to 50x growth. Choose wisely!
Discover the future of PayFi with Remittix by checking out their presale here:
Website: https://remittix.io/
Socials: https://linktr.ee/remittix