The main tag of cryptocurrency price today Articles.
You can use the search box below to find what you need.
[wd_asp id=1]
The main tag of cryptocurrency price today Articles.
You can use the search box below to find what you need.
[wd_asp id=1]
The popular alternative cryptocurrency Solana (SOL) has been clinging to $125 support for weeks, refusing to move but refusing to break — until it finally did. Price dropped below the range it had been sitting on since late 2023, lost the crucial zone and looked ready for a big breakdown.
But then came the bounce with a full reversal, green weekly close, and now we are back above that same support like nothing happened.
Technically? It’s a “fakeout” for now. Price dipped, wiped out longs and jumped right back. SOL ended the week up 7.81%, and the whole thing looked more like a bear trap than an actual move.
On paper, this doesn’t look bad — assuming the macro backdrop doesn’t get worse. Which, of course, is a big assumption right now.
Even expert trader “DonAlt,” who is not exactly known for being a Solana fan, flagged the move. He pointed out the range was finally cleared to the downside and called the bounce a false breakdown — and despite not liking the project, admitted it doesn’t look too bad right now.
Zooming out, nothing has changed above. The $190-$200 zone is still untouched, still heavy, and a problem. That whole area is where things fell apart the last time, and getting back up there would take a major shift — not just in SOL, but in the whole crypto market.
Related

The question now is simple: Was that bounce the start of a recovery, or just another failed “fakeout” in a tired market? One thing’s for sure — Solana is not dead yet. But if this bounce fades, it might be back on life support sooner than expected.
Polygon (MATIC) is gaining momentum with key partnerships and bullish technical indicators, signaling potential growth. Market sentiment remains optimistic, with predictions for a promising future.
As of April 20, 2025, Polygon (MATIC) is trading at approximately $0.19, reflecting a modest uptick in recent days. Technical analysis reveals a bullish engulfing pattern on the weekly chart, indicating potential upward momentum and suggesting that buyers may be gaining control.
Polygon (MATIC) continues to assert its dominance in the blockchain world through a series of impactful collaborations and technological upgrades. The platform has positioned itself as a leader in Ethereum scaling solutions by forming high-profile partnerships with global corporations. Among the most notable are Mastercard, Instagram (Meta), Stripe, Adidas, and Disney—brands that carry immense weight in both the traditional and digital economies.
Mastercard has worked with Polygon on NFT-based payment solutions, while Instagram has integrated Polygon’s blockchain to support digital collectibles. Stripe has leveraged Polygon’s infrastructure to enable seamless crypto payouts. Adidas has also explored metaverse activations and NFTs using Polygon’s layer-2 technology. Disney, notably, selected Polygon for its prestigious accelerator program, focusing on next-gen storytelling using Web3 tools.
These collaborations are more than just symbolic; they showcase how major institutions are betting on Polygon’s low-fee, high-speed, and carbon-neutral architecture. With continuous upgrades like zkEVM and growing DeFi, NFT, and gaming adoption, Polygon is laying a robust foundation for mass Web3 adoption and long-term relevance in the crypto ecosystem.
As of April 20, 2025, technical analysis on Polygon (MATIC) shows growing bullish sentiment. The most recent indicator is the recent bullish engulfing pattern on the weekly chart of MATIC. Engulfing candlestick patterns usually indicate a complete trend reversal of the previous bearish period. This suggests that buyers are starting to take control from sellers. And when they do, they often push prices upwards. Typically, bullish engulfing patterns have been precursors to price rallies, especially when there has been increasing volume and other technical confirmations to back it up.
Traders and analysts have their eyes on this price action because it lines up with a transition to bullish sentiment. The market sentiment would best be described as “cautiously optimistic.” MATIC has spent the last several months struggling and falling below several key resistance levels. However, the extra momentum and better fundamentals are now prompting retail and institutional investors to think ahead.
Analysts have provided varied price forecasts for MATIC in the coming years:
These projections are contingent upon continued network growth, adoption, and favorable market conditions.
Polygon’s recent price movements and technical indicators suggest the potential for a significant breakout. Coupled with strategic partnerships and ongoing developments, MATIC is positioning itself as a noteworthy asset in the cryptocurrency market. Investors are advised to conduct thorough research and consider market dynamics before making investment decisions.
Renowned
author Robert Kiyosaki forecasts Bitcoin (BTC) price could skyrocket to $1
million by 2035, driven by an ongoing economic crash and surging U.S. debt. As
of today (Saturday), 19 April, 2025, Bitcoin’s price is up 1%, trading above $85,000
, according to CoinMarketCap. Despite macroeconomic fears, ETF inflows and
bullish sentiment are pushing BTC higher.
In this
article, we dive into Kiyosaki’s bold prediction, explore the forces driving
Bitcoin’s 2025 rally, and answer the critical question: Why is Bitcoin going up
today and high how BTC price can go in the long run?
As of April
19, 2025, Bitcoin (BTC) is priced at approximately $85,419 , a 1% increase compared
to the previous close and 0,9% over the past 24 hours. The total market
capitalization currently stands at nearly $1.7 trillion, with a daily trading
volume of $12.4 billion.
Bitcoin price today. Source: CoinMarketCap
However,
Robert Kiyosaki, co-author of Rich Dad Poor Dad, believes Bitcoin’s
potential is far greater, projecting a staggering $1 million valuation by 2035.
In a tweet
posted on April 19, 2025, Kiyosaki warned of a “Greater Depression” fueled by
record-high U.S. debt, rising unemployment, and collapsing 401(k)s. He
reiterated advice from his books, including Rich Dad Poor Dad and Rich
Dad’s Prophecy, urging investors to buy Bitcoin, gold, and silver to
weather the crisis.
“I strongly
believe, by 2035, that one Bitcoin will be over $1 million dollars,” Kiyosaki
tweeted, citing the current economic crash as a historic wealth-building
opportunity.
MAKES ME SAD: In 2025 credit card debt is at all time highs. US debt is at all time highs. Unemployment is rising. 401 k’s are losing. Pensions are being stolen. USA may be heading for a GREATER DEPRESSION.
I get sad because as I stated in an earlier X….Tweet….I warned…
— Robert Kiyosaki (@theRealKiyosaki) April 18, 2025
Here’s
why his prediction is resonating:
Bitcoin’s
current uptrend isn’t just speculative. Several factors are fueling its
momentum:
“In my
assessment, Bitcoin crossing the $84,000 threshold was not just a reaction to
Trump’s pressure on Powell; it’s the culmination of months of rising
uncertainty in traditional markets,” commented Rania Gule, Senior Market Analyst at XS.com. “High
interest rates, industrial slowdown, trade tensions, and geopolitical conflicts
are all pushing capital toward havens detached from government influence. Here,
Bitcoin emerges not as a speculative asset, as it was previously labelled, but
as a serious hedge in the eyes of major institutions.”
You may
also like: Will
Bitcoin Reach $100K Again? Latest BTC Price Prediction for 2025 Says Yes
Bitcoin’s
price action shows a consolidation phase since March 2025, trading between
$87,400 resistance and $78,000 support. The 50-day and 200-day exponential
moving averages (EMAs) have converged near current price leveles, signaling a
potential breakout.
My
technical analysis indicates that BTC/USD is currently testing the 50 and 200
EMA levels. If the pair manages to break above them decisively—something that
hasn’t happened in many months—it could generate a strong signal for potential
upward movement.
Bitcoin price technical analysis. Source: TradingView
“Bitcoin’s
implied volatility is trending below 50 which is a historically low level and
price is at the low end of the channel established since November,” said Paul
Howard, Director at Wincent. “Given the turmoil in the macro markets, the last
month hasn’t brought BTC price down below 74k (pre November 2024 levels), and
the regulatory environment is a lot friendlier. It would seem likely we see
price appreciation rather than a gap lower.”
“There
needs to be a catalyst however and that might not come for several months and
in my view will be driven from further policy changes in the US notably regards
to taxation, payments and regulations (specifically on stablecoins).”
Bullish
Case: A break above
$86,000 could target:
Bearish
Case: A drop below
$78,000 could test:
Support and Resistance Levels:
|
Support Levels |
Description |
Resistance Levels |
Description |
|
$78,000 |
Lower |
$87,400 |
Upper |
|
$74,500 |
April 2025 lows |
$90,000–$92,000 |
Resistance from late 2024 lows |
|
$68,000 |
July 2024 highs |
$100,000 |
Psychological barrier |
|
$66,000 |
October 2024 lows |
$108,000 |
December 2024 all-time high |
Kiyosaki’s
$1 million by 2035 is ambitious, but other analysts offer nearer-term
forecasts:
|
Source |
2025 Price Prediction |
Key Drivers |
|
Robert Kiyosaki |
$1M (by 2035) |
Economic |
|
Kathie Wood |
$1M (by 2030) |
|
|
Bernstein |
$150,000 |
ETF inflows, halving effects |
|
Bitfinex |
$145,000–$180,000 |
Historical cycles, liquidity correlation |
|
Standard Chartered |
$200,000 |
Institutional |
Others
also liked: How
High Can Bitcoin Go? This Expert Predicts BTC Price Jump to $137,000
Kiyosaki’s
$1 million call assumes a prolonged crisis, but risks could derail Bitcoin’s
ascent:
Moreover, Dr.
Kirill Kretov, Senior Automation Expert at CoinPanel, offers a more cautious
outlook. In a recent statement, Kretov warns that the bullish narrative may
overlook critical macroeconomic and market dynamics, casting doubt on a clean
breakout to six-figure prices in 2025.
“We are in
a phase of deep macro uncertainty marked by geopolitical tension, fragile
global markets, and a strong risk-off sentiment,” Kretov explains. He argues
that Bitcoin is behaving more like a speculative asset than the “digital gold”
Kiyosaki champions. In this climate, traditional safe-haven assets like gold
are regaining prominence, potentially siphoning demand from BTC.
Kretov’s
analysis delves deeper into market mechanics. He points to “orchestrated”
patterns: fear-driven sell-offs followed by quiet accumulation by
well-capitalized players. On-chain data reinforces this view, showing a surge
in large Bitcoin outflows (100+ BTC) from exchange wallets since November 2024,
indicating strategic accumulation by whales.
Source: CoinPanel.com
Meanwhile,
smaller transactions (<10 BTC) remain stagnant, reflecting retail investors’
hesitation. “This divergence highlights a market dominated by consolidation at
the top, while smaller participants sit idle,” Kretov notes.
Volatility,
thin liquidity, and weak retail sentiment further complicate the outlook.
Kretov suggests that modest price moves can trigger exaggerated swings, making
Bitcoin vulnerable to manipulation. “A collapse to $10,000 is improbable
without a systemic crisis, but a breakout to $150,000 seems unlikely without
first purging speculative excess,” he says. Instead of a hype-driven rally,
Kretov predicts the next bull run may follow a deep correction that clears out
“dead weight” from retail speculators.
Analysts
project $145,000–$200,000 by Q4 2025, driven by ETFs and liquidity. Kiyosaki’s
$1 million by 2035 assumes a decade-long crisis but aligns with BTC’s
historical 50%–600% post-halving gains.
Dips near
$80,000–$82,000 offer better entry points, given historical rebounds. Kiyosaki
urges action: “Those who wait in fear may be the biggest losers.”
By year-end
2025, forecasts range from $145,000 (Bitfinex) to $200,000 (Standard
Chartered), with Bernstein citing $150,000 as achievable. Liquidity surges
($6.5 trillion projected) and ETF flows ($70 billion expected) are key drivers.
However, tariff risks or a debt ceiling resolution could cap gains, making
$120,000–$150,000 a realistic target.
Predicting
2030 is challenging, but assuming continued adoption and liquidity trends,
Bitcoin could range from $300,000 to $500,000. This accounts for historical
cycle growth (e.g., 600% post-2020 halving), institutional uptake, and
potential U.S. BTC reserves. Kiyosaki’s $1 million by 2035 implies a 2030 price
of $400,000–$600,000 if growth accelerates during economic turmoil.
Geopolitical risks or regulatory shifts could lower this to $200,000.
A $10
million Bitcoin price is highly unlikely, even by 2035. Kiyosaki’s $1 million
forecast assumes a “Greater Depression” and massive fiat devaluation, but $10
million would require unprecedented hyperinflation or global adoption far
beyond current trends. For perspective, $10 million per BTC implies a $200
trillion market cap—over twice the current U.S. GDP. While bullish, this
exceeds realistic scenarios.
By April
2030, Bitcoin could realistically trade between $250,000 and $500,000, driven
by post-2028 halving dynamics, ETF growth, and corporate adoption. Lyn Alden’s
liquidity correlation suggests BTC could benefit from $7 trillion+ in global
liquidity by 2030. Kiyosaki’s $1 million by 2035 implies a 2030 price closer to
$400,000, but macro risks like trade wars could limit it to $200,000.
Dogecoin (DOGE) price has shown a new upswing after finding support at the $0.154 level. Despite the overall bearish trend in the crypto market, DOGE price demonstrated signs of a possible further increase. Analysts focused on a triangle bottom pattern and a bullish phase. These formations implied a bullish pattern and $0.180 as the probable resistance level.
Dogecoin price rebounded after testing the $0.154 support, signaling a potential trend reversal. At the time of writing, Dogecoin price traded at $0.160, up from the recent low of $0.154. According to technical analyst Trader Tardigrade, the price structure formed a triangle bottom over three weeks, marked by lower highs and higher lows.
According to Tardigrade’s analysis, the top meme coin price has successfully crossed above the upper trendline of $0.158. The breakout or overshoot candle highlighted the backside, indicating revived buyer interest in the price. He identified $0.180 as the upcoming key resistance level. To confirm the breakout and continue with the upward movement, DOGE price has to remain above the triangle resistance line.
Interestingly, the triangle bottom has historically acted as a bullish reversal signal, particularly when confirmed with volume. Tardigrade’s chart showed rising volume at the point of breakout, indicating that momentum may favor bulls in the short term.
Moreover, another popular analyst, BitGuru, also provided an alternate view on DOGE’s latest action. After a bearish trend in the market, the DOGE price was range-bound at $0.1549, which attracted the buyers’ interest. As BitGuru pointed out, this support level corresponds to the horizontal line of the Tardigrade’s triangle.

The BitGuru’s chart pointed to the changing of the bearish lower lows cycle and the possible bullish higher lows cycle, indicating a relief rally was imminent. These were based on accumulation at $0.1549 and noted that there was constructive pressure at the position after a bounce.
The bullish performance of DOGE at this level further reinforces the previously identified support level of $0.1549. More so, BitGuru backed a recovery trajectory so long as the top meme coin remains firm above the recent support level and breaks through the upcoming resistance levels.
BitGuru also noted $0.16661 as one of the key resistance levels. This level has functioned as resistance since the end of March and has capped several rallies. Any break above $0.16661 would confirm this new market structure and open the path for DOGE price to rise to $0.18028.
According to BitGuru, the $0.18028 level coincided with previous local highs and a minor supply zone where sellers may re-enter. Therefore, reclaiming this zone would shift toward a more robust rehabilitation phase. However, any push through this resistance will depend on volume and spot exchange activity.
Notably, the triangle breakout established by Tardigrade occurred at a similar level to the BitGuru resistance range of $0.165 – $0.167. This convergence supports the technical biases for a clean break-out point around this range strongly. A capitulation that flips this zone into support would strengthen the bullish breakout argument.
Despite the bullish triangle breakout, Doge price remains below its 50-day moving average near $0.170. A daily close above this level would further confirm the shift in market momentum.
Meanwhile, the daily Relative Strength Index (RSI) remains flat around the neutral 50 level. This positioning signals that the market is not yet overbought or oversold, leaving room for movement in either direction depending on trading volume and sentiment.
At the time of writing, DOGE traded at $0.1579, posting a modest 0.52% daily gain. The bounce from $0.1549 and ongoing consolidation just below $0.166 reinforces the view that Dogecoin could be setting up for another leg upward—should it clear key resistance levels.
This article is for informational purposes only. Crypto investment involves inherent risks due to the volatility in price. Readers should conduct their research before making any investment decision. Also, you can consult a crypto expert before investing in cryptocurrencies.

The cryptocurrency market has concluded another week on a bearish note. With this, the top tokens continue to stumble around their important support levels. With a 24-hour trading volume of $43.61 billion, the cryptocurrency industry is currently worth $2.69 trillion. While the fear and greed index displays 32/100, the altcoin season still records 18/100, highlighting a delayed altcoin season.
Notably, the Bitcoin price is back above the $85,000 mark, but continues to struggle around the price range. This hints at increased price volatility in the crypto market.
On the other hand, the altcoin market is the worst affected as the top tokens constantly fail to break above their crucial levels. This brings marketers under a FUD-like situation with endless questions.
In this article, we will understand the market and technical sentiment of the top 3 cryptocurrencies, along with their potential weekly price predictions.
Bitcoin price today has successfully maintained its value above the $85,000 mark. With an intraday trading volume of $14.208 billion and a market capitalization of $1.68 trillion, the dominance of this crypto token is beyond 63% for about 10 days now. Despite rising uncertainty, the Bitcoin community speculates a strong bullish reversal during this quarter.
The Moving Average Convergence Divergence (MACD) shows a constant rise in the green histogram, with its averages displaying a similar action in the daily time frame. This suggests a positive outlook for the largest crypto token during the upcoming week.
A sustained bullish price action could push the price of Bitcoin toward its upper target price of $90,000 within the next seven days. However, increased liquidation could pull the Bitcoin price toward its pivotal support trendline of $78,500.
The ETH price continues hovering around the $1,600 mark with an intraday trading volume of $6.89 billion. However, with a YTD correction of 51.63%, the dominance of the largest altcoin by market cap has dropped to 7.17%. This has created huge concern among the community about the future of smart contracts.
The Simple Moving Average (SMA) strongly supports the Ethereum price action in the daily time frame. This suggests an increase in the buying-over-selling pressure for the altcoin in the cryptocurrency space. Moreover, the technical indicator, MACD, witnesses a similar price action, indicating a bullish outlook.
If the cryptocurrency market favors the bulls, in that case, the Ethereum coin price could head toward its immediate resistance level of $1,800. Sustained positive action could push the price of this altcoin toward its upper high of $2000. Conversely, a negative influence could pull the value toward its crucial low of $1,500.
The XRP price today continues to display stable price action. With this, altcoin has concluded the week with neutral price action. Considering the long-term price action, it has plunged by over 14% over the last 30 days. Moreover, with a market cap of $120.78 billion, it is currently trading at a discount of about 46% from its ATH.
The technical indicators SMA & MACD have both displayed positive action over the past week. This hints at a rising bullish sentiment for the 2nd largest altcoin, suggesting that the price may retest its crucial levels.
Maintaining the price above its support level of $2 could prepare the altcoin to head toward its important resistance level of $2.50. On the flip side, a negative turnaround could result in it plunging toward its lower support of $1.75.
Also Read: XRP Price Set for July Surge; Historical Data Backs It
If you’ve been following along with our XRP updates lately, you’ll know we’ve been waiting for something… something real to happen.
But truth is, not much has changed since our last article — and if you haven’t read that yet, I highly suggest you check it out. It sets the stage for what we’re looking at today.
Right now, XRP is doing what it does best during quiet times — accumulating. And if you’ve been in the crypto space for more than a minute, you know what this usually means: something is brewing under the surface.
As it stands, price action has been sluggish. It’s like XRP is taking a deep breath before deciding whether to dive or fly.
Now, here’s the part many traders miss: most impulsive moves, especially in XRP, tend to happen during high-volume sessions, like the London or New York open. So if you’re staring at the chart all day right now, don’t get frustrated — just recognize the setup.
In our previous XRP analysis, we pointed out the zones we were waiting for price to tap. Those areas are still in play. Price hasn’t deviated much, which only reinforces the idea that we’re in a waiting game.

The question now is: what happens once the liquidity under the current price is taken?
Well, here’s where it gets a little tricky.
Once the liquidity below is grabbed, we could see one of two things:
Honestly? Both scenarios are possible. And here’s the raw truth: there’s no certainty in crypto.
I remember a time when I was convinced a move was about to take off — the setup was textbook. But instead, it faked out and reversed. It reminded me that this game is as much about patience and probability as it is about precision.
This isn’t a crystal ball moment. It’s not about saying “XRP is going to $1 tomorrow.” It’s about understanding context and reacting to what price actually does — not what we hope it does.
That’s what makes a real trader.
So here’s the realistic xrp price prediction: Watch how price behaves after the liquidity below is taken. If we see a clean reaction and a structural shift, then we might have something to work with. Until then, it’s all about sitting on your hands, staying sharp, and waiting for the right moment to strike.
In this market, the only thing we can count on is uncertainty. The scenarios I’ve laid out today are possibilities — not guarantees. And that’s okay.
Because trading isn’t about being right all the time. It’s about being prepared.
If XRP does break structure, the game changes. If it doesn’t, we wait. Either way, don’t rush. The market will give you the setup if you’re patient enough to wait for it.
Until then, stay tuned to Bitcoinsensus for clear, no-fluff updates on what’s really happening in the world of crypto.
Edoardo Farina, a prominent XRP advocate and founder of Alpha Lions Academy, has made new bold claims about XRP’s long-term potential.
In a tweet, Farina stated that a $1,000 investment in XRP today could be worth more than $50,000. He noted that with XRP currently trading at $2, investors have a unique opportunity to secure a 50x return if XRP reaches his long-term target of $100 or more.
Farina, known for his vocal support of XRP and long-term mindset, has previously declared that he will not sell any of his XRP holdings for less than $100 per token. He describes XRP as being at the center of a “multi-generational pump,” emphasizing the digital asset’s role in the evolving global financial system.
He also encourages retail investors to consider holding at least 1,000 XRP, calling it the minimum threshold to benefit from XRP’s future utility and adoption. Farina has even boldly asserted that those holding fewer than 1,000 XRP tokens do not care enough about their financial success. He has described holding below this threshold as “insanity.”
While Farina’s views are aspirational and reflect his personal investment strategy, they underscore a growing sentiment among XRP supporters. They believe the asset is undervalued and poised for significant growth, especially if regulatory clarity improves and adoption accelerates.
Meanwhile, his bold views also face resistance from critics who find weaknesses in his ambitious outlook for XRP. For instance, his recent statement that buying $1,000 worth of XRP now is equivalent to buying over $50,000 in the future, assuming XRP reaches $100, has sparked mixed reactions.
One commenter, Eloise, noted that by this logic, if someone spends $1,000 on XRP now and earns $50,000 in the future, it may still not be enough to retire early.
Her comment highlights that while the projection appears promising on the surface, $50,000 may not be the life-changing fortune many are hoping for from a long-term investment. Furthermore, whether XRP will ever reach $100 per token—and how long it might take to get there—remains uncertain.
Many crypto analysts have speculated about the possibility of XRP reaching the $100 mark by the end of this bull cycle. However, with XRP trading around $2 and showing little progress over the past three months, the road to $100 remains distant. It would require a 4,900% surge from its current price.
On the other hand, the popular forecast website Telegaon suggests it could take XRP 15 years to hit $100. Meanwhile, analysts at Changelly predict it could take at least nine years.
Critics like Davinci Jeremie warn against holding XRP for such an extended period. They argue that XRP’s potential may lie more in short-term opportunities rather than as a long-term hold.
DisClamier: This content is informational and should not be considered financial advice. The views expressed in this article may include the author’s personal opinions and do not reflect The Crypto Basic opinion. Readers are encouraged to do thorough research before making any investment decisions. The Crypto Basic is not responsible for any financial losses.
Cardano price shows signs of strength, with triangle patterns and global liquidity pointing to a potential breakout toward $1.50.
after a slow and steady stretch, the ADA Cardano price might be setting the stage for something bigger. The price has been sitting in a tight range, just below key resistance zones that many traders are watching. With the recent increase in global liquidity and ADA tracking closely behind it, a move is around the corner.
Cardano (ADA) was trading at around $0.61, up 0.36% in the last 24 hours. Source: Brave New Coin
Technicals are starting to align. From long-term double bottom patterns to shorter-term triangle formations, ADA is building a positive case.
M2 global liquidity is back in the spotlight, and historically, that’s been a big deal for risk assets like Bitcoin. Every time the money supply starts expanding again, it tends to trickle into markets that thrive on liquidity. While Bitcoin often grabs the early headlines, the real story this time might be unfolding with ADA.

Global liquidity trends align with ADA’s potential move, signaling a shift in market dynamics. Source: m2globalmoney via X
In this chart from m2globalmoney, Cardano is shown tracking M2 trends with remarkable alignment. As global liquidity ramps up, the setup suggests ADA could be quietly positioning for a move. When global liquidity picks up and ADA starts reacting, it’s usually not by chance. It often hints that the broader market is shifting gears.
While global liquidity may be hinting at a macro shift for ADA, zooming into shorter timeframes reveals something just as compelling. According to TradingView data shared by Cardanians, Cardano’s ADA has outperformed tech giants like Tesla, Nvidia, and Meta over the last 180 days. It’s not just a crypto narrative anymore, ADA is starting to look like a broader market outperformer. In a space often dominated by hype, this kind of quiet, data-backed performance stands out.
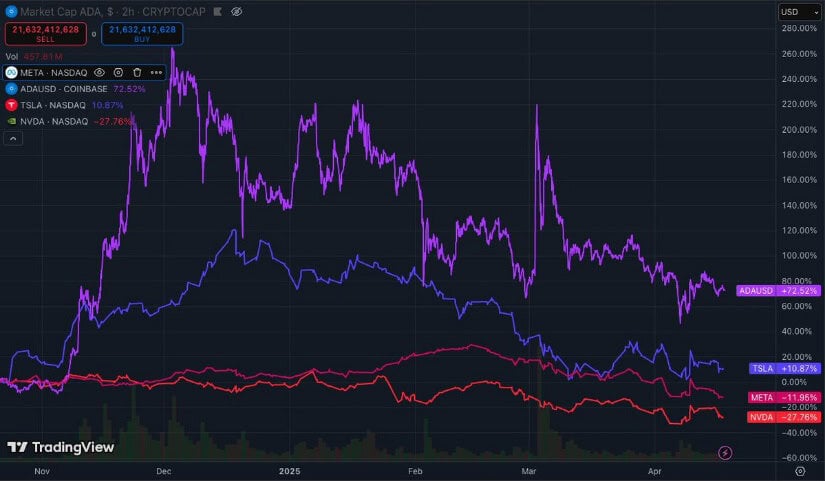
Cardano’s ADA outpaces major tech stocks, showcasing its strength with over 70% gains in the past 180 days. Source: Cardanians via X
The chart shows ADA delivering over 70% gains. This kind of relative strength during mixed market conditions sheds a positive light on Cardano’s growing dynamics.
After outperforming major tech names, Cardano’s chart is now flashing a pattern that could hint at a deeper shift in sentiment. A double bottom pattern is a classic reversal setup. Additionally, the pattern is emerging on ADA’s long-term timeframe. According to crypto analyst InvestingHaven, April 14 marks a crucial decision point, with price action in the following weeks likely to confirm or reject the pattern.
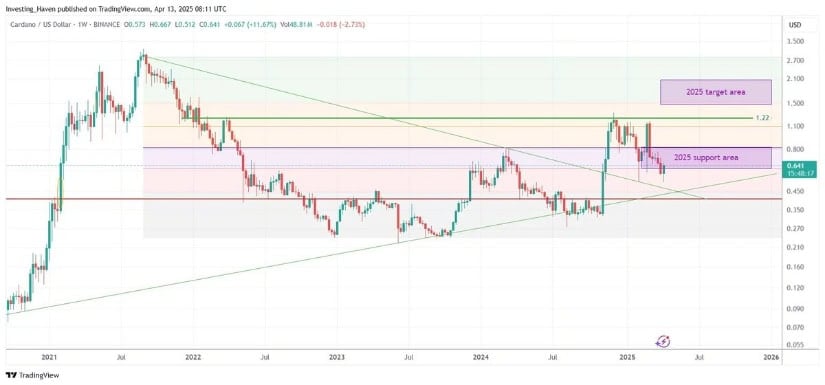
Cardano’s ADA eyes a breakout from $0.64 to potentially $1.50 as double bottom pattern suggests a shift in momentum. Source: InvestingHaven via X
Right now, ADA is holding near $0.64, sitting right inside its 2025 support zone. The key level to watch is $0.80. A close above it could open the path toward $1.22, and from there, a potential push into the $1.50 range isn’t off the table. The chart has laid out the structure clearly, but now it’s about momentum showing up to back the move. InvestingHaven points out, this setup may be hinting at more upside than most think.
Zooming into ADA’s recent price action, a symmetrical triangle pattern has formed, signaling a potential breakout setup. Shared by famous crypto chartist Ali Martinez, the chart shows ADA compressing between converging trendlines, often a precursor to sharp directional moves. The structure implies a possible 30% swing, with the technicals lining up for a strong follow-through, especially if global liquidity and investor sentiment continue to lean positive. If ADA breaks above the triangle’s upper boundary with solid volume, it could act as the next bullish trigger, adding weight to the broader Cardano Price recovery thesis.
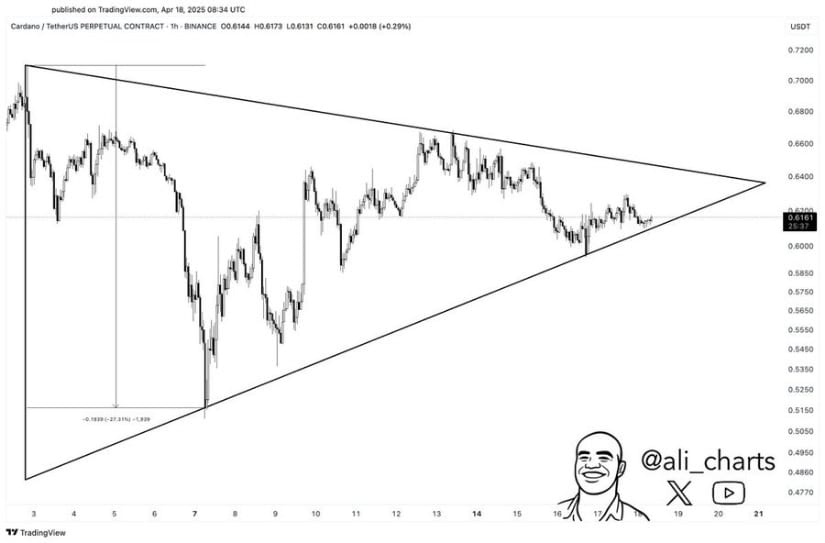
Cardano is trading within a symmetrical triangle, with a breakout setup hinting at a major move. Source: Ali Martinez via X
Still, while the pattern looks constructive, traders shouldn’t ignore the downside risks. If support around $0.56 gives way, the breakout setup flips bearish, opening the door to a retest of lower zones. For now, all eyes are on volume and confirmation. A breakout is coming, but the clear direction remains undecided.
The Cardano price dropped by 3.4% this week, but it still made it into Grayscale’s top 10 crypto assets by weekly returns. That’s pretty solid, considering many other big names like Ethereum and Dogecoin did worse. Crypto analyst Crispy points out that even in a down week, ADA is showing relative strength, holding its ground better than most.
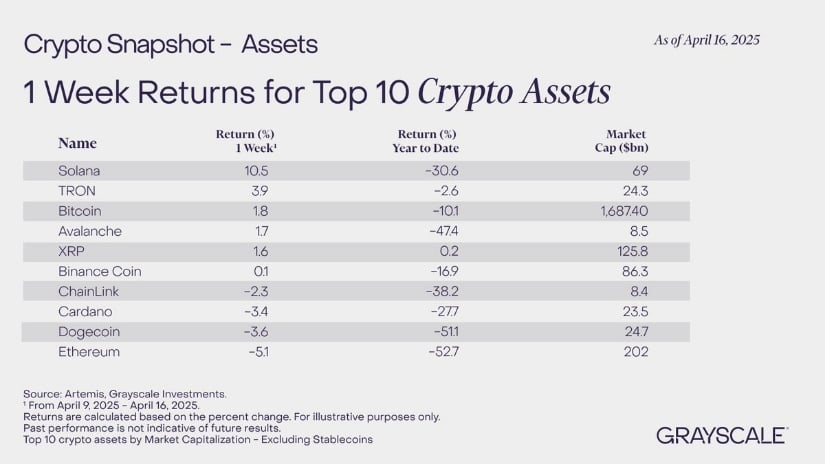
ADA shows resilience with a modest weekly drop, still outperforming major altcoins. Source: Crispy via X
ADA looks like it’s building up for a bigger move. We’ve seen signs like triangle patterns and double bottoms forming, both can be early signs of a change in trend. Things look slightly bullish, but there’s still a chance that the price could drop lower if momentum doesn’t follow through. For now, ADA is in a wait-and-watch zone.
In the current volatile landscape of cryptocurrency, particularly for assets like XRP, it’s becoming increasingly important to remain grounded amid the flood of narratives and speculation.
The crypto market, still relatively young and frequently manipulated, often experiences waves of misinformation that can shake investor confidence.
These narratives, whether coordinated or not, appear designed to discourage retail participation, subtly nudging investors to abandon their positions through fear, doubt, or boredom—especially during periods of price consolidation.
XRP, despite the controversy and the drawn-out SEC lawsuit, is presented as a project with deep-rooted potential due to Ripple’s business model, strategic acquisitions, and existing infrastructure. Many of Ripple’s strategic moves, both public and behind closed doors, point toward long-term value creation.
The real concern lies not in the technology or fundamentals, but in emotional decision-making that leads to premature selling. Selling during periods of low price action, influenced by bearish sentiment or frustration with market stagnation, is identified as the primary way investors sabotage their own potential profits.
A forward-looking perspective suggests that once regulatory clarity is finally achieved—both through an official SEC ruling and broader guidelines for the crypto industry—there may be a seismic shift in mainstream adoption.
Traditional financial institutions could begin recommending assets like Bitcoin, Ethereum, and XRP to their customers, funneling trillions of dollars into the digital asset space.
While Bitcoin is likened to digital gold and Ethereum currently faces its own complexities, XRP’s value proposition is considered more accessible and easier to grasp, particularly due to its central role in cross-border payments.
Source – Austin Hilton on YouTube
XRP’s current market behavior is drawing attention due to its unusually low volatility, particularly over the past week. Despite maintaining strong support around the $2.05 level, price action has remained largely stagnant since Wednesday.
Historically, such quiet periods have preceded bullish movements, and while that could be the case again, caution is warranted. Over the weekend, Bitcoin’s leveraged rally during the low-volume Asian session has led to skepticism, especially considering the potential for weekend manipulation.
$XRP, too, may experience temporary volatility within a range of $1.95 to $2.20, but significant price moves seem unlikely without a substantial shift in volume. Spot trading volume has dropped to approximately $1.8 billion, with perpetual futures volume also reflecting reduced interest.
While a breakout toward $2.30 or even $2.40 remains a longer-term possibility, current indicators do not yet support a clear bullish signal. Traders are advised to monitor the market closely for any shifts in momentum or volume before taking positions.
While holding through market turbulence is one strategy, the opportunities go beyond just holding XRP, as new cryptocurrencies with high potential continue to emerge. One such token is BTC Bull (BTCBULL) presale, a rising meme coin that closely ties its value to Bitcoin’s success.
As the largest cryptocurrency in the world, Bitcoin has a long history of price growth, making BTC Bull an attractive investment for those looking to capitalize on Bitcoin’s future growth.
The BTC Bull token offers a unique opportunity for holders, promising not only appreciation in value but also direct rewards in Bitcoin as the value of the leading crypto increases. The main attraction of BTCBULL lies in its reward system, which begins with Bitcoin airdrops triggered when BTC hits significant milestones, such as $150,000 and $200,000.
Additionally, every time Bitcoin reaches a new milestone, such as an extra $25,000 in value, BTC Bull tokens will be burned, creating a scarcity effect that drives up the value of the remaining supply. Along with the burning mechanism, BTC Bull also offers a staking feature, allowing token holders to earn extra income.
The project is designed with a high annual percentage yield (APY) of 87%, with over 1.2 billion $BTCBULL tokens already staked. This is especially attractive during the presale period, as participants can start earning rewards right away.
BTC Bull is currently in its ongoing presale, having raised $4.7 million, with its native token, priced at $0.00247 each. Investors can connect their preferred wallet, such as Best Wallet, and purchase tokens using $ETH or $USDT.

Furthermore, the roadmap of BTC Bull is unique in that it ties its milestones directly to Bitcoin’s price, which adds an extra layer of interest and excitement for investors who are familiar with Bitcoin’s market movements.
The BTC Bull project also boasts a well-structured tokenomics model, with 40% of the total supply allocated to marketing efforts. This focus on aggressive marketing and promotion is critical for the success of meme coins, as hype and community engagement are often what drives these tokens’ value.
The project’s team is highly invested in ensuring that the project reaches a wide audience, which could have a positive impact on both $BTCBULL’s price and, by extension, Bitcoin’s price.
With 15% of the total supply set aside for a Bull Fund and Milestone Burn Fund, 10% for airdrops, staking rewards, and exchange liquidity, the project ensures a steady flow of incentives for its community.
The transparency and security of BTC Bull are also noteworthy, with the project’s smart contract being audited and publicly available. This adds an extra layer of trust for potential investors, as the absence of errors in the audit reinforces the reliability of the platform.
The project’s use of Ethereum’s network for its token also ensures that it benefits from the security and scalability that comes with Ethereum’s infrastructure, making it an even more attractive option for investors looking for a solid meme token with long-term growth potential.
These efforts are expected to play a significant role in driving demand and encouraging participation in the presale. The project’s Bitcoin-linked rewards and aggressive marketing make it a promising addition to the meme coin space, poised to benefit from the broader crypto market growth.
As Bitcoin continues to rise, BTC Bull offers a compelling opportunity for investors to capitalize on the potential of both the meme coin market and the most successful cryptocurrency in history. To take part in the $BTCBULL token presale, visit btcbulltoken.com.
Cardano (ADA) shows potential for a major breakout amid increased capital flow from institutional investors and ecosystem growth. Market analysts observe a repeat in historical patterns and technical formations that support a bullish price trend. Cardano is set to leverage continuous network updates, passive capital inflows, and a resurgence in investor confidence.
Analysts predict that $ADA will rebound to $7 because of passive inflows from indexes and a shift in institutional funds from Bitcoin. Although Bitcoin controls over 60% of the cryptocurrency market, investors seem likely to move funds into alternative assets such as Cardano. Technical indicators show that Cardano will capture part of this market liquidity, which will enhance its market capitalization and dominance.
Hydra and Midnight upgrades could fuel network and price growth. These upgrades attract institutional investors because they provide fast and secure data transfer for decentralized applications. An increase in institutional interest and investment in Cardano could fuel further price appreciation and support the bullish momentum.
Cardano’s price continues to consolidate in a symmetrical triangle. A breakout could lead to short-term price movements.
ADA eyes a potential breakout from its short-term descending trendline. A continued breakout pattern could lead to higher lows and lead to further increases in price.
Moreover, analysis of Cardano’s symmetrical triangle indicates a continuation trend that precedes a breakout. Analysts predict that a breakout from this pattern could result in a 30% price fluctuation in either direction. However, the current market sentiment and technical indicators point to a possible bullish outcome.
The recent chart patterns mirror the 2021 technical pattern that drove $ADA to a peak of $2.50. The weekly chart shows a double-bottom chart formation, which is identical to previous bullish formations that preceded major price increases. A successful breakout and retest could create conditions for long-term price growth in the next few weeks.

Historically, a breakout from a falling wedge pattern could fuel a sharp increase in price. Cardano experiences increased volumes and a neutral RSI indicator, which positions it for a major rally without short-term risks.

Analysts predict Cardano’s price will hit $2 by June if it turns major resistance levels into support areas. This supports the Cardano bullish trend with additional potential for price growth. As of the time of writing Cardano’s price traded at $0.625
 Poised for a Major Breakout Amidst Bullish Signals?")


