The main tag of cryptocurrency price today Articles.
You can use the search box below to find what you need.
[wd_asp id=1]
The main tag of cryptocurrency price today Articles.
You can use the search box below to find what you need.
[wd_asp id=1]
Bitcoin, the king currency, has plummeted over 10%, currently trading at a precarious $53,270. Solana, the fifth-largest digital currency, has suffered an even steeper decline, losing nearly 17% of its value. The overall crypto market capitalization has taken a massive hit, shrinking by 13% to $1.87 trillion. Ironically, this dramatic price drop has coincided with a staggering 119.72% surge in trading volume, indicating a market gripped by fear and uncertainty.
What triggered this sudden collapse? And can the crypto market recover from this steep dive?
Interest in Solana has surged as traders look forward to the launch of Solana ETFs in the U.S. However, the recent decline in crypto prices is linked to a sell-off in the Japanese stock market, where the Nikkei 225 index fell by 7.1%.
On August 2, Japanese bank stocks experienced their worst day since 2008, following the central bank’s decision to raise interest rates. This sudden market crash resulted in a brief wipeout of about $500 billion from the total crypto market capitalization over three days, marking the largest 72-hour loss in more than a year.
Despite the broader market downturn, Solana’s decentralized exchange (DEX) performance has been strong. In July, 30% of crypto DEX volume came from protocols built on the Solana network, surpassing Ethereum’s 28.12%.
By the end of the month, Solana’s DeFi ecosystem had processed $56.849 billion in transactions, while Ethereum handled $53.867 billion.
Currently, Solana (SOL) is trading at $121.58, reflecting a drop of 15.76% in the last 24 hours and 37.2% over the past week. If the price falls below $115, it might decline further to the support level of $107. Conversely, if it rises above $135, it could reach the resistance level of $164.
Also Check Out: Japan Stock Market Crash Trigger Crypto Market Crash, Bitcoin & Ethereum Bleeding
The crypto market is a rollercoaster. Keep a watch on Solana!
If this trend continues, Ethereum could see a further decline towards the $2,500 support level. This key support level is critical as it represents a psychological barrier and a historical support point. Should the price break below this level, it could trigger a more substantial sell-off. On the resistance side, the nearest level to watch is around $3,000, which, if breached, could provide some respite to the bulls.
In conclusion, the current technical indicators suggest that Ethereum’s price is poised for further downside, with ETF outflows exacerbating the situation. The $2,500 support level will be crucial in determining the next move, and traders should watch for any signs of reversal or further bearish momentum.
This slower-than-expected growth may lead the Federal Reserve to reassess their monetary policy decisions, potentially considering rate cuts later in the next Fed meeting slated for September.
Historically, a dovish Fed lowering interest rates often increase investor appetite for riskier assets. Hence as the prospects of a Fed cut grows in the coming week, risk-assets, ranging from stocks to cryptocurrencies will likely attract increased market demand.
This dovish expectations could encourage US-based investors, especially institutional players investing 11 actively trading BTC ETFs to begin making strategic Bitcoin purchases to front-run the next Fed rate cut.
If this scenario plays out, Bitcoin bulls can expect to avoid a breakdown below the psychological support at the $55,000 level in the week ahead.
Bitcoin’s recent price action suggests a neutral bias, leaning towards a rebound to $62,000, as the Relative Strength Index (RSI) has bounced off the oversold region (30) and is currently at 43.
The Bollinger Bands indicate a contraction in volatility, suggesting a potential breakout. The upper band ($61,300) and lower band ($56,800) will be key levels to monitor. A move above the upper band could confirm the rebound, while a break below the lower band would indicate further weakness.
Fear, uncertainty, and doubt (FUD), have rocked the global crypto market, leading to a significant downturn. Traders woke up on August 5 to find the crypto market in a ‘bloodbath’ with top cryptocurrencies including Bitcoin and Ethereum taking massive hits. Consequently, the total market value has crashed by a notable 13%, dropping below the $2 trillion mark to $1.85 trillion.
The latest data has sent shockwaves through the market as investors are indecisive on what to do next. The flagship cryptocurrency, BTC, has plummeted by more than 12% at the time of writing, now changing hands at $53k. Also, Ethereum has dropped far below $3k, now trading at $2,300. As the Bears are gaining momentum, investors are asking why Bitcoin and the crypto market crashed today. Let us have a look.
One of the major reasons for the current downtrend witnessed in the crypto market at this time is the significant negative flows of both the Bitcoin and Ethereum exchange-traded fund (ETF). As of the last Soso Value data update on August 2, BTC saw a daily total net inflows of negative $237.45 million. Meanwhile, Ethereum’s value rested at a negative $54.27 million.
Notably, for BTC ETF, Fidelity’s FBTC fund recorded the largest outflows with $104.10 million. Ark’s ARKBa and Grayscale’s GBTC came in second and third with $87.68 million and $45.95 million respectively. The outflow values crushed the inflows which saw BlackRock’s IBIT fund record the largest inflow with $42.81 million.
For ETH ETF, Grayscale’s ETHE saw $61.43 million in outflows on the same date while Fidelity’s FETH recorded the highest inflow with just $6.02 million. Comparing these data, the significant outflows have struck a disastrous blow to the market.
Another reason for the recent crypto market crash is the Mt. Gox Bitcoin repayment activity. Before the start of the scheduled creditor repayments, market participants expressed their worries about the potential effect it would have on the broader market. Investors speculated that the creditors, who have waited a decade for their funds, will start a selling spree once the funds hit their wallets.
Some analysts even predicted that the price of BTC might fall as low as $45,000 in the coming months as a result of the speculated selloff. Even though BTC’s price showed some form of resilience, it may seem that the prediction is materializing.
Last week, the defunct crypto exchange sent billions of Bitcoins to designated crypto exchanges for redistribution to its rehabilitation creditors. Following this, creditors who received their pay quickly cashed out by selling on the open market, thus, increasing the selling pressure on the coin.
At press time, Mt. Gox still holds 46.164k BTC, valued at approximately $2.45 billion to be repaid to its creditors.
Before the last Federal Open Market Committee (FOMC) meeting which happened on July 31, the crypto market enjoyed a notable uptrend triggered by the expectation of a rate cut by the Fed. However, during the conference, the Federal Reserve kept the interest rate at 5.25% – 5.5%, teasing a possible rate cut in September.
Consequently, the excitement faded across the crypto market which catalyzed a bearish turn. Bitcoin critic Peter Schiff also made a comment pointing out that the Fed rate cut might not revive the economy, instead, it will increase inflation.
Over the weekend, the crypto market experienced massive long liquidations. According to Coinglass data, Bitcoin saw over $241.07 million liquidated, which represents about 90% of the total market liquidation. This has increased the pressure on the crypto market as the coin now trades at its monthly lowest. Also, the Bitcoin Open Interest has declined by 16.26% in the last 24 hours.
As of today, Cardano (ADA) is priced at $0.36109, with a 24-hour trading volume of $464.06 million and a market cap of $12.89 billion. It holds a market dominance of 0.60%, but the ADA price has dropped by 2.47% over the past 24 hours.
Cardano reached its all-time high of $3.10 on September 2, 2021, while its all-time low was $0.017354 on October 1, 2017. Since hitting its peak, the lowest price ADA has seen is $0.234392, and the highest price since then is $0.806108. Currently, the sentiment around ADA is bearish, with the Fear & Greed Index at 34, indicating a sense of fear.
Cardano’s circulating supply stands at 35.69 billion ADA out of a maximum supply of 45 billion ADA. Over the past year, the annual inflation rate for ADA has been 5.53%, resulting in the creation of 1.87 billion new ADA.
Cardano’s recent price drop can be traced to a combination of market-wide and network-specific issues. The cryptocurrency market, in general, has been under pressure, with Bitcoin’s fall from $70,000 to approximately $60,000 impacting other major altcoins, including ADA. This downturn has strained Cardano’s technical outlook, making it more vulnerable to price declines.
External factors also play a role, such as geopolitical uncertainties and shifting economic conditions. The reduced expectations for rate cuts in 2024, due to concerns about a potential U.S. recession, have dampened overall market sentiment. This has likely led to decreased investor interest in cryptocurrencies, including Cardano.
Additionally, Cardano’s network activity has been declining, as evidenced by recent data showing a 48% drop in new addresses over the past two months. From June to early August, the number of new addresses fell from 14,700 to 7,650.
This decrease, along with a slight reduction in the total number of addresses from 4.46 million to 4.45 million since February, suggests a drop in user engagement. Lower network activity usually signals reduced demand, which makes it harder for ADA to sustain any upward momentum, contributing to its current price struggles.
While Cardano (ADA) is facing significant challenges, a complete crash to zero seems improbable given its current fundamentals and market positioning. Despite the recent downturn, ADA has demonstrated a 24% increase in price over the past year, highlighting its relative resilience amid broader market volatility.
The asset also benefits from high liquidity due to its substantial market capitalization, which helps buffer against extreme price fluctuations.
Cardano’s recent performance, while disappointing, shows that it has outperformed 57% of the top 100 cryptocurrencies over the past year. This indicates that while ADA is struggling, it is not among the worst performers in the market. Its current trading price, which is below the 200-day simple moving average, reflects a bearish trend but does not necessarily imply an impending total collapse.
Furthermore, the context of the broader economic environment plays a crucial role in ADA’s current trajectory. On the day of a recent poor economic report, both the stock and crypto markets experienced sharp declines.
For instance, Bitcoin’s price fell from $65,400 to $62,350 in response to the adverse economic data. This broader market reaction underscores that ADA’s current struggles are part of a larger trend affecting many assets rather than a unique indicator of its failure.
ADA is currently down 88% from its all-time high, a significant drop that illustrates the impact of market conditions and investor sentiment. However, this does not directly translate to an imminent total loss of value.
The asset’s yearly inflation rate of 5.53% is relatively moderate compared to some cryptocurrencies, suggesting that while new ADA is continuously being issued, it is not inflating at an alarming rate that would precipitate a total collapse.
While ADA is experiencing a period of decline, marked by only 14 green days out of the last 30 and trading below key moving averages, the combination of its high liquidity, historical performance, and broader market dynamics suggests that a complete crash to zero is unlikely. ADA’s current challenges reflect market volatility and economic pressures rather than a fundamental failure of the asset itself.
Disclaimer: The opinions expressed by our writers are their own and do not represent the views of U.Today. The financial and market information provided on U.Today is intended for informational purposes only. U.Today is not liable for any financial losses incurred while trading cryptocurrencies. Conduct your own research by contacting financial experts before making any investment decisions. We believe that all content is accurate as of the date of publication, but certain offers mentioned may no longer be available.
The popular cryptocurrency XRP is currently at a crossroads in terms of its price trajectory, as shown by the Bollinger Bands, a widely used technical indicator developed by John Bollinger. With XRP currently trading at $0.54 per coin, it has broken through the lower boundary of the dynamic price range as defined by the indicator.
Bollinger Bands are made up of a middle line, which is usually a moving average, and two bands that sit at a certain number of standard deviations above and below this line. When the price of an asset moves outside the bands, it can be seen as a sign that the current trend might be continuing, or a reversal is somewhere very near.
When the price breaks below the lower band, as XRP did, it means that the asset is oversold and traders are likely to look for a rebound or further decline.
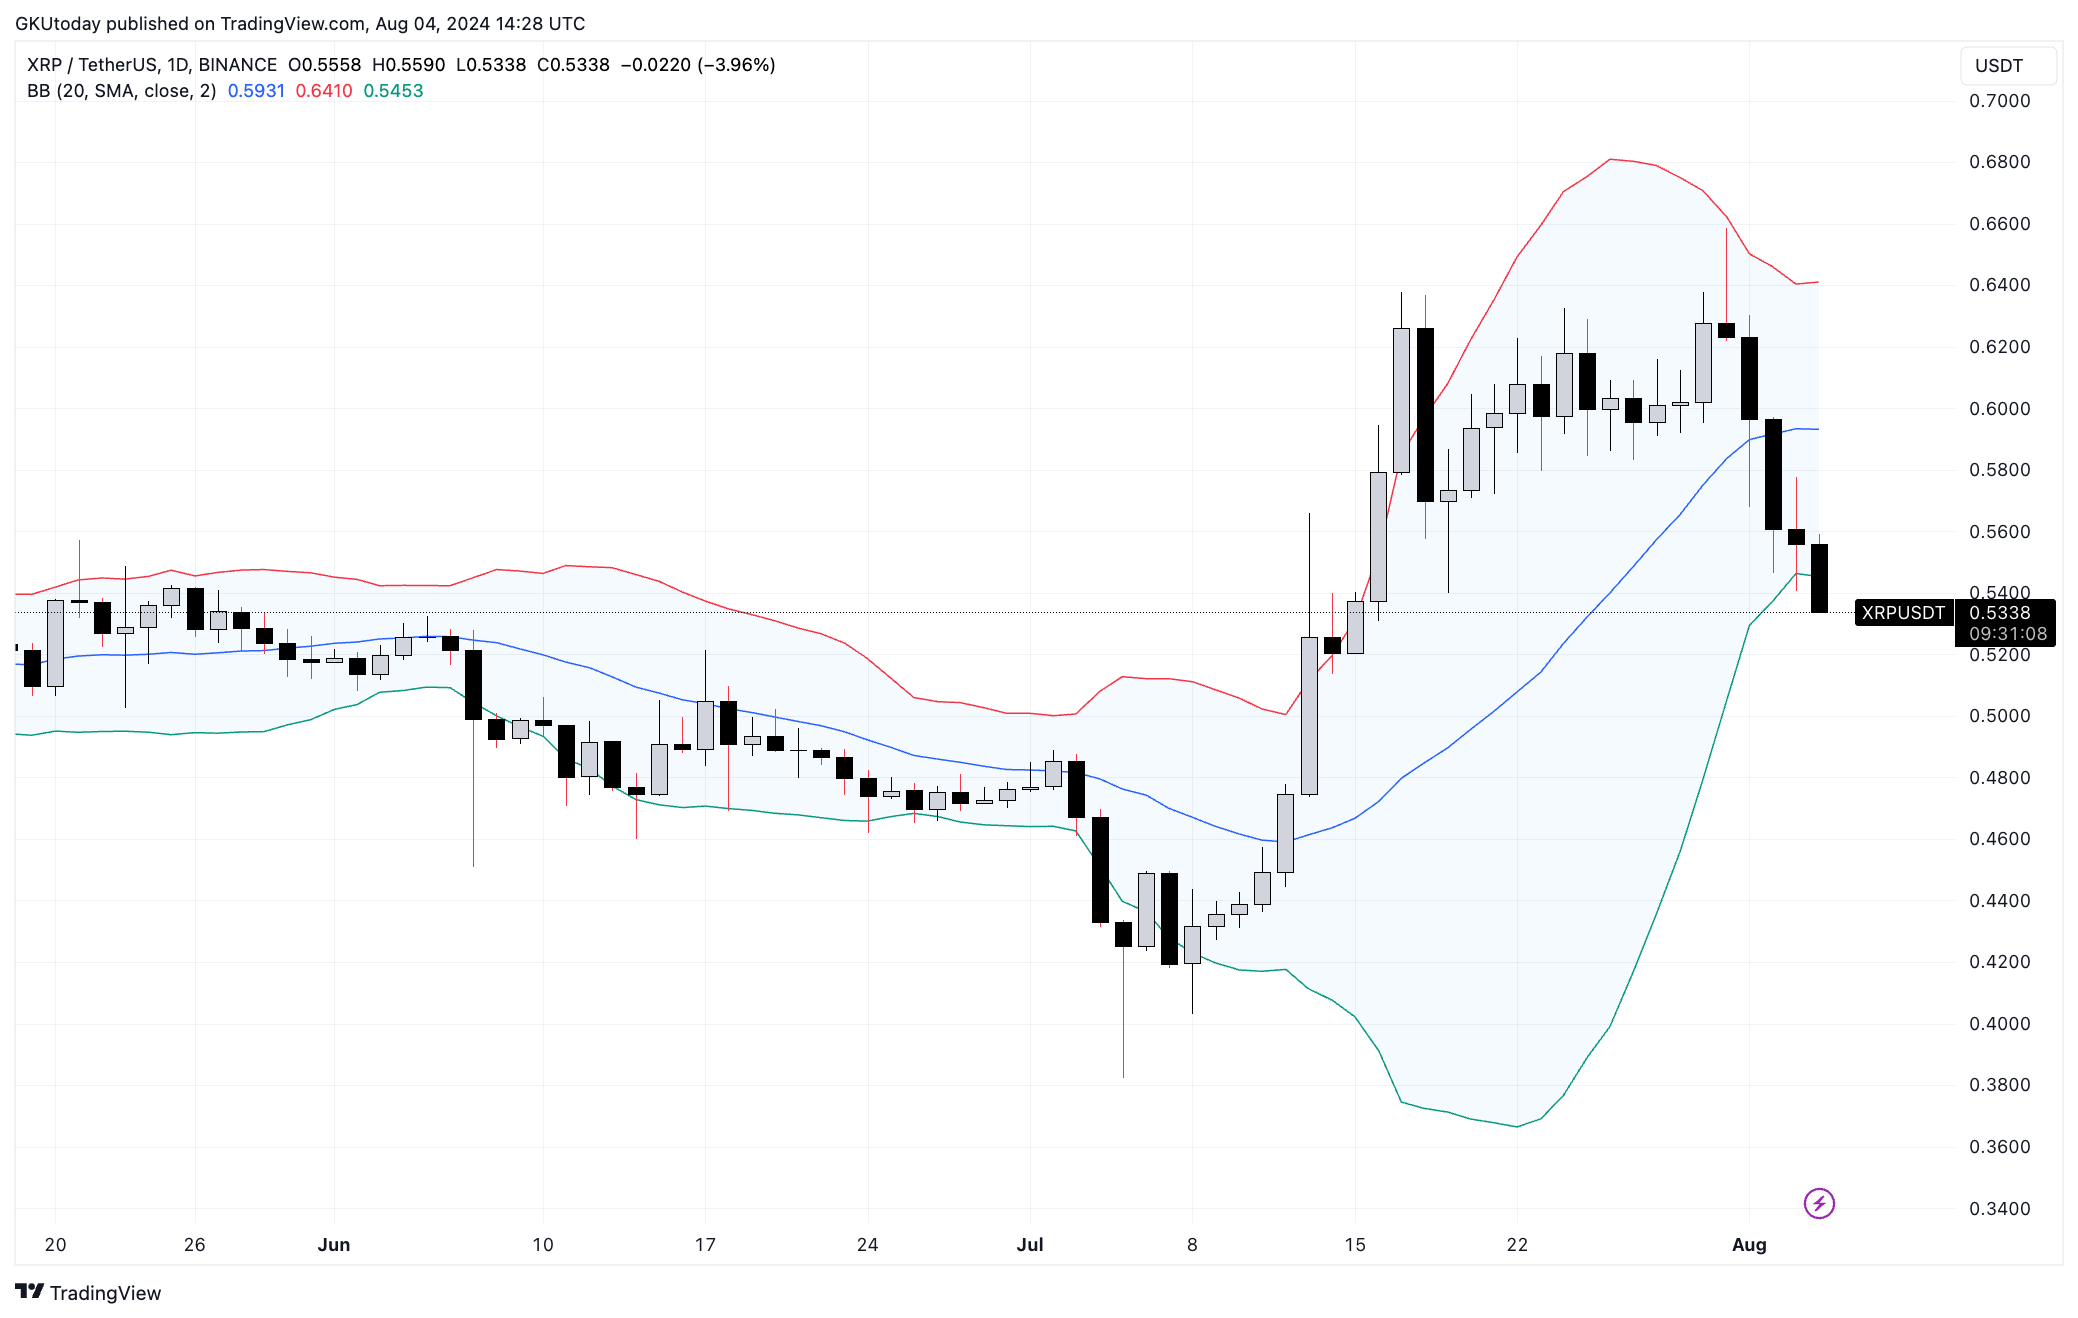
As such, XRP’s price action at the moment is indicative of extremely bearish sentiment among traders toward one of the market’s largest assets.
The last time something like this happened was in early July, when XRP fell 11% intraday, only to bounce back between bands.

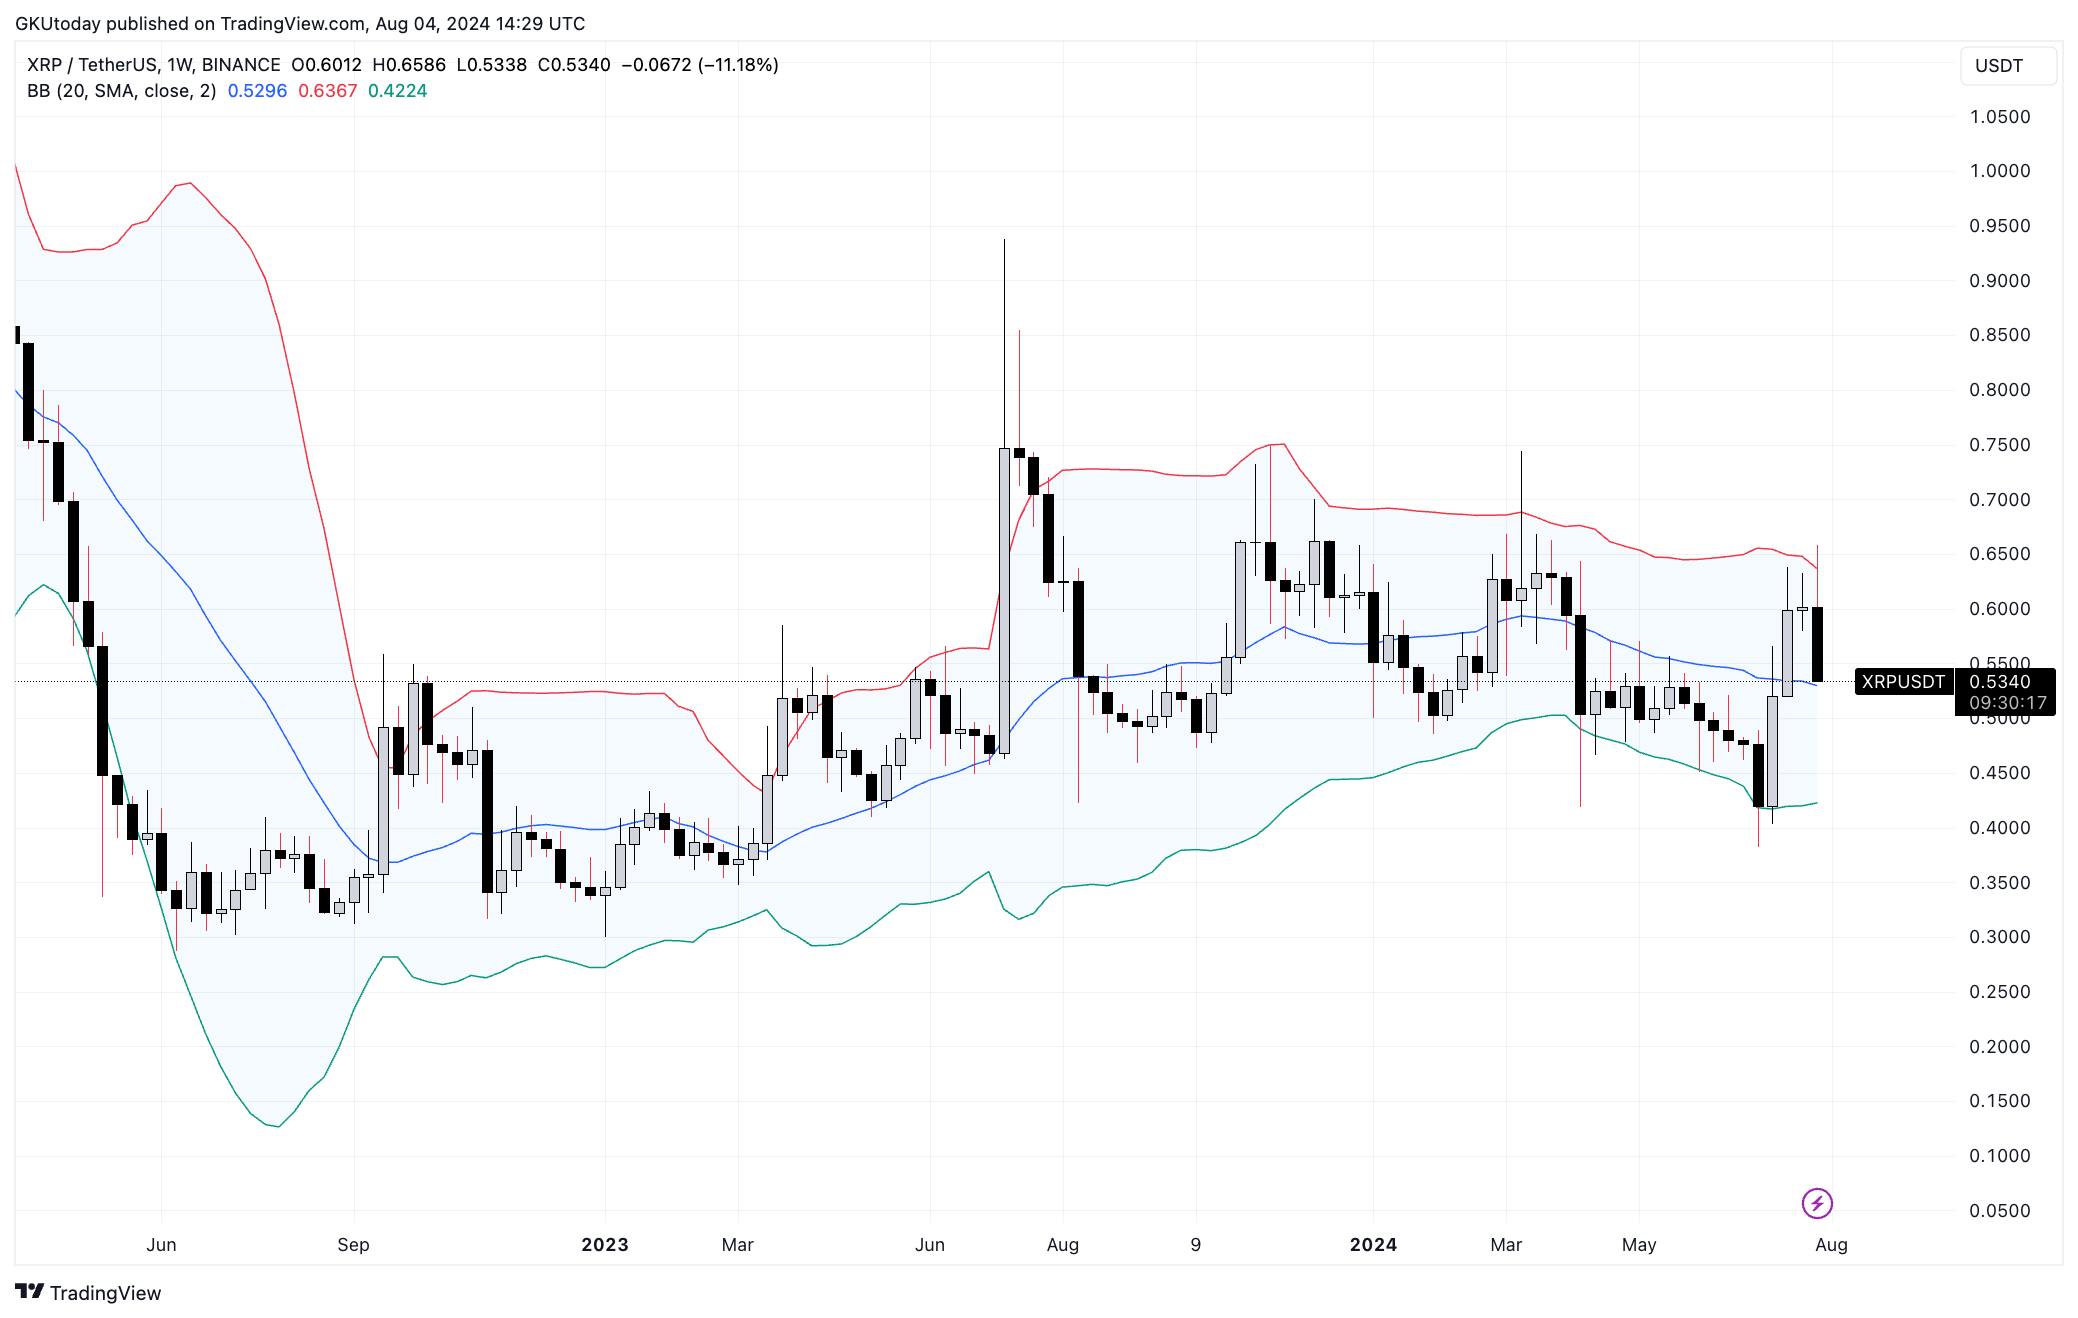
On the weekly chart, however, XRP is still within the range and is about to retest the midline. So, if we try to outline scenarios based on this chart, we have the next picture. If XRP fails to hold $0.53, it could fall further to around $0.42. If $0.53 is held and maintained, then the bias is to go to $0.64.
5thScape is quickly becoming the talk of the town regarding crypto with its Ethereum-based AR & VR environment. Although Solana (SOL) boasts about speedy transactions and little to no fee, 5thScape is the novel utility token giant. In the case of Solana, the bullish trend seems convincing. However, the immersible platform offered by 5thScape with Virtual Reality technologies is more attractive for investment. Regarding the market results, 5thScape easily outpaces Solana due to the company’s different model and growing ecosystem, despite the recent indicators. That is why when 5thScape draws investors’ attention with its professionalism and innovative technologies, it aims to change the pace in the market.
To be fair, it has “outpaced” many competitors in terms of popularity as 2024’s prime presale choice of investors. The project had humble beginnings with its presale. However, it has been quick to raise a whopping $7 presale funding. Not just crypto investors, entertainment seekers with an appetite for immersive entertainment are also taking an interest in the 5SCAPE token’s presale. Is there any reason why one should keep themselves from using this perfect opportunity to invest in the AR/VR sector? 5thScape presents a strategic investment opportunity into the new dimension of entertainment.
The demand for VR technology’s experiences has grown multifold post-pandemic. Now, more and more people want to fully submerge themselves in their choice of content. Whether it is a movie, a live concert, virtual gaming scenes, or even learning experiences. They want to experience the thrill of virtual reality from the comfort of their couch. The easy availability of VR headsets and other physical VR accessories sorts out the hardware requirements to truly step into VR content.
Visit 5thScape website to know more
5thScape, on the other hand, takes care of people’s vast interests in VR content categories. The project offers 2 robust physical VR accessories, too – the Ultra HD VR headset and the SwiftScape VR Gaming Chair with perfect ergonomics. However, the central theme of this platform is its VR content hub. Its online VR library has multiple VR movies, VR gaming titles, learning experiences, and more. This library is constantly updated with fresh content for its curious explorers. Built on Ethereum’s blockchain network with L2 sidechains of the Skale network, 5thScape offers optimum security of its users’ data and assets. It also maintains transparency with every transaction performed on the platform.
This visionary project’s backend team is hard at work to onboard AR features into the platform, which will help broaden its offerings. With their AR glasses on, this futuristic technology’s users will be able to explore historic sites, collaborate with their team members at a roundtable, or view an overlay of their architectural designs – all while sitting on their living room’s lounge chair. The possibilities are endless when you have your immersive gears plugged in with the 5thScape’s online destination.
For the gaming community members, it has back-to-back VR gaming title launches planned, from Epic Cricket Arena to a 3D soccer game called Immersive Kickoff and a VR arrow shooter game called Archery Master. Undoubtedly, 5thScape has a lot in its wonder warehouse for its early investors and users alike.
If you think there is something amiss for user-generated VR content, wait until its planned launch of a dedicated marketplace scheduled for 2025 comes live. This first-of-its-kind online marketplace will allow VR content creators to monetize their creations by offering them directly to VR content consumers. They will be rewarded with the 5SCAPE tokens in return, keeping its circulation afloat.
5SCAPE token serves multiple purposes on the 5thScape VR platform. It acts like a universal currency and gives people access to the platform’s VR content as they please. The games present in 5thScape’s library let people purchase in-game content and exclusive upgrades via 5SCAPE token that can make their gaming experiences better.
Like other native tokens, it also comes with staking opportunities and voting rights for the holders. 5SCAPE holders can have a say in the platform’s developments – be it a policy-making decision, a suggestion to include specific kinds of VR content, or tweak existing ones by fixing any potential bugs.
During the presale, 5SCAPE token is available under a cent, which positions it as the perfect “penny cryptocurrency” to invest in and gain potential returns as the VR market goes skyrocketing “to the moon”. Substantial returns from 5SCAPE investments are on the cards, its internal analysts are projecting its price to reach $10 by 2025, but can this humble token deliver more?
While Solana investors are eyeing a $200 touchpoint for the SOL token, they might be missing out on the 10000x gains that 5thScape promises to deliver. With AR/VR industries (combined) set to contribute $1.9 trillion to the global economy by 2028, the 5SCAPE token can offer unimaginable returns. Its growing usage, coupled with a scarce supply, which is already capped at 5.21 billion, can push the token towards monumental price increases in the next few years as AR/VR industries mature. A $100 investment into 5SCAPE’s promising future right now can turn into $1000 in no time. Its strategic design and direct link to the VR industry make it a highly profitable addition to every investor’s crypto portfolio.
Solana’s upgrades have made it a better blockchain network with speedy processes and maximum scalability for dApps. Its struggle persists to compete in a saturated market where Ethereum leads, offering more security features than any other blockchain network. SOL, however, is an ideal investment option and can be accumulated during market dips.
5thScape, on the other hand, exposes your crypto portfolio to a new and thriving industry altogether. Addressing the lack of VR content available on the internet, it has found its niche as a go-to destination for high-quality VR-compatible content for different categories. The vast offerings of the 5thScape VR ecosystem and its quest to become a market leader is attracting crypto investors toward its presale.
Its 6th presale round will be ending soon, which will lead to a price appreciation of 5SCAPE by 15.8%. This uptrend will continue for the next 6 stages as well. Grab the 5SCAPE tokens while they are still available at an affordable entry point. Its listing price will be $0.1, delivering 200x short-term profits to those investing right now. Meanwhile, its 1st presale stage investors will enjoy more than 600x returns. Make your move count by becoming an early adopter of this future-proof crypto project.
The rise of most of the coins has stopped, according to CoinStats.BNB chart by CoinStats
The rate of Binance Coin (BNB) has dropped by 2.62% over the last day.Image by TradingView
On the hourly chart, the price of BNB is looking bullish as it is on its way to testing the local resistance level of $576.40. If the bar closes near it, there is a chance of a breakout, followed by a move to the $580 zone.Image by TradingView
On the bigger time frame, the rate of the native exchange coin is far from the support and resistance. It means that none of the sides is ready for a sharp move.
Such a statement is also confirmed by low volume. All in all, sideways trading in the wide range of $560-$590 is the most likely scenario.Image by TradingView
From the midterm point of view, the picture is quite similar. If the weekly candle closes around current prices, traders may witness an ongoing consolidation between $550 and $600.
BNB is trading at $574.40 at press time.
According to analysts, XRP is forming a symmetrical triangle pattern on its 3-monthly chart, indicating decreasing market volatility and the potential for a significant breakout by the end of September 2024. This pattern involves converging support and resistance lines, suggesting a buildup of market strength.

The downward-sloping resistance line, termed “Ultimate Resistance,” represents a critical psychological barrier, while the upward-sloping support line is the “Ultimate Support.” Recently, XRP found support at the 23.60% Fibonacci retracement level at $0.3917 after dipping below the support line in July. Currently trading above this trendline, XRP’s performance by September 30, 2024, will be crucial for confirming a bullish trend.
Some analysts’ price targets are highly ambitious, starting with immediate resistance at $0.6649 and extending to $18.2364. The 70.20% mark at $0.6649 could confirm bullish sentiment, while the 100.00% level at $0.9327 would signify a full retracement of previous declines. Further bullish targets include $1.8817, $5.8579, and the ultimate breakout target at $18.2364.
Echoing past patterns, XRP’s market conditions resemble those preceding its monumental 60,000% rally in 2018. Notably, the Bollinger Band Width (BBW) on XRP’s monthly chart hit a record low in July, indicating a period of low volatility similar to the pre-2018 rally phase. Historically, such low volatility periods precede major price movements, suggesting a potential breakout.

During the 2016-2017 session, XRP’s BBW contraction led to a 66,000% price breakout. This time, the consolidation has lasted twice as long, with even lower monthly volatility, which is what other analysts anticipated a significant price breakout for XRP price.

XRP’s current valuation of approximately $0.62 is near the middle Bollinger Band, reflecting balanced market forces. However, trading above this middle band suggests a bullish tilt. The symmetrical triangle on XRP’s monthly chart hints at an upside continuation, with a potential target of $14.75, up about 2,200% from current levels.

Both technical and fundamental XRP price analyses suggest that XRP could be on the cusp of a major breakout. Key price targets range from $0.6649 to an optimistic $18.2364, with historical patterns indicating a potential for substantial gains. With these indicators, XRP’s performance should be closely monitored as it approaches the critical end-of-September period.
As the cryptocurrency market buzzes with predictions of a more robust bull run, XRP finds itself at the center of attention. Zach Humphries recently sought insights from Musk’s xAI-developed Grok about XRP’s price prospects. He directly asked if XRP would see a price increase this year.

Grok responded positively, indicating a likely price rise for XRP within the year. It cited predictions from many experts and analysts, forecasting a bullish trend for XRP in 2024. Some predictions suggest a price target between $2 and $5, representing a significant increase from its current value. Despite this optimism, Grok emphasized the volatile and unpredictable nature of crypto markets, noting that certainty is never guaranteed.
Notably, XRP would need to rise by approximately 234.22% to reach $2 from its current price. Currently, XRP is trading at $0.5984 with a trading volume surge of over 20% in the past day, amounting to $1,154,047,024.

Interestingly, a recent analysis from Coin Signal aligns with Grok’s optimistic outlook. Per his analysis, XRP’s monthly candlestick pattern reveals the formation of two symmetrical triangles over the past decade.
The first triangle, which formed between 2014 and early 2017, resulted in a massive 70,000% surge to an all-time high. A second symmetrical triangle, formed since XRP’s 2018 high of $3.84, suggests another potential high. Coin Signal sees realistic targets for XRP between $2 and $4 in the current bull cycle.
Similarly, Captain Faibik’s analysis showed that XRP bulls are nearing a critical trendline resistance on the weekly chart. This resistance, part of a symmetrical triangle pattern, presents a significant hurdle. Faibik emphasized that a successful breakout could lead to a substantial price increase, with targets around $2.50.

Meanwhile, Grok’s prediction is not the first bullish XRP price projection from an AI chatbot. On July 8, The Crypto Basic reported ChatGPT’s predictions for XRP prices, contingent on Ripple’s potential victory against the SEC.
The ongoing lawsuit has significantly influenced XRP’s price, with speculations suggesting that a favorable outcome for Ripple could lead to substantial price gains. ChatGPT outlined conservative estimates of XRP soaring between $3 and $5 if Ripple wins the case.
Google Bard, another AI chatbot, offered a cautious perspective, acknowledging the difficulties in predicting cryptocurrency prices. Bard identified several factors that could boost XRP’s price, including the resolution of the SEC lawsuit, increased adoption, and positive market sentiment. However, it also highlighted potential obstacles, such as competition from other assets and regulatory pressures.
Disclaimer: This content is informational and should not be considered financial advice. The views expressed in this article may include the author’s personal opinions and do not reflect The Crypto Basic’s opinion. Readers are encouraged to do thorough research before making any investment decisions. The Crypto Basic is not responsible for any financial losses.
-Advertisement-


 Price Sinks Below k: Here’s What to Expect")


