The main tag of cryptocurrency price today Articles.
You can use the search box below to find what you need.
[wd_asp id=1]
The main tag of cryptocurrency price today Articles.
You can use the search box below to find what you need.
[wd_asp id=1]
According to CoinChartist founder Tony Severino, XRP’s monthly Bollinger Bands are the tightest they have ever been.
In fact, they are tighter than before the groundbreaking 60,000% rally that the XRP price that ended in 2018.
Bollinger Bands are a widely used momentum indicator that adjusts to market volatility.
In this particular case, a shrinking gap between the upper and lower bands means that XRP is experiencing relatively low volatility. It is worth noting that a period of extremely low volatility is typically followed by a squeeze.
XRP bulls are now hopeful that such an extraordinarily rare level of low volatility could potentially indicate a significant price spike.
As reported by U.Today, John Bollinger, the founder of the popular indicator, wrote that the largest cryptocurrency was on the verge of a squeeze last August. Since then, Bitcoin rallied roughly 187%, eventually peaking this March.
According to CoinGecko data, the XRP price is currently changing hands at $0.5988, which makes it the sixth biggest cryptocurrency by market capitalization. XRP is down 1.5%, which is in line with the broader market. Bitcoin, for instance, is down more than 4%.
XRP could experience more volatility due to new developments in the closely watched SEC v. Ripple case.
As reported by U.Today, Ripple CEO Brad Garlinghouse recently stopped short of sharing any information about settlement talks. However, he did mention that the resolution of the pivotal case was on the horizon.
XRP is still down 82% from its record high that was achieved in 2018, which makes it one of the worst-performing coins.
About the author
Alex Dovbnya
DOGE price appears to have launched a new bullish phase with bulls eager to push above resistance at $0.2. As sentiment gradually improves, investors are beaming with hope to see a stronger trend reversal.
An assessment of the current technical and fundamental outlook reveals that various factors could impact Dogecoin price action going into August including this week’s FOMC meeting and investor behavior.
After playing defense and losing at it in the first weeks of July, bulls finally assumed the reins, catalyzing a trend reversal from support at $0.1.
Dogecoin made a quick swing to $0.14 validating a falling wedge pattern. Although expected to guide a 70% rally to $0.216, a retest of the upper trend line could offer unique entry positions.
A falling wedge is a bullish reversal pattern formed as the price slides between two slanting trend lines.
Based on CoinMarketCap data, bulls are likely to have run out of steam as trading volume dropped to $800 million. Dogecoin must uphold the immediate confluence support established by the 50-day Exponential Moving Average (EMA) and the 200-day EMA.
A retest of the upper trend line support cannot be ruled out while the presence of the 20-day EMA will further increase the chances of DOGE price resuming the uptrend.
The Moving Average Convergence Divergence (MACD) indicator recently flashed a buy signal encouraging traders to buy the dip. However, the bulls must fight to keep this call to buy active this week.
Dogecoin futures interest open market has since last weekend improved to reach above $5 billion.
Increasing futures open interest signals growing market interest. It suggests more traders are taking positions, potentially indicating a stronger price trend.
Dogecoin traders can leverage the positive OI data to confirm the existing trend as upward but also identify potential reversals, in the event it starts to drop.
The meme coin hype could also rope in Dogecoin’s trend in the second half of the year. Dogecoin and its younger siblings including BOOK OF MEME in the sector seem poised to move alongside Bitcoin’s surge to test the previous all-time highs.
Related Articles
No. Meme coins seem to be emerging as a key sector of the crypto market with investors seeking quicker gains.
Investors and fans alike track the performance of two leading digital assets, Bitcoin and Ethereum. This article will examine price forecasts and market trends for these cryptocurrencies.
Also Read: Ripple (XRP) to Surge? Expert Reveals 6 Bullish Factors
 and Cardano (ADA): Price Predictions August 2024")
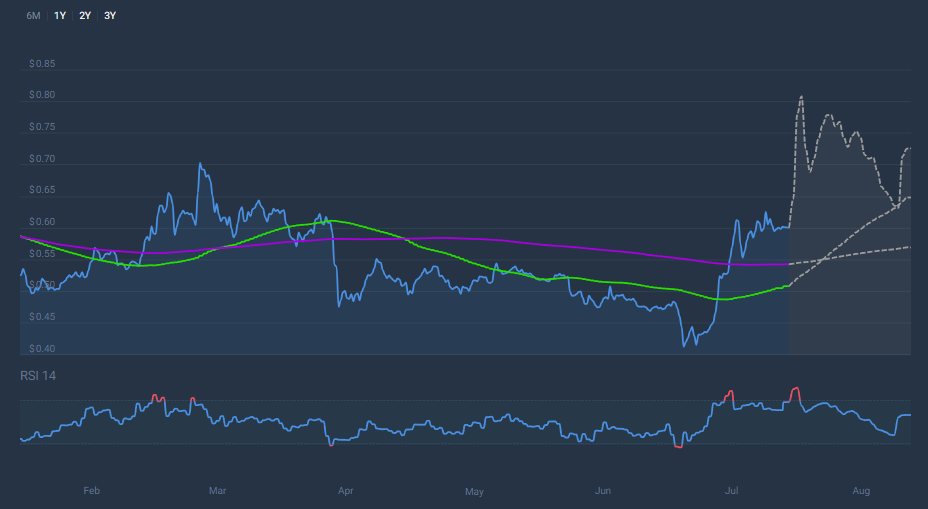
The current price of XRP is $0.607166, and short-term guesses show possible growth. Key signs show an interesting picture for Ripple’s future:
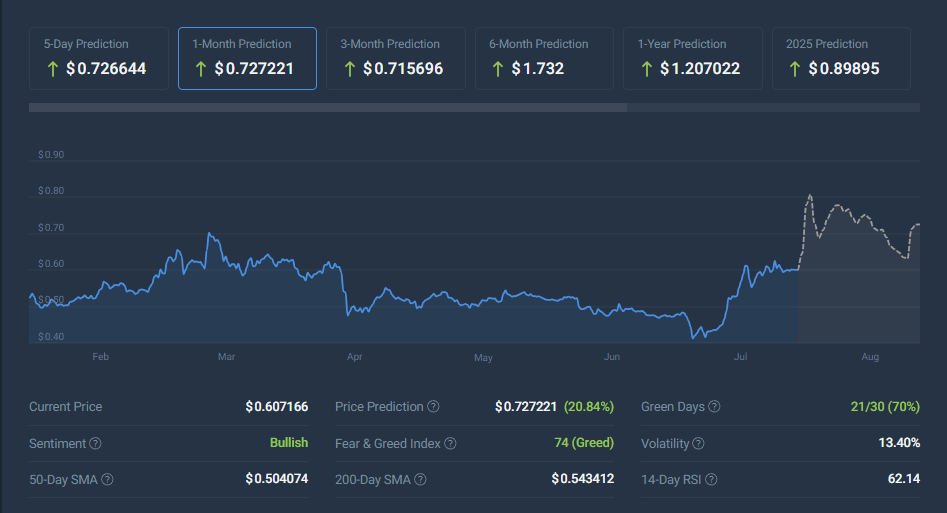
Long-term views for XRP are hopeful. Prices are expected to reach $0.89895 by 2025, with more growth seen in later years.
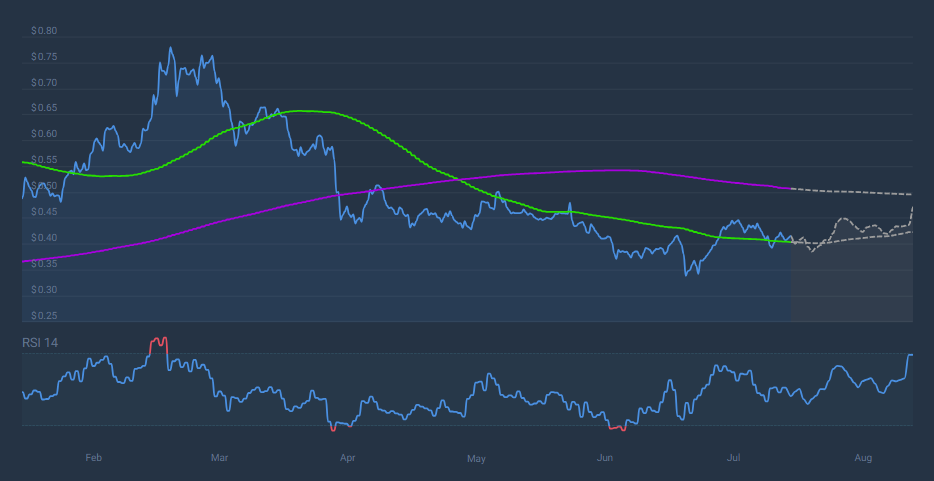
Cardano’s current price is $0.419694, and steady growth in the coming month is hinted by guesses. Key signs for ADA include:
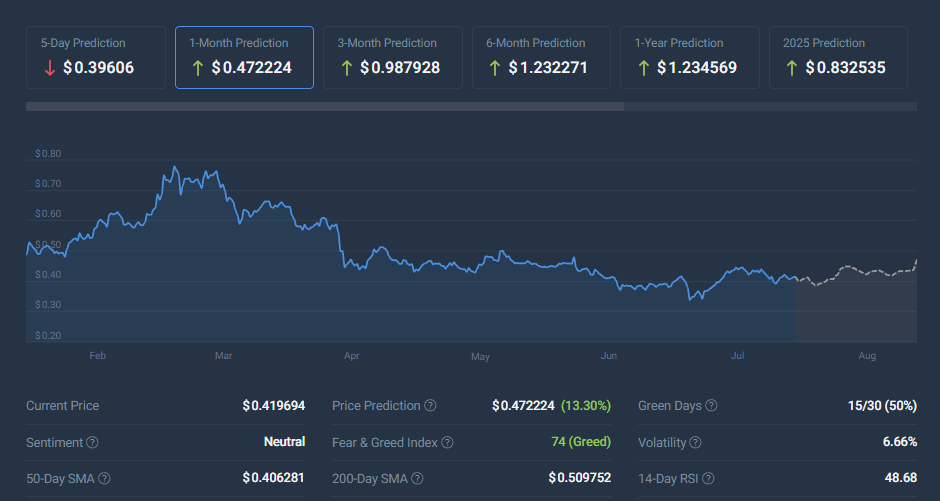
Long-term predictions for Cardano are good, with prices thought to reach $0.832535 by 2025.
Also Read: BlackRock’s Crypto Chief Shuts Down Solana, XRP ETF Hopes
Several factors are likely to sway the prices of Ripple and Cardano
While both Ripple and Cardano show promise, their price trends differ slightly. XRP has more ups and downs, with 13.40% price changes over the last 30 days, compared to ADA’s 6.66%.
Both coins could grow, but XRP looks better soon.
Growth may be pushed by:
Also Read: Cardano (ADA) Price Prediction: July End 2024
To sum up, Ripple (XRP) and Cardano (ADA) look good for investing in August 2024. Experts think XRP will hit $0.727221 and ADA will reach $0.472224 by August’s end.
These guesses are based on current market trends and technical studies. Now, you have the information required to make an informed decision. Use it wisely!
Solana (SOL) has been on an upward trajectory, captivating the crypto community with its robust performance. The blockchain’s ability to handle thousands of transactions per second at low costs has positioned it as a formidable competitor in the space. This efficiency, combined with its expanding ecosystem, continues to fuel Solana’s (SOL) bullish momentum.
Several factors contribute to Solana’s (SOL) ongoing success. The network’s high-speed transactions and low fees have attracted a myriad of decentralized applications (dApps) and developers. Additionally, Solana’s (SOL) innovative technology and strategic partnerships have enhanced its credibility and market presence. These elements create a strong foundation for Solana (SOL), suggesting that its bull run may well continue.
In an exciting development, Mpeppe (MPEPE) has received backing from a prominent Solana (SOL) whale. This endorsement is significant, as it underscores the potential and appeal of Mpeppe (MPEPE) within the crypto community. The support from a SOL whale not only brings credibility but also highlights the promising future of Mpeppe (MPEPE).
The support from a SOL whale can have a substantial impact on Mpeppe (MPEPE). Whales often have significant influence over market trends due to their large holdings and investment strategies. The endorsement of Mpeppe (MPEPE) by a SOL whale signals strong confidence in its potential, likely attracting more investors and boosting its market performance.
Looking ahead, the future of Solana (SOL) appears bright. Its ongoing technological advancements and growing adoption indicate sustained growth. Analysts predict that if Solana (SOL) continues to innovate and expand its ecosystem, the bull run is likely to persist. The network’s ability to attract high-profile projects and investors further reinforces its bullish outlook.
Analysts are optimistic about the future of both Solana (SOL) and Mpeppe (MPEPE). They predict that Solana’s (SOL) bull run will continue, driven by its technological prowess and market adoption. For Mpeppe (MPEPE), the backing from the SOL whale and its unique value proposition are expected to drive significant growth, making it an attractive investment opportunity.
In conclusion, the continued bull run of Solana (SOL) and the rising potential of Mpeppe (MPEPE) present compelling opportunities for investors. The support from a SOL whale further enhances the appeal of Mpeppe (MPEPE), indicating strong growth prospects. As the crypto market evolves, staying informed and embracing strategic investments in tokens like Solana (SOL) and Mpeppe (MPEPE) can lead to substantial gains. Now is the time to consider these promising assets and capitalize on their potential.

For more information on the Mpeppe (MPEPE) Presale:
Visit Mpeppe (MPEPE)
Join and become a community member:
Binance Coin (BNB) has recently seen a significant uptick in its price, driven by the bullish momentum surrounding the launch of its opBNB Layer 2 testnet.
The opBNB testnet, built on Optimism’s OP Stack, aims to tackle scalability issues and reduce transaction costs on the BNB Smart Chain. This new development has ignited enthusiasm among investors and developers alike, positioning BNB for a potential breakout.
The opBNB testnet promises high throughput and low gas fees, which are crucial for the seamless operation of decentralized applications (DApps). During its test phase, opBNB handled over 35 million transactions and supported more than 150 DApps, demonstrating its robustness and scalability.
According to the BNB chain official data, the platform achieved a peak of 4,000 transactions per second during stress tests, underscoring its capability to manage high transaction volumes efficiently.

The chart above shows how BNB price has gradually recovered from the turbulent start to the month. On July 5, it sank to a 100-day low at the start of $455. But at the time of writing on July 18, BNB price continues to hover around the $580 level, reflecting a 29% surge from its the monthly time frame low.
Largely, BNB’s price recovery can be attributed the positive shift in the US macroeconomic landscape as well as the investors reaction to the opBNB testnet launch this week.
This latest technological advancement is expected to attract more developers and users to the BNB ecosystem, enhancing its overall utility and value proposition. Additionally, the reduced gas fees and faster transaction times are likely to drive higher adoption rates, contributing to BNB’s bullish outlook. With these developments, BNB could be poised for further gains, reflecting the market’s confidence in its scalability solutions and future growth potential.
In light of these catalysts, analysts and investors are keeping a close watch on BNB’s price movements, anticipating continued positive momentum as the opBNB testnet progresses and eventually transitions to the mainnet. This period of innovation and expansion could well position BNB for sustained growth and increased market dominance for the Binance-issued coin.
Binance Coin (BNB) has seen a substantial rally, climbing 29.15% over the last 13 days to reach $579.20. The price action indicates a strong bullish sentiment, driven by the recent launch of the opBNB Layer 2 testnet, which promises to address scalability and cost issues on the Binance Smart Chain.
In terms of BNB price prediction for the days ahead, technical indicators suggest further upside potential, with the $600 target now within striking distance.
The chart shows that BNB has formed a robust support base around the $500 mark, which coincides with the Parabolic SAR (Stop and Reverse) support level at $489.32. This strong foundation has provided the necessary momentum for BNB to aim for higher targets. The Relative Strength Index (RSI) currently stands at 55.93, indicating that BNB is not yet in overbought territory, leaving room for additional gains.

A breakout above the $600 resistance level could pave the way for BNB to target the next significant resistance at $650. The bullish momentum is further supported by the upward trend in the RSI, which suggests increasing buying pressure. However, strategic traders would certainly keep an out for potential pullbacks, with $550 and $525 levels acting as immediate support zones.
Disclaimer: This content is informational and should not be considered financial advice. The views expressed in this article may include the author’s personal opinions and do not reflect The Crypto Basic’s opinion. Readers are encouraged to do thorough research before making any investment decisions. The Crypto Basic is not responsible for any financial losses.
-Advertisement-
Following a monthly crash to a two-year low of $0.428, Matic quickly rejected the low-price level and bounced back. This led to a two-week increase, which later turned out insignificant due to low buying volume.
During that period, it managed to reclaim some lost grounds but later faced resistance at the $0.57 level this week. A rejection occurred and the price retraced to around $0.53 at the time of writing.
From a technical perspective, Matic currently looks primed for another drawdown. Meanwhile, it is sitting on a weekly support of $0.5.
A dip below this minor support could roll the price back to its two-year low. Losing this low in the process could trigger another collapse, which will likely cause more pain in the market.
If the price increases with a break above the monthly high, we may see a massive surge in the next few days. Matic’s demand currently looks low. The overall market outlook remains bearish weekly. Matic must climb back above $0.8 before one can start to consider a change in the trend.
The price is currently down 2% today. A drop below the weekly low could slide the price to $0.428. A new support may surface at around the $0.32 level (June 2022 low) if a breakdown occurs.
Above the monthly $0.574 high lies the $0.645 resistance. If the surges through all these immediate levels, the next main resistance to keep in mind for a test is $0.77.
Key Resistance Levels: $0.574, $0.645, $0.77.
Key Support Levels: $0.5, $0.428, $0.32.
Disclosure: This is not trading or investment advice. Always do your research before buying any cryptocurrency or investing in any services.
Follow us on Twitter @nulltxnews to stay updated with the latest Crypto, NFT, AI, Cybersecurity, Distributed Computing, and Metaverse news!
Image Source: fellowneko14/123RF // Image Effects by Colorcinch
Also Read: Shiba Inu [SHIB] to Record a Bullish August, Here’s Why
Since 2021, Dogecoin remained on the back foot and prolonged its downward trend even in 2024. It’s currently trading around the $0.13 mark in the indices showing no bullish sentiments. The bearish grip remains strong on DOGE and is not allowing the meme coin to scale up in the charts.
However, a new price prediction indicates that Dogecoin could triple in price and reach $0.39. The forecast is bullish and could change the fortunes of the meme currency if it turns out to be true.
Also Read: Shiba Inu: $1 Weekly Investments Since launch is $6 Million Today

The Finder’s panel of financial experts remains bullish on Dogecoin for 2025. The leading on-chain metrics and financial price prediction firm has forecasted DOGE to hit $0.39 in 2025. That’s another 12 to 18 months from today and is a short period to enjoy a 300% price gain.
Also Read: Here’s When XRP Will Climb Above $1 Again
According to the price estimates, Dogecoin could hit $0.39 sometime in 2025, forecasts Finder. DOGE hitting $0.39 is an uptick and return on investment (ROI) of about 300% from its current price of $0.13. Therefore, an investment of $1,000 could turn into $4,000 if the forecast turns out to be accurate next year in 2025.
However, the cryptocurrency market is extremely volatile and cuts both ways delivering massive losses. There is no guarantee that Dogecoin could spike 300% in the next 12 to 18 months. It is advised to do thorough research and trade at your own risk.
The ongoing SEC lawsuit against Ripple is a critical factor influencing XRP price. The final ruling by Judge Analisa Torres is anticipated by the end of July 2024. Notably, political developments, such as Donald Trump’s statements at the Bitcoin conference, could impact the lawsuit’s outcome. Trump’s promise to replace SEC Chair Gary Gensler if elected might signal a more favorable regulatory environment for Ripple.
Recently, XRP experienced a 757% imbalance between bullish and bearish liquidations. Data from CoinGlass indicated $2.04 million in long position liquidations versus $264,310 in short position liquidations over 24 hours. This unusual pattern could signify a period of stabilization or further fluctuations for XRP. The “sell the news” effect following announcements at the Bitcoin 2024 conference and over-leveraged positions contributed to this imbalance.
XRP’s derivative trading volumes jumped by 44%, reflecting increased market activity and speculation. Despite bearish investors profiting during the price decline, bullish investors faced substantial losses, raising questions about the market’s near-term trajectory.
Interest in XRP has surged due to several positive indicators identified by experts. On-chain metrics reveal mixed signals for XRP. While traders have been taking profits recently, resulting in selling pressure, the number of active addresses has doubled, indicating increased demand and relevance among traders. The Network Realized Profit/Loss metric shows positive spikes, suggesting traders are profiting from their XRP holdings.
Since 2021, Ripple XRP has struggled to reclaim the $1 mark, primarily due to its prolonged legal battle with the SEC. Positive developments in this case have periodically boosted XRP’s price. As we approach Q4 2024, several catalysts suggest that XRP might be ready to soar. These include active accumulation by whales, strong daily performance, and the nearing resolution of the Ripple vs. SEC case.
Whales, or large-scale XRP holders, have been actively accumulating the token throughout 2024. This bulk buying creates bullish momentum, although a massive surge has yet to materialize.
XRP’s daily performance has been noteworthy, with the asset maintaining levels above $0.55 despite bearish market sentiment. Recent gains include a 10.4% increase over the past week, a price surge of 1.62% over the last 7 days, and a 29.16% climb over the previous month.
XRP is likely to collect liquidity in the Fair Value Gap (FVG) between $0.5945 and $0.5783. If XRP bounces off support at $0.5632, it could target the 78.6% Fibonacci retracement level of $0.6666, representing an 11% gain from its current level. The Moving Average Convergence Divergence (MACD) indicator shows green histogram bars, signaling underlying positive momentum.
XRP’s price increased by 0.46% recently, trading at $0.6030. On both hourly and daily charts, XRP is trading within a local channel, indicating ongoing sideways movement. If this trend continues, traders may see consolidation between $0.58 and $0.65 in the coming weeks.
In a positive outlook, if XRP price manages to break out from $0.60 mark, this would push a potential [rice surge to $0.65 next and higher afterward. Yet, in a negative outlook, it could break out from the $0.60 mark to lows of $0.58 and lower.

Ripple (XRP) exhibits several bullish factors that could drive its price higher in 2024. From whale accumulation and strong daily performance to the anticipated resolution of the Ripple vs. SEC lawsuit and the abnormal liquidation imbalance, these elements contribute to an optimistic outlook for XRP. As market conditions evolve, XRP’s price trajectory will be closely watched by investors and analysts alike.
SOL token has done well because of the ongoing ecosystem growth in the network. It has become the top blockchain for developers in the Decentralized Finance (DeFi), Decentralized Public Infrastructure (DePIN), and meme coin industries.
For example, some of the most popular meme coins this year like Dogwifhat (WIF), Bonk, and Book of Meme (BOME) are all built on Solana’s blockchain.
Solana also has a leading role in the DePIN industry as top networks like Helium and Hivemapper have leveraged its technology. These developers love Solana for its speed and low transaction costs.
This trend has led to robust fees in Solana’s ecosystem. Data by DeFi Llama shows that the daily fees have risen this month. On Monday morning, the network had made almost $2 million in the past 24 hours while Ethereum made $2.6 million.
These are significant numbers since Solana has a smaller total value locked (TVL) of $5.4 billion while Ethereum has $58.2 billion. Also, Solana has substantially lower fees than Ethereum, with the average transaction costing just a few cents.
As such, these numbers mean that Solana is seeing more transactions. Indeed, a Polymarket poll found that Solana will likely flip Ethereum in daily fees this month.
The next big catalyst for Solana is that more companies will likely file for spot ETFs now that the Ethereum one has already been approved. VanEck has already filed for a spot ETF while Franklin Templeton has hinted that it will file soon.

The daily chart reveals that Solana token has recovered modestly in the past few weeks. It has risen from the key support level of $121.50, where it failed to move below since April to $190 on Monday.
That is also an important level since it was the upper side of the cup and handle pattern. Also, the 50-day and 100-day moving averages have made a bullish crossover. The Relative Strength Index (RSI) and the MACD indicators have continued rising.
Therefore, the token will likely have a bullish breakout as buyers target the year-to-date high of $210.
Saylor posted alongside his tweet a graphic that depicts Bitcoin’s 21-year price forecast. The graphic compares the Bitcoin price of 2024 and estimates for 2045.
With an estimated current price of $65,000 and a market capitalization of $1.3 trillion, the base case scenario price for Bitcoin was predicted to be $13 million in 2045 with a $3 million bear case and $49 million in a bull case.
In a bear case scenario, Bitcoin market capitalization is expected to reach $68 trillion; $280 trillion in a base case; and $1,030 trillion in a bull case.
At the recent Bitcoin conference, Saylor wowed the crypto community by providing interesting data to back up his prediction that Bitcoin’s qualities as a digital capital may see BTC surpass $13 million per coin by 2045 as adoption develops.
Saylor, a firm believer in Bitcoin, began buying it in 2020 as an inflation hedge and cash alternative.
Saylor’s company, MicroStrategy, is one of the world’s largest public Bitcoin holders. As of June 20, it possessed a total of 226,331 BTC purchased for around $8.33 billion at an average price of $36,798.
In the past week, asset manager VanEck, an issuer of spot Bitcoin and ETFs, wowed the crypto community with its astonishing Bitcoin price prediction.VanEck predicted that BTC’s price may reach $2.9 million by 2050 if some significant hurdles are surmounted. The asset manager also predicted that Bitcoin may settle 10% of international trade and 5% of domestic trade gains by 2050, with central banks holding it as a reserve asset.
Meanwhile, the short-term sentiment remains optimistic howbeit cautious. According to Santiment, Bitcoin’s recent price rebound has shifted traders’ sentiment to levels not seen in 16 months. “Bitcoin’s +20% 3-week price rally has left traders feeling a whole lot more bullish than they were at the beginning of the month,” Santiment wrote.
Bitcoin was down 0.83% in the last 24 hours to $67,489 at press time, according to CoinMarketCap data.


 – Matic Continues To Struggle Amid Market Recovery, Looks Set For Another Dip")

 Price Prediction Stuns Crypto Community By U.Today")