The main tag of cryptocurrency price today Articles.
You can use the search box below to find what you need.
[wd_asp id=1]
The main tag of cryptocurrency price today Articles.
You can use the search box below to find what you need.
[wd_asp id=1]
The Ethereum price action is trending below the 21-day, 50-day, and 200-day simple moving averages (SMA), while the relative strength index (RSI) is at 39 and rising. This indicates that bullish momentum is building on the Ethereum asset. The RSI also aligns with the chaikin money flow (CMF), which is at -0.05 and headed upwards. These two oscillating indicators signal that ETH price may be inbound for more upside.
Ethereum price prediction shows the asset has bullish tendencies as the price action trailed back into the falling channel. A resistance barrier exists around the $3,300 level that, if broken, may catapult the price of ETH to $3,950.
Ethereum price has formed a double bottom against Solana, with 5.16% gains remaining until the market structure is completed.
On the other hand,
Solana price is trending inside an ascending triangle in the 4-hour time frame and is currently at the bottom trendline. The asset is also trending below the 21-day, 50-day, and 200-day SMAs, which is not bullish. The 200-day SMA currently offers a resistance of around $143, which coincides with the horizontal resistance line of the ascending triangle. If the price of SOL breaks above the ascending triangle, it may surge 18% to $172. On the flip side, if bears prevail, the asset may find lower support around $121. The SOL RSI is trending at 41.61 and headed down, which shows increasing bearish momentum.
Nevertheless, the asset is at a crucial point against ETH price, where a bounce back could result in 15.74% gains.
Nate Geraci, president of ETF Store, shared Roxanna Islam’s prediction that more Solana ETF applications may be filed if the ETH ETF is confirmed. Cboe’s 19b-4 filings for VanEck & 21Shares already hint at the industry’s readiness.
Ethereum price action suggests a potential increase, targeting $3,950 if it can break through the $3,300 resistance level. Meanwhile, Solana price trades within an ascending triangle pattern but shows increasing bearish momentum with its downward RSI. The price of Solana could either surge to $172 if it breaks above the pattern or find support around $121 if bearish trends continue.
Related Articles
Ethereum’s price has decreased slightly but shows potential for bullish momentum. If it can break through the $3,300 resistance, it could reach a target of $3,950.
Solana is currently navigating critical support and resistance levels within an ascending triangle pattern. It could potentially surge to $172 if it breaks above the pattern or drop to $121 if bearish trends continue.
ETF rumors have a significant influence on the market. More Solana ETF applications may be filed if an ETH ETF is confirmed, potentially impacting both cryptocurrencies’ market dynamics and price movements.
However, with the recent XRP price recovery along with the increasing chances of market recovery, the altcoin is ready for a bull run. Will the bullish trend reach $1? For a longer-term prediction, check out our XRP price prediction.
Reversing from the $0.7221 mark, the declining trend in the XRP price action reveals a falling wedge pattern in the daily chart. Further, the downfall fuels the death cross in the 50D and 200D EMA.
Dropping below $0.50, the altcoin finds support at a declining trendline near the $0.4183 mark. With a new recovery rally, the altcoin is up by 10% in five days and challenges the overhead trendline.
Currently, the XRP price trades at $0.4672, with an intraday rise of 4.07%, creating the fifth consecutive bullish candle. The altcoin shows massive upside potential by using a wedge breakout with a rounding bottom reversal.
Technical Indicator:
EMA: With a bullish comeback, the XRP token challenges the 50D EMA, as the average line declines after the deathcross.
RSI: The daily RSI line shows a quick reversal from the oversold boundary, reflecting a massive surge in demand for the XRP token.
As the bullish reversal in the XRP price gains momentum, the sideline traders are anticipating a breakout rally. With the wedge breakout, the altcoin could challenge the 200D EMA at $0.53.
Further, as per the wedge pattern, the Ripple token price could hit the peak of $0.72. Considering that altcoin finds the support of the broader crypto market recovery, the uptrend in XRP could hit the $1 psychological mark.
The analyst also stressed the importance of traditional markets, such as equities, in influencing the performance of altcoins like XRP. Historical data suggests that for altcoins to perform well, traditional markets need to experience major movements. Here’s a breakdown of his latest analysis:
XRP Bollinger Bands Analysis:
Bollinger Bands are a technical analysis tool that measures market volatility. The bands are tightening for XRP on a monthly time frame, which historically indicates a significant price movement is imminent. Previous instances of such tight squeezes in Bollinger Bands have led to massive price rallies for XRP.
Tightening Bollinger Bands indicate low volatility and a consolidation phase, which often leads to a significant breakout. This breakout could be either upward or downward, but considering the broader market context, an upward movement is anticipated.
The last similar event occurred in February 2017, when XRP was priced at half a penny. Following that squeeze, XRP experienced a major price increase.
Market Sentiment and Historical Context:
Despite current bearish sentiments and a market downturn, these conditions often precede significant upward movements in XRP’s price. XRP has recently dropped 40% from its yearly high of 74 cents, influenced by broader market trends and events like Bitcoin’s crash and selling pressure from specific entities.
Conclusion:
He said that the market had an explosive rally, reaching XRP’s all-time high of $3.31 in January 2018, which was a 5932.5% increase in one year. As the Bollinger Bands show a similar pattern now, analysts expect another big surge. He agrees with this outlook but won’t predict exact prices and believes the market has a history of strong growth and could continue this trend as it expands.
Bulls are trying to come back to the game, according to CoinStats.BTC chart by CoinStats
The rate of Bitcoin ![]() BTCUSD has risen by 2.23% over the past 24 hours.Image by TradingView
BTCUSD has risen by 2.23% over the past 24 hours.Image by TradingView
On the hourly chart, the price of BTC might have set a local resistance level of $59,516. As most of the daily ATR has been passed, there are low chances to expect any sharp moves by the end of the day.
However, if the bar closes near $59,500, the ongoing upward move may continue tomorrow.Image by TradingView
A similar picture can be seen on the bigger time frame. Buyers are trying to seize the initiative after yesterday’s bearish closure. If they manage to do that, traders may witness a test of the vital mark of $60,000 shortly.Image by TradingView
On the weekly chart, it is too early to think about a quick reversal as the price of BTC has not accumulated enough energy yet. In this case, sideways trading between $57,000 and $60,000 is the more likely scenario.
Bitcoin is trading at $59,027 at press time.
An interesting situation has formed on the price chart of Cardano (ADA), drawing the attention of keen market observers. Over the last four months, Cardano’s price has been on a relentless decline.
However, it has now arrived at a crucial support level, historically significant in its pricing trajectory. The $0.35 mark per ADA is particularly noteworthy, as it was the price point where Cardano’s value surged following its 2018 listing on Binance, the world’s largest exchange. This level has consistently served as a pivotal support or resistance point for ADA.
Recently, this support level has proven its strength once again. After a 12% drop last week, Cardano’s price held firm at $0.35. Following this stabilization, the weekly candle closed above this mark, leading to an epic 15.3% increase in ADA’s price over the next four days.
What makes this rise even more intriguing is that it occurred on relatively low trading volumes. Despite being the 10th largest token by market capitalization, Cardano’s trading turnover places it only in 17th place.
While trading activity for ADA is currently subdued and market participants’ attention is diverted elsewhere, the token is quietly experiencing its own mini bull rally.
This pattern suggests a potential ultra-bullish trend for Cardano that has gone largely unnoticed. As ADA holds strong at this crucial support level and begins to climb, investors may find renewed interest in this “dino” coin. The low trading volumes accompanying the price rise could signal significant upside potential if the attention of market participants shifts toward Cardano.
In conclusion, while Cardano’s recent price action might be flying under the radar, the formation of this bullish pattern presents an intriguing opportunity for attentive investors.
About the author
Gamza Khanzadaev
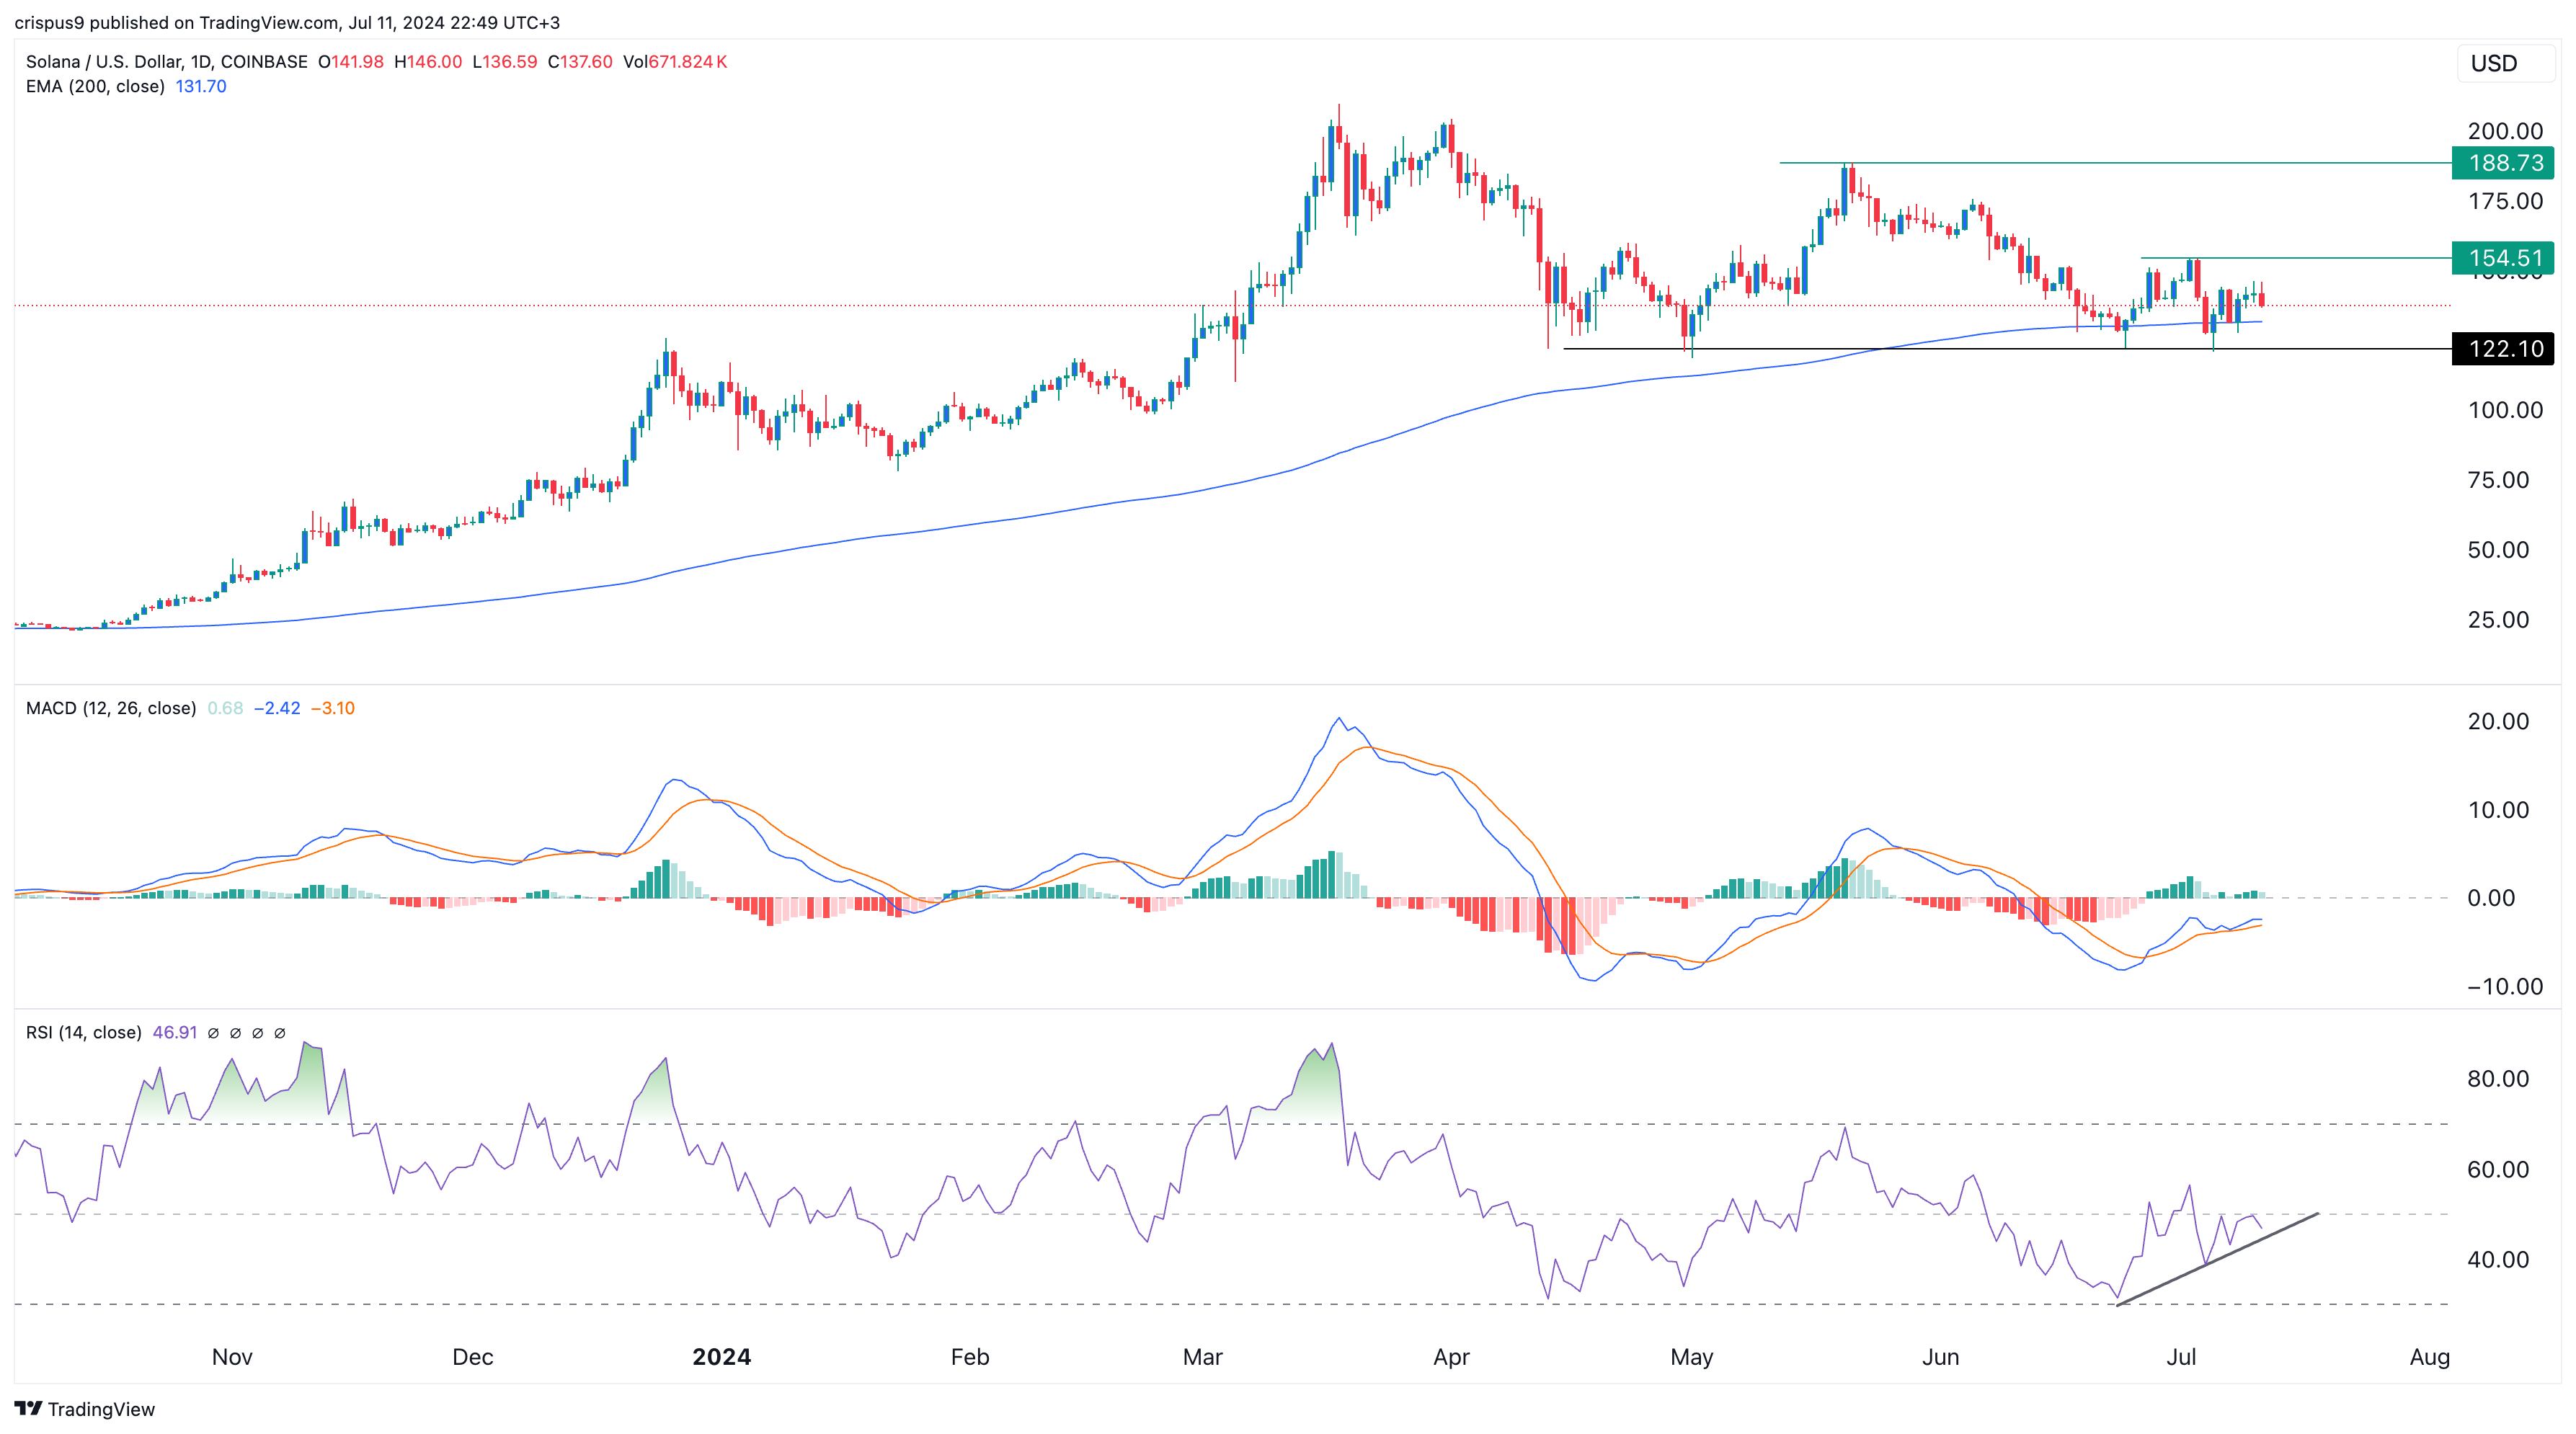
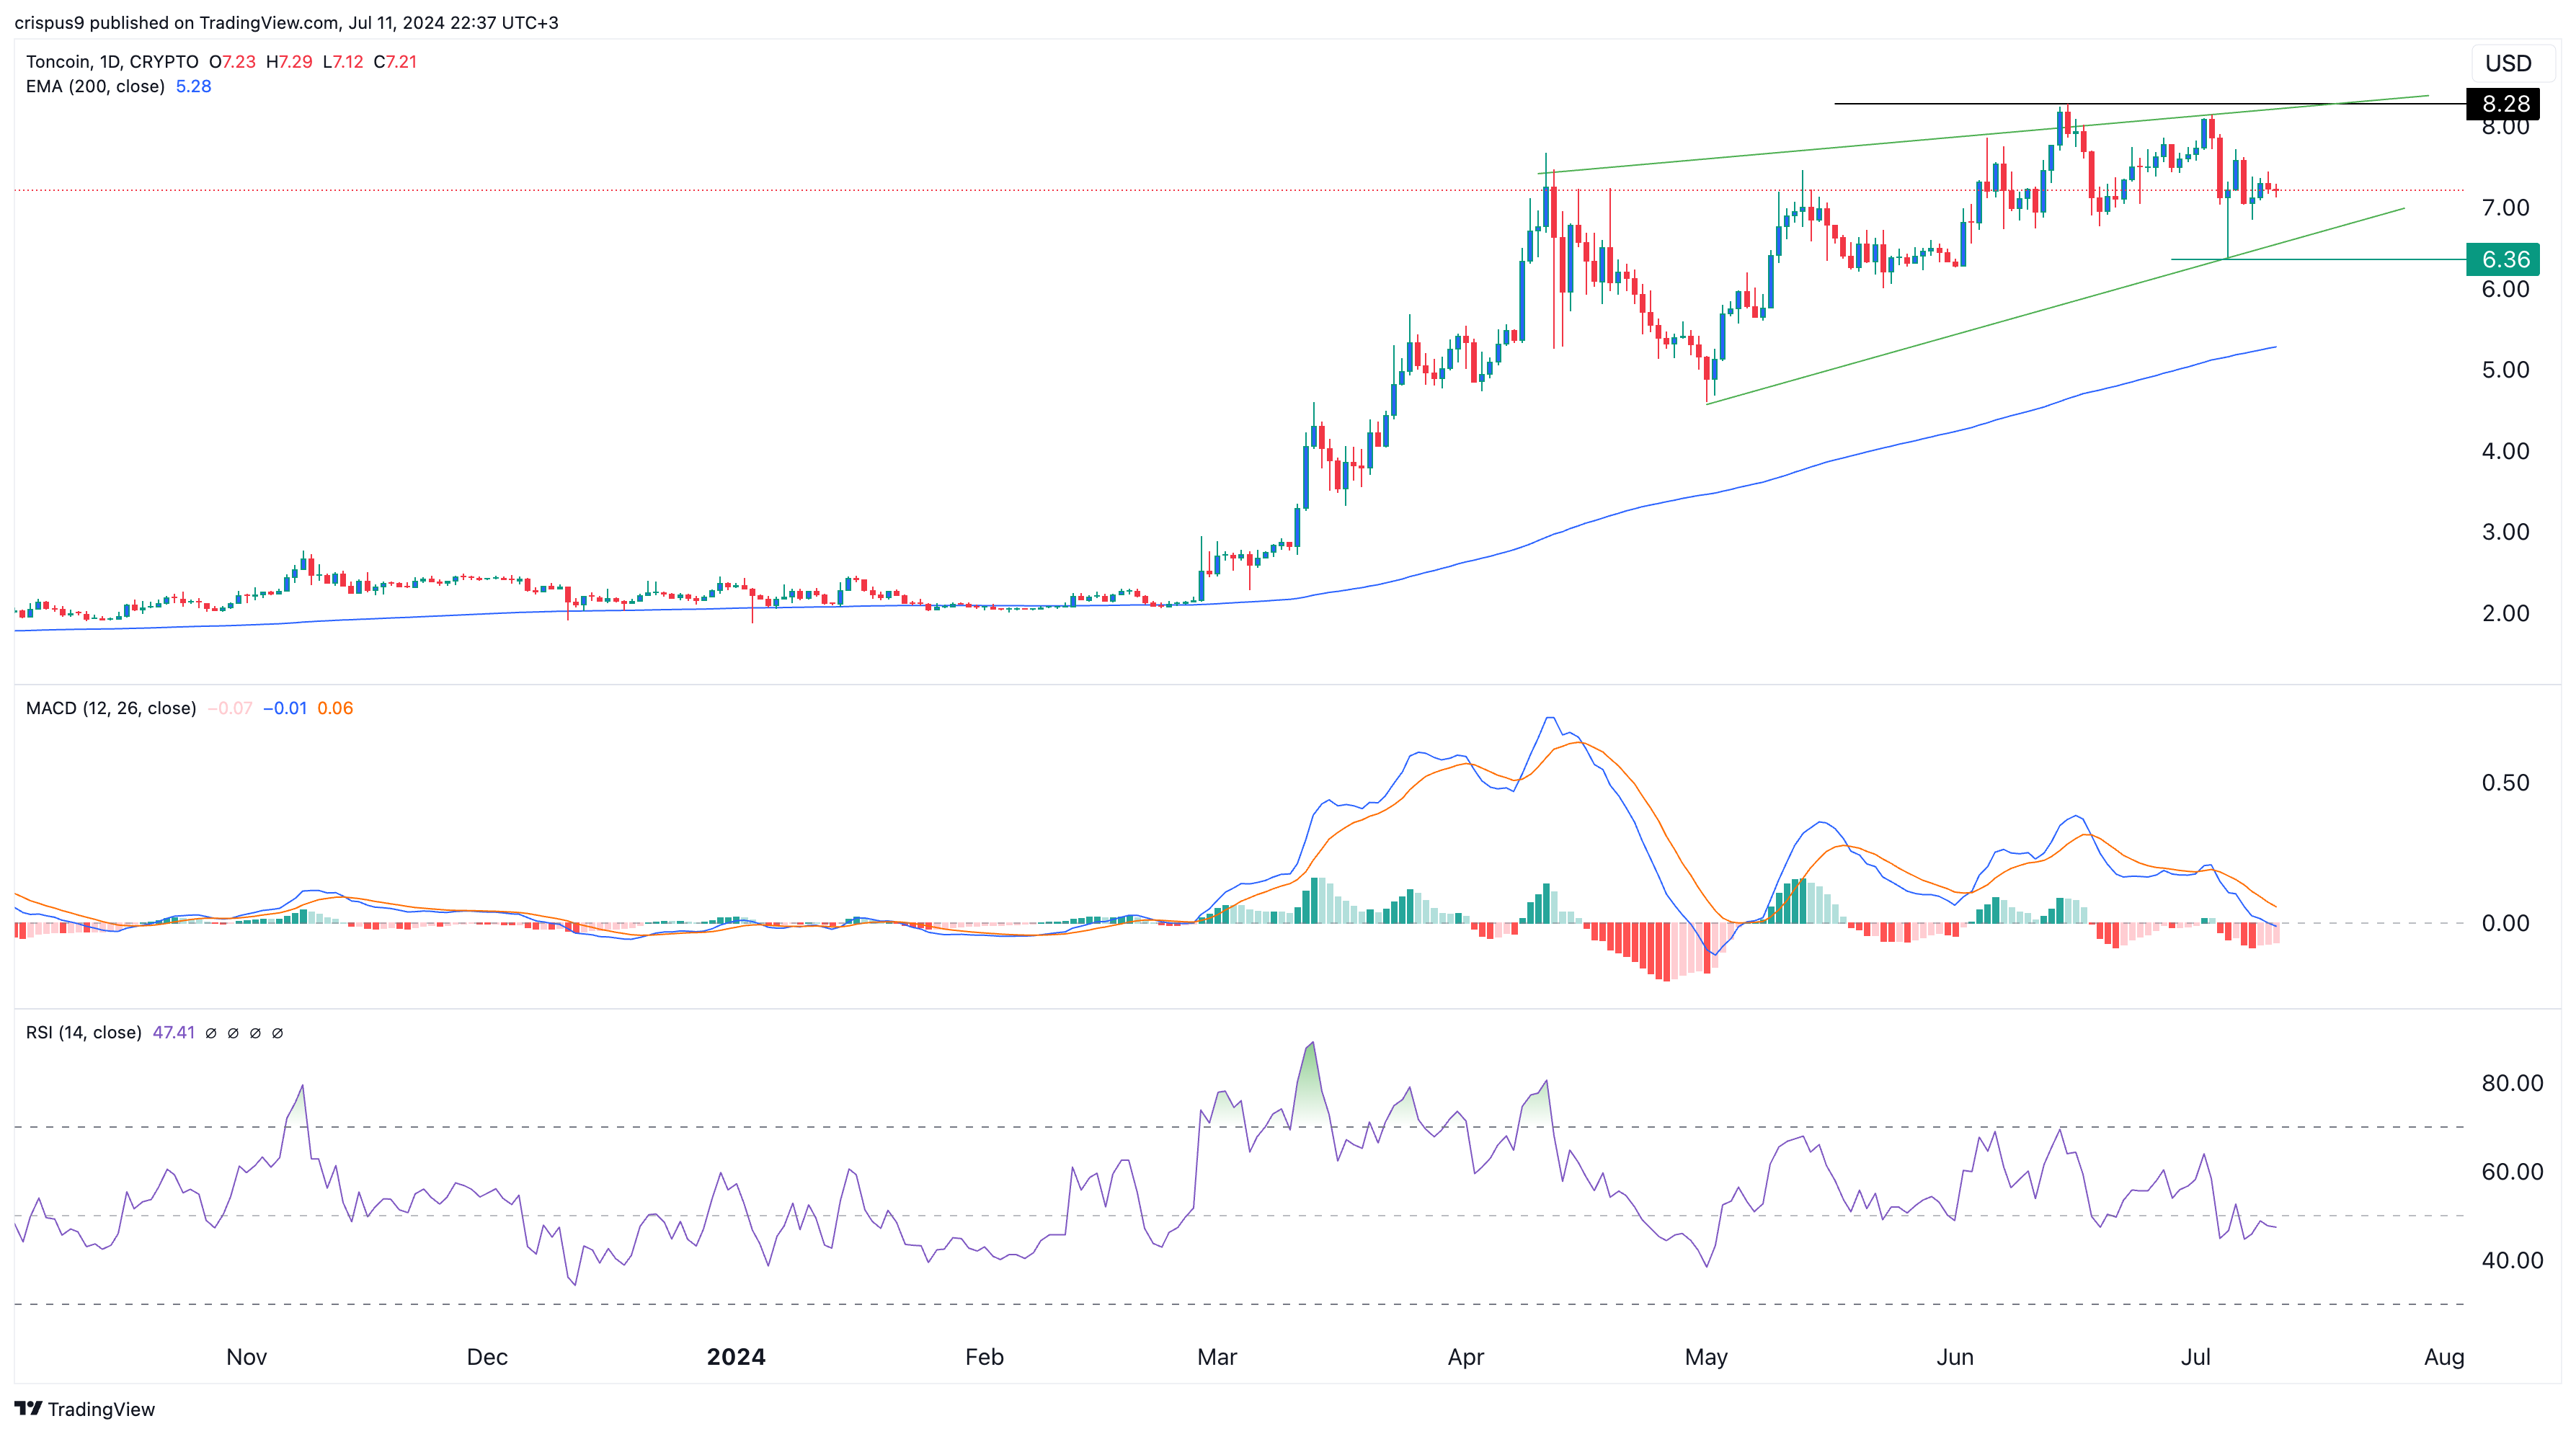
Cryptocurrencies had a relatively strong performance this week as Bitcoin bounced back to almost $60,000. Toncoin was trading at $7.23, a few points below its highest point this year while Solana rose to $146, up from this month’s low of $121.
These coins rose as investors bought the dip and as the impact of the ongoing liquidations by the German government and Mt. Gox wallets. They also recovered after the US published an encouraging inflation report that revealed that consumer prices were falling.
Another positive event that happened was that Solciety, an upcoming Solana meme coin, raised over $863k from investors in less than two weeks. You can buy the SLCTY token here.
Solana price bottomed at $122.10, where it failed to move below since May this year. It then bounced back and was trading at $140 on Thursday evening.
On the daily chart, the token has formed a double-bottom pattern whose neckline was at $188.73. In price action analysis, a double bottom is one of the most bullish chart patterns.
It has also formed a small double-bottom pattern whose neckline is at $154. At the same time, the token has found substantial support at the 200-day Exponential Moving Average (EMA), which is a popular bullish sign.
The MACD and the Relative Strength Index (RSI) indicators have also formed bullish divergence patterns. Therefore, the likely scenario is that Solana will resume the bullish trend in the near term.
If this happens, the next key level to watch will be the key resistance point at $155. A break above that level will see it rising to the next psychological point at $160.
Toncoin has been one of the top-performing cryptocurrencies this year as the TON ecosystem continues doing well. The $TON price dropped to a low of $6.36 last Friday as other cryptocurrencies fell. That was an important level since it coincided with the lower side of the ascending channel.
There are signs that TON price could soon make a bearish breakout. It has formed a rising wedge pattern, a popular bearish sign. Unlike Solana, the MACD and the Relative Strength Indicator (RSI) have formed a bearish divergence pattern.
Therefore, with the rising wedge nearing a confluence level, there is a likelihood that the $TON token will have a bearish breakout in the coming weeks.
Unlike Toncoin and Solana, Solciety is not yet publicly traded. Instead, it is a political neutral cryptocurrency currently in its presale event. Launched earlier this month, the sale has raised over $870k and the trend is gaining momentum.
Solciety aims to be at the intersection of non-fungible tokens (NFT), meme culture, and Solana meme coins. Recently, Solana’s ecosystem has produced some of the top meme coins like Book of Meme (BOME) and Dogwifhat.
It also aims to become the best political meme coins in the industry. Unlike Donald Tremp and Jeo Boden, Solciety will not be affiliated in either of the political space. As the US election nears, people supporting either candidate will feel comfortable investing in the SLCTY token.
A key feature of Solciety is its meme generator feature where users will be able to create political memes with over 200 traits, backgrounds, and fonts.Users can make some money in SLCTY tokens by creating and sharing these meme coins.
As the network grows, the developers will introduce augmented reality features that will help users view their meme coins well. You can read more about Solciety and its tokenomics here.
Some coins from the top 10 list are bouncing off, according to CoinMarketCap.
The price of DOGE has increased by 0.36% over the last 24 hours.
If the bar closes above it and with no long wick, growth may lead to the test of the $0.1140 zone until the end of the week.
DOGE is trading at $0.1109 at press time.
About the author
Denys Serhiichuk
Over the last 24 hours, the price of XRP has increased by 3.5%, indicating a strong recovery in the larger cryptocurrency market.
This increase in value corresponds with a recovery that started on July 8 and was driven by institutional investments after a decline that was sparked by problems with Mt. Gox.
A platform that manages digital assets, CoinShares, reports that the recovery is in line with large inflows into cryptocurrency funds, totaling $441 million, during a week that saw an 11.28% decline in the value of bitcoin.
Specifically, during the week ending on July 5, investment funds that prioritize XRP attracted $400,000 in capital. Since this story was published on July 8, the trading pair XRP/USD has increased by about 10%.
According to James Butterfill, a researcher at CoinShares, investors saw the recent market decline—which was sparked by Mt. Gox’s actions and the German government’s sales—as a favorable time to buy.
The spike in interest in XRP and kindred cryptocurrency funds corresponds with heightened speculation on Wall Street regarding a potential Federal Reserve rate decrease in September.
This theory was prompted by the July 5 employment report, which was poorer than anticipated and eventually had an impact on market movements. Since its bottom on July 5, the spot market for XRP has recovered impressively, with returns of almost 16%.
This opinion was further supported on July 10 by Jerome Powell, the US Federal Reserve Chairman, who gave a dovish perspective and hinted at a cautious approach to future rate hikes during his appearance before Congress.
Technically speaking, XRP’s recent increases also align with a surge in holdings among its biggest investors, referred to as “whales” informally. In the past day, there has been a discernible increase in the quantity of XRP owned by organizations with 100 million to one billion tokens.
On the other hand, ownership in the range of 10 million to 100 million tokens decreased. In the meantime, ownership by organizations possessing more than one billion tokens have stayed steady, suggesting that smaller investors may be strategically accumulating XRP in order to advance into more lucrative investing categories.
In addition to a technical market correction, this strategic accumulation is taking place as XRP has recovered from a “oversold” situation. This phrase describes a situation in which an asset’s relative strength index (RSI) falls below 30, frequently leading to a comeback.
Furthermore, the price recovery for XRP is following a pattern that resembles movements seen in April as it tests the lower limit of its dominant falling wedge formation as a support line.
The next anticipated objective for XRP in July, if this pattern continues, may be close to the wedge’s upper limit, at roughly $0.45, which would indicate a 5% increase from the stock’s current price.
The US market for cryptocurrencies is also keeping a careful eye on events since political developments there have the potential to greatly influence future legislation pertaining to cryptocurrencies.
Amidst these happenings, XRP has attracted a lot of attention, especially because of a conversation that could affect its market and regulatory standing.
U.S. Representative Ro Khanna is organizing a roundtable discussion on cryptocurrency in Washington, D.C., where guests include Mark Cuban and representatives from the White House.
With the potential to influence the regulatory environment, this meeting seeks to address important concerns in the cryptocurrency industry.
Brad Garlinghouse’s expected analysis of the Ripple v. SEC case is a major topic of interest because it will probably affect the direction of XRP’s pricing and how regulators view it.
With a passing reference to Bitcoin’s place in the larger cryptocurrency conversation, the attendance of celebrities such as Anthony Scaramucci at these talks serves to highlight the industry as a whole.
The current state of the market and significant institutional investment have given XRP the appearance of a potentially lucrative asset. The asset shows strong indications of a bullish trend, with $400,000 moving into funds that track XRP early in July and a robust 3.5% jump in just one day.
Recoveries in other markets and speculation of a potential rate cut by the Federal Reserve support this increase, suggesting a favorable economic environment for XRP’s growth.
In addition, forthcoming regulatory talks in the United States, namely a cryptocurrency roundtable featuring prominent figures in the sector such as Ripple CEO Brad Garlinghouse and Mark Cuban, have the potential to elucidate and constructively mold the regulatory environment surrounding XRP.
These elements, along with a technical recovery from a “oversold” state, make XRP an appealing choice for investors hoping to profit from the peculiarities of the cryptocurrency market.
With the market struggling to sustain momentum, Solana’s price continues to hover close to its $150 psychological mark. Further, the increasing volatility in the overall market warns of sharp moves in the SOL price trend.
However, Solana is ready for a boost if the bullish trend regains momentum with the network growth. Further, with the overall market recovery trend anticipating an altcoin season, the SOL price is setting its eye near $500 in 2024.
Under such market conditions, the crypto investors are wondering about “Is Solana going to go up?” or “How high can Solana go?”
Well, to answer such questions, we bring to you our Solana price prediction for 2023-2030. We’ll address these questions using our various analyses, market sentiments, and regular updates in the crypto world.
| Cryptocurrency | Solana |
| Token | |
| Price | |
| Market Cap | |
| Trading Volume | |
| Circulating Supply | |
| All-time High | $260.06 Nov 07, 2021 |
| All-time Low | $0.5052 May 12, 2020 |
| 24 High | |
| 24 Low |
With the ongoing bearish price action in the cryptocurrency market, the SOL price has recorded a jump of over 1% with a trading volume of $2.060 Billion, a change of -34.76%. Moreover, the Solana crypto has dropped 0.42% within the past seven days and has plunged 10.24% over the past 30 days.
The technical indicators, SMA and RSI record a rising bullish sentiment in the 1D time frame. This highlights a high possibility of a bullish reversal for this altcoin during the upcoming weeks.
If the market regains momentum, the bulls will prepare the Solana price to head toward its upper resistance level of $181.50 during the upcoming weeks. However, bearish price action could pull the SOL coin price toward its low of $127 this month.
| Solana Price Prediction | Potential Low ($) | Average Price ($) | Potential High ($) |
| July 2024 | $127 | $155.75 | $181.50 |
Overall, the 2023 year has been positive for the Solana coin price. Despite the frequent hiccups, the Solana coin price has grown 27,802.58% since its all-time low (ATL).
With the completion of the Bitcoin Halving event in April 2024, Solana coin price is expected to boom in the coming month. Moreover, with the high chances of an altcoin season coming along, the bull run chances improve significantly.
If the uptrend sustains, the bullish trend in Solana coin price can end the year on a high note. SOL prices and other altcoins demonstrate remarkable resilience. Further, Solana’s prices have continued to rise, defying bearish expectations and showcasing the underlying bullish confidence.
If Solana manages to sail across the challenges of the crypto-verse while fixing the consensus issues. Continuing on the progressive road, the SOL coin prices can end in 2024 at a high of $500.
On the flip side, if the sentiments fail to improve, the altcoin could settle at $90.
| Solana Price Prediction | Potential Low ($) | Average Price ($) | Potential High ($) |
| Solana price prediction 2024 | $90 | $145 | $500 |
If Solana encourages newer upcoming startups, it could be a new competitor for other cryptocurrencies in the market. Also, in the coming years, if Solana outgrows Ethereum, it might bang at significant highs. On this note, the SOL price may strike its maximum at $750.
New regulations in the future can afflict the price movements, and thereby, a possible low is set for the SOL coin price. If this happens, then a slight pullback can draw Solana to $209.91 by the end of 2025. Considering the bullish and bearish targets, the average price might land at $579.95.
| Solana Price Prediction | Potential Low ($) | Average Price ($) | Potential High ($) |
| 2025 | 209.91 | 579.95 | 750 |
| Solana Price Prediction | Potential Low ($) | Average Price ($) | Potential High ($) |
| 2026 | 357.68 | 624.315 | 886.35 |
| 2027 | 480.61 | 761.615 | 942.61 |
| 2028 | 645.67 | 888.335 | 1,076.84 |
| 2029 | 808.54 | 1,156.305 | 1,224.97 |
| 2030 | 987.9 | 1,359.165 | 1,672.15 |
By the Solana Price Prediction 2026, the potential low price for SOL is $357.68, with an average price projected at $624.315 and a potential high of $886.35.
Moving on to Solana Price Prediction 2027, the potential low price for SOL is estimated at $480.61, while the average price is predicted to be around $761.615. The potential high price for SOL in 2027 is projected to reach $942.61.
As per the Solana Price Prediction 2028, the potential low price for SOL is expected to be $645.67, with an average price of $888.335. Further, the potential high price for SOL during this year is projected to reach $1,076.84.
Looking ahead to 2029, the Solana Price Prediction forecasts a potential low of $808.54, with an average price of $1,156.305. Moreover, the potential high price for SOL in 2029 can reach $1,224.97.
Finally, by the year 2030, Solana Price Prediction estimates a potential low at $987.9, with an average price of $1,359.165. The potential high price for Solana in 2030 is projected to reach $1,672.15.
| Solana Price Prediction | 2024 | 2025 |
| Gov Capital | $212.19 | $227 |
| DigitalCoinPrice | $63.11 | $92.62 |
| Long Forecast | $36.83 | $22.19 |
Raoul Pal, founder of Real Vision, predicts a potential 20x rally for Solana. He attributes this to Solana’s advanced blockchain technology, growing ecosystem, and rising investor interest.
If Pal’s prediction holds, Solana’s price could exceed $400 in the coming months, a significant surge from its previous peak. Despite market trends, Solana has shown resilience, maintaining a strong performance with consistent buying pressure.
With the improving network conditions of Solana and the slow but steady rise in the DeFi sector, the SOL prices project a bullish future.
According to CoinPedia’s formulated SOL price prediction, the price might surge to $500 in 2024. On the flip side, a failure to sustain recovery will plunge Solana prices to $90 by the end of 2024.
We expect the SOL coin price to reach $500 by the end of 2024.
| Solana Price Prediction | Potential Low ($) | Average Price ($) | Potential High ($) |
| 2024 | $90 | $170 | $500 |
Also, Read Coinpedia’s Price Analysis with the latest content on the recent market trend that enables you to get closer to the price movements & actions of the various cryptocurrencies.
Solana with its strengths in fundamentals still holds significant prominence. That said, we can expect its glory to shine brighter with resolutions to shortcomings.
The digital asset could surge as high as $500 by the end of 2024.
Solana holds the potential to climb higher on the market cap rankings. The digital asset could make it to the target if it does not fall to negative criticism.
According to our Solana price prediction, the altcoin might chug up to a maximum of $750 by the end of 2025. Further, with a potential surge, the price of SOL could reach a maximum of $1672 by the end of 2030.
The Solana Foundation is dedicated to growing the Solana network into the world’s most decentralized and censorship-resistant blockchain.
At the time of writing, the value of one SOL coin price was $143.21.
The rates of most of the coins have returned to the red zone, according to CoinMarketCap.
The price of XRP has remained the same since yesterday.
In this case, ongoing sideways trading in the narrow range of $0.43-$0.44 is the more likely scenario.
XRP is trading at $0.4355 at press time.
About the author
Denys Serhiichuk


 Price Prediction July 2024")


