The main tag of cryptocurrency price today Articles.
You can use the search box below to find what you need.
[wd_asp id=1]
The main tag of cryptocurrency price today Articles.
You can use the search box below to find what you need.
[wd_asp id=1]
XRP price recently broke out to the downside from a falling wedge, a pattern that typically has a low probability of occurring. However, when it does happen, it often results in aggressive price movements. XRP’s price dropped to a low of $0.382 before rebounding. Following this breakout, the price action appears to be forming a bearish pennant, which is a continuation pattern indicating a potential further decline.
The price action of XRP is trending below the 21-day, 50-day, and 200-day simple moving averages (SMAs) which act as resistance levels for the asset. If the bear pennant resolves to the downside, the XRP price may drop 17% to $0.35 with occasional support around $0.371. On the flip side, if the bulls prevail, the asset’s price may rise back into the falling wedge in an attempt to test $0.55. Potential resistance levels include $0.45, $0.47, and $0.48.
BTC price on the other hand found some reprieve around $55,000 – $58,000 level. Similar to the XRP price, Bitcoin seems to also be forming a bearish continuation pattern – a bear flag. If this market structure resolves to the downside (as it is likely to do), Bitcoin price may drop further beyond the $50,000 weak support to $47,000. The latter coincides with a zone of market imbalance (orange) that must be filled if the price is to move higher.
On the flip side, if the BTC price rises higher, it may invalidate the bear flag and if it breaks past $60,000, may trigger further upside movement beyond the 200-day SMA to $67,200.
Speculation of the end of the Ripple-SEC lawsuit floods the cryptoX space as market participants anticipate a final decision by July 31. July 26 is the deadline to file a notice related to the exclusion of experts’ testimony
Bitcoin price recovery happens amid massive whale movements in the crypto space.
Despite the recent bounce in price, Germany continues to dump its BTC holding. As of July 9, it remained with 22,800 BTC, which constitutes less than half its original holdings.
Despite positive market sentiment, XRP’s price continues to face challenges. This divergence between market expectations and actual performance signals a complex dynamic affecting XRP. It suggests that factors beyond general optimism may be influencing XRP price.
Related Articles
According to rumors, Judge Torres is expected to make his final decision by the end of July, concluding the case.
The current chairman of the U.S. Securities and Exchange Commission (SEC) is Gary Gensler. He has been serving as chairman since April 2021.
A bear flag is a technical chart pattern in trading that indicates a potential continuation of a downward trend.
The entire crypto market witnessed much volatility over the last week, and XRP was one of them as its value dipped.
However, the last 24 hours were in investors’ interest as the token’s chart finally turned green. Let’s have a closer look at the token’s state to predict XRP’s price action.
CoinMarketCap’s data revealed that XRP’s price dropped by more than 9% in the last seven days. However, the bears lost their hold in the market as the token’s price moved up marginally in the last 24 hours.
At the time of writing, XRP was trading at $0.4359 with a market capitalization of over $24.2 billion.
AMBCrypto’s analysis of Santiment’s data revealed that while the token’s price remained low, investors chose to accumulate more tokens. This was evident from the drop in its supply on exchanges.

Source: Santiment
Additionally, whale activity around the token also remained high throughout the last week, as its number of whale transactions increased. While the token’s price gained a slight bullish momentum, its trading volume also increased, acting as a foundation for a future rally.
Apart from this, the token’s network growth remained high, meaning that more new addresses were created to transfer the token.
However, XRP’s NVT ratio registered an uptick after a drop. Generally, a rise in the metric means that an asset is overvalued, which hints at a price correction.
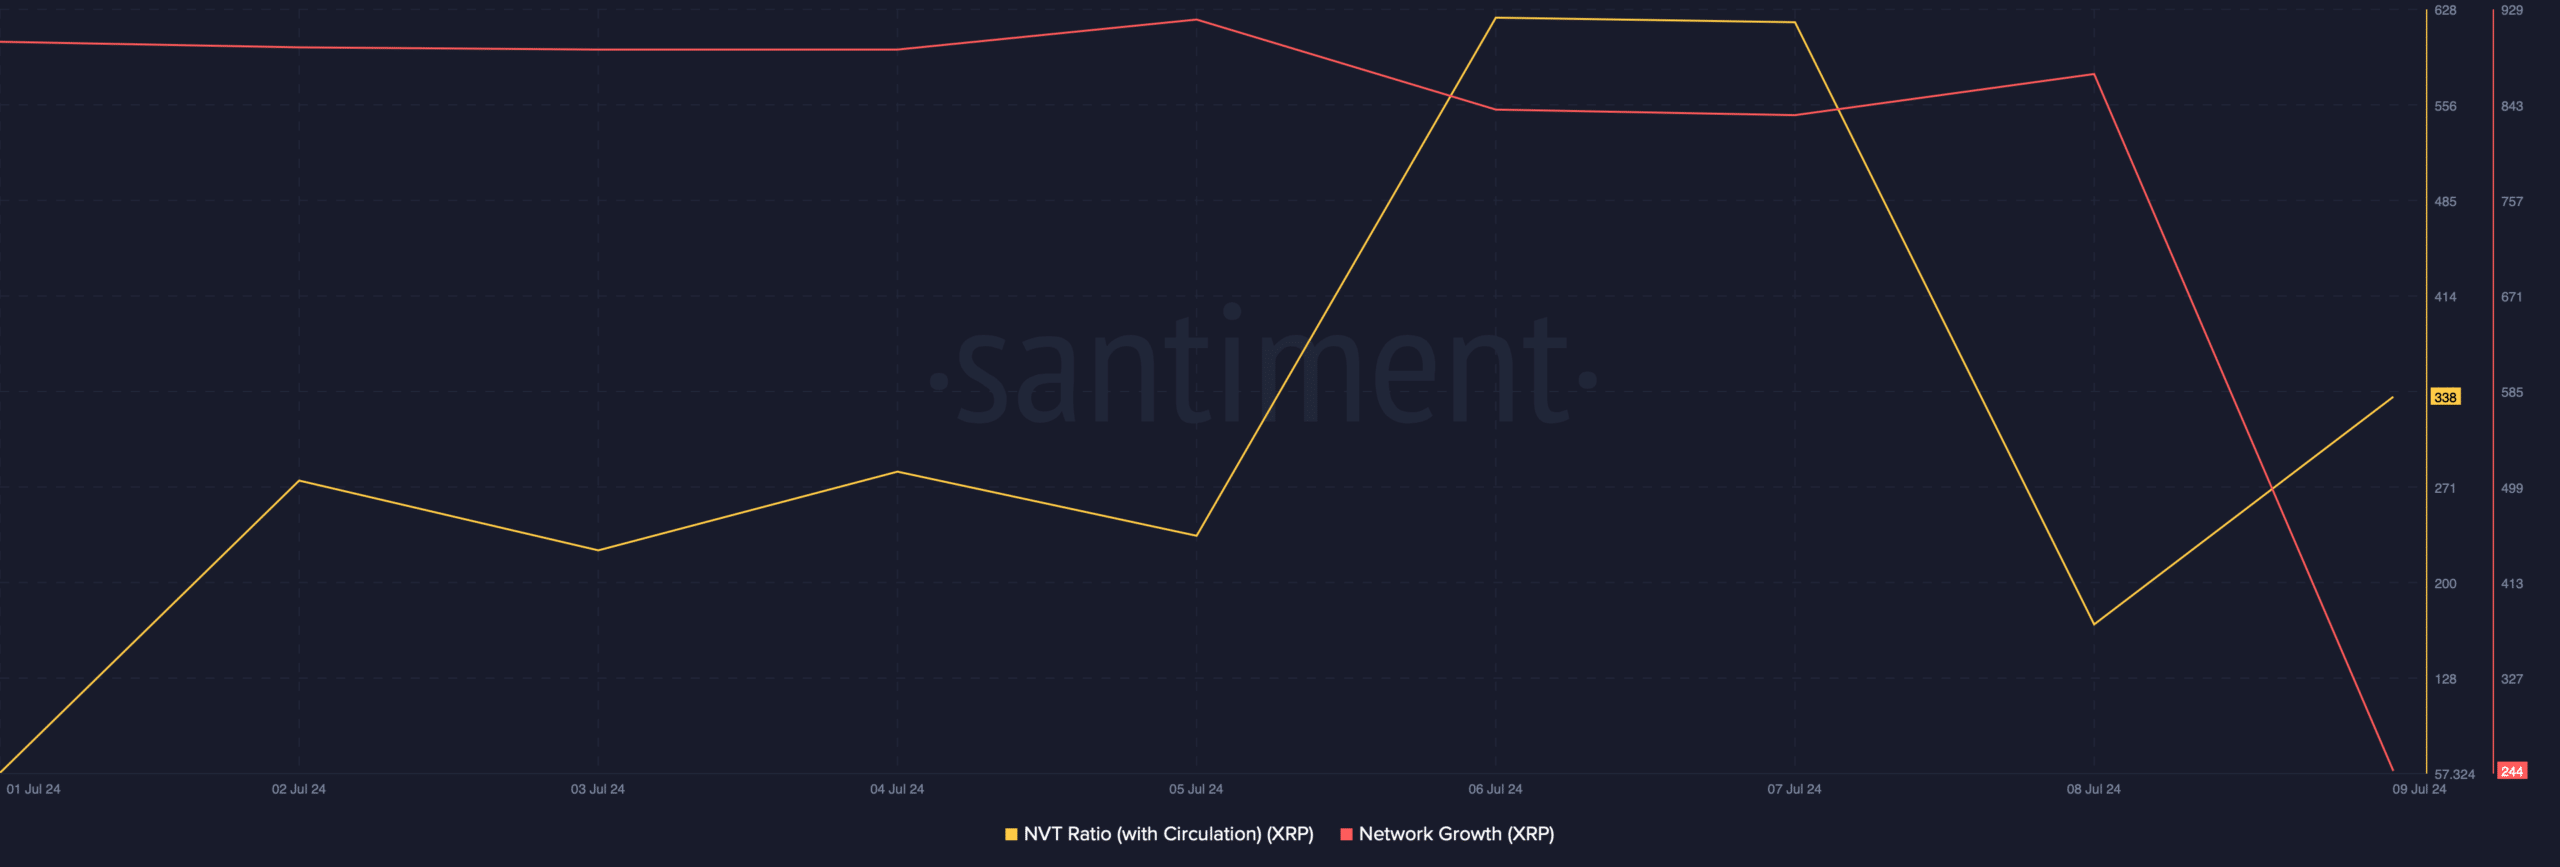
Source: Santiment
AMBCrypto then analyzed XRP’s daily chart to see whether a price uptick was possible. We found that the token’s price had touched the lower limit of the Bollinger Bands, which often results in price upticks.
The Relative Strength Index (RSI) registered an uptick. On top of that, the Chaikin Money Flow (CMF) also followed a similar increasing trend, hinting at a price increase soon.
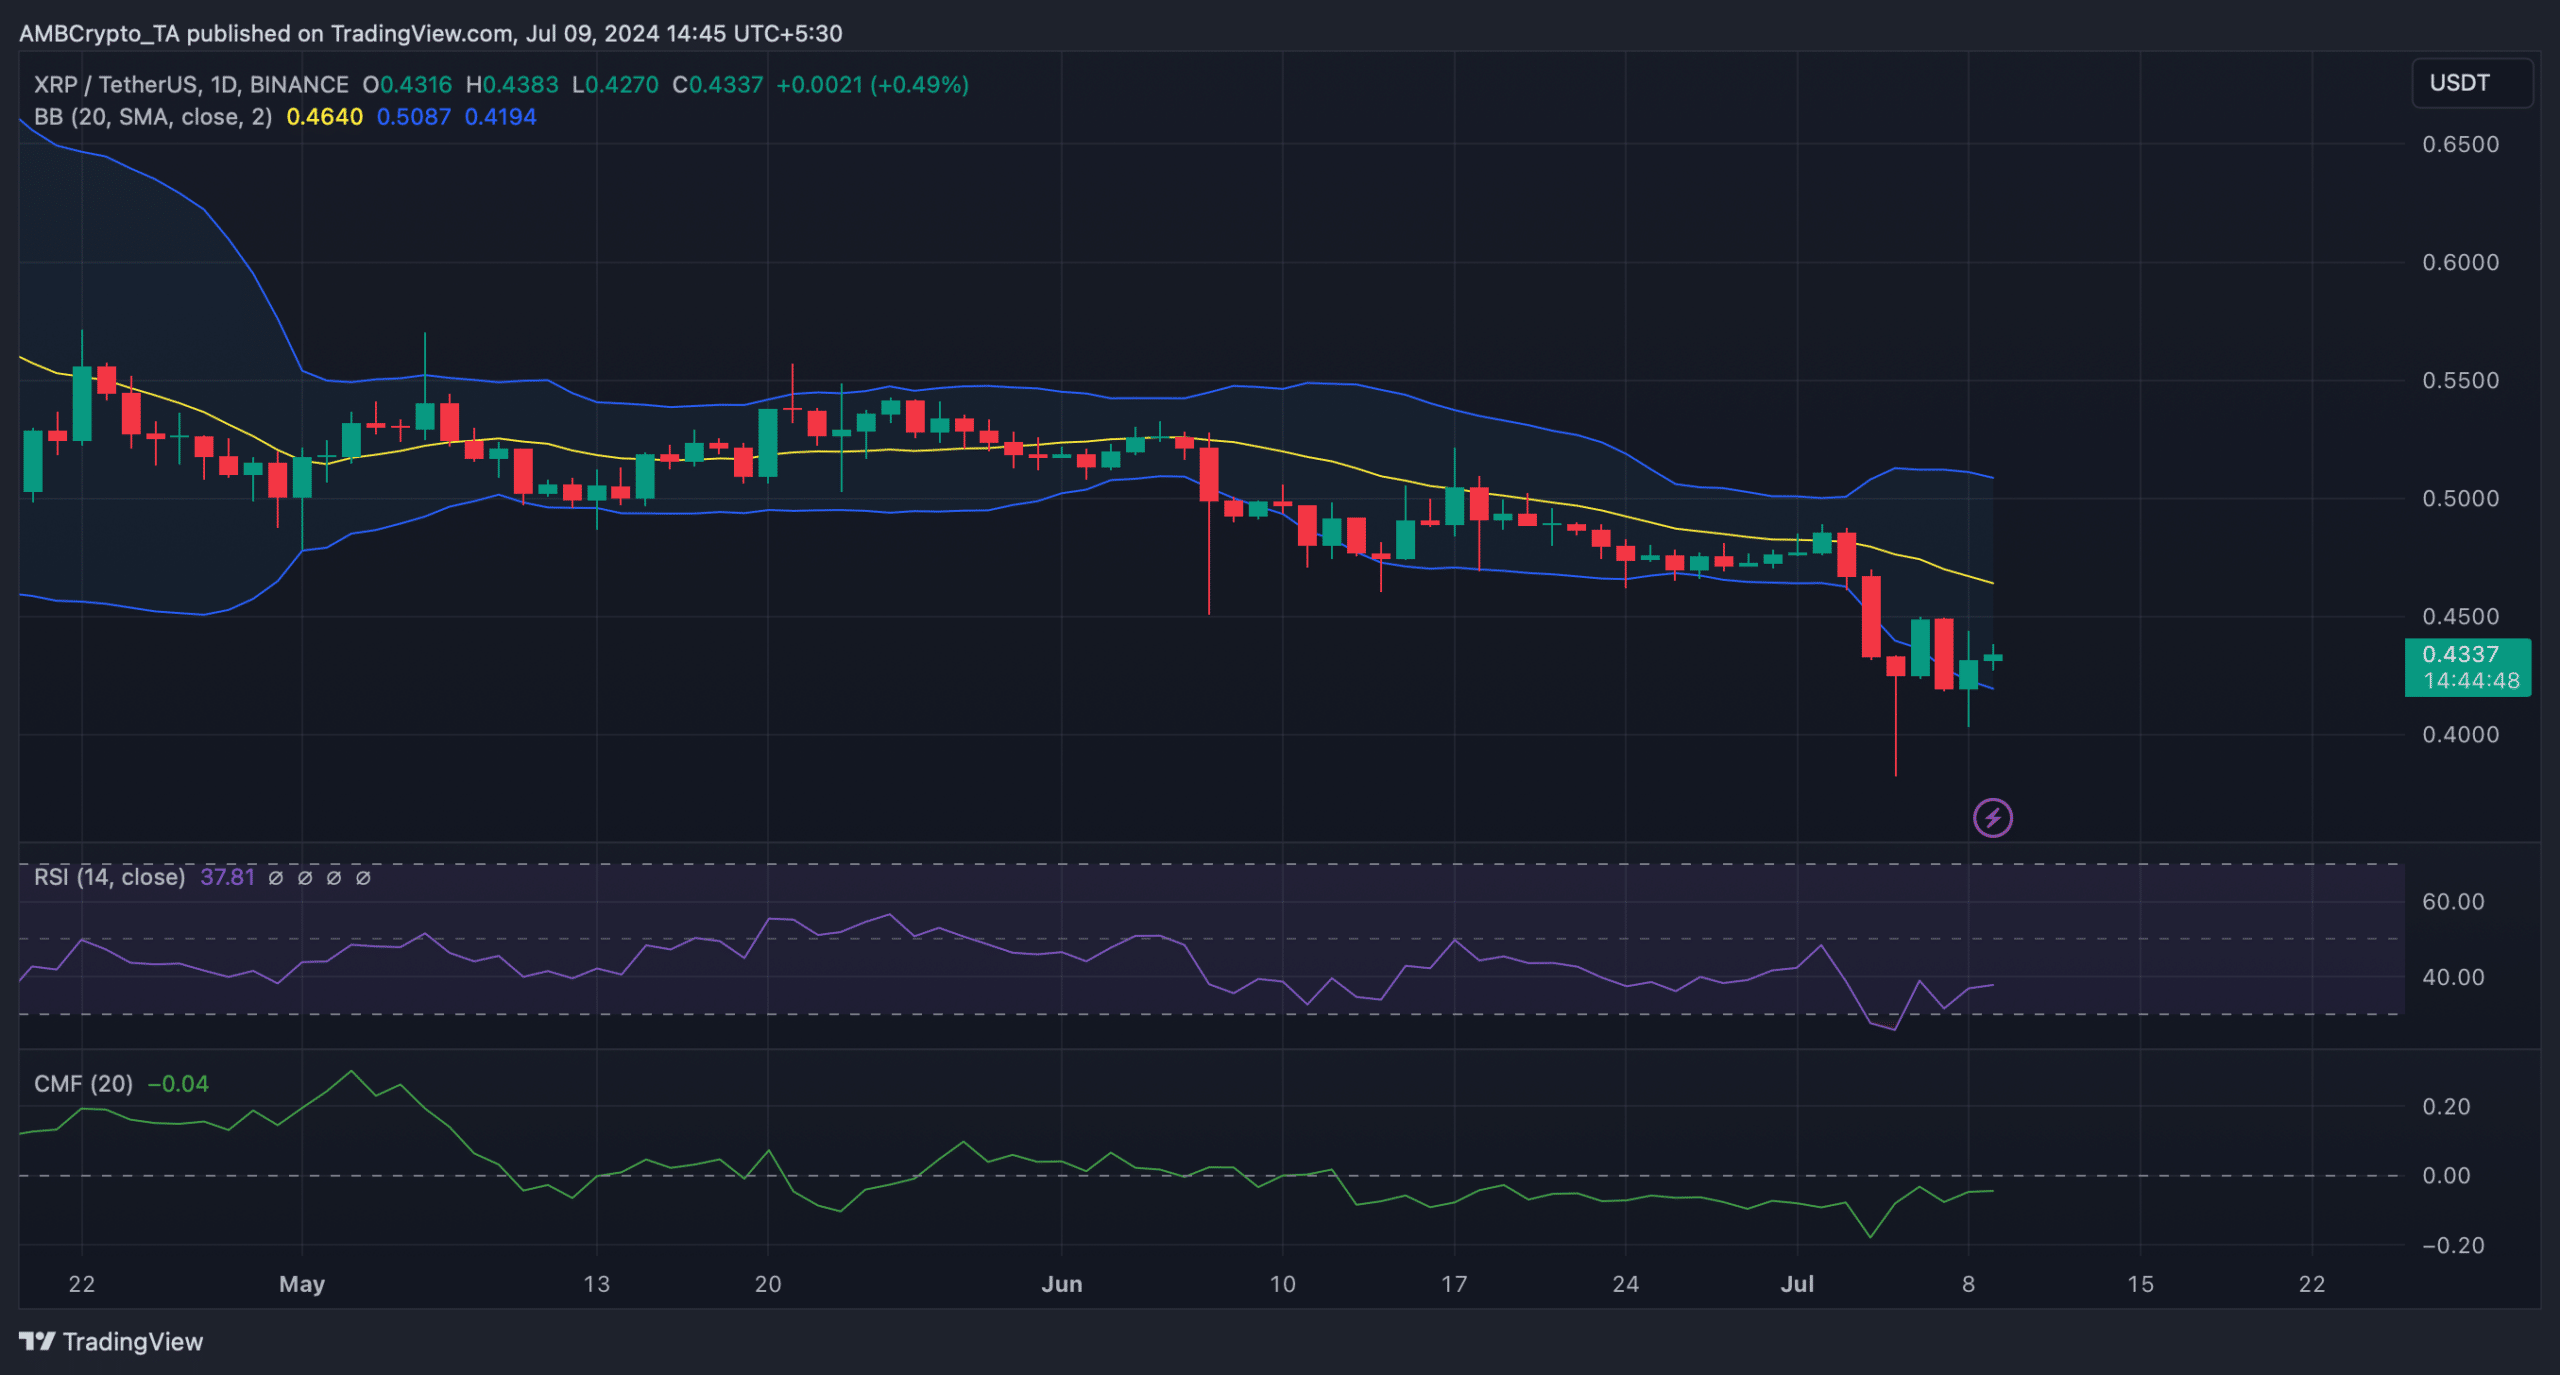
Source: TradingView
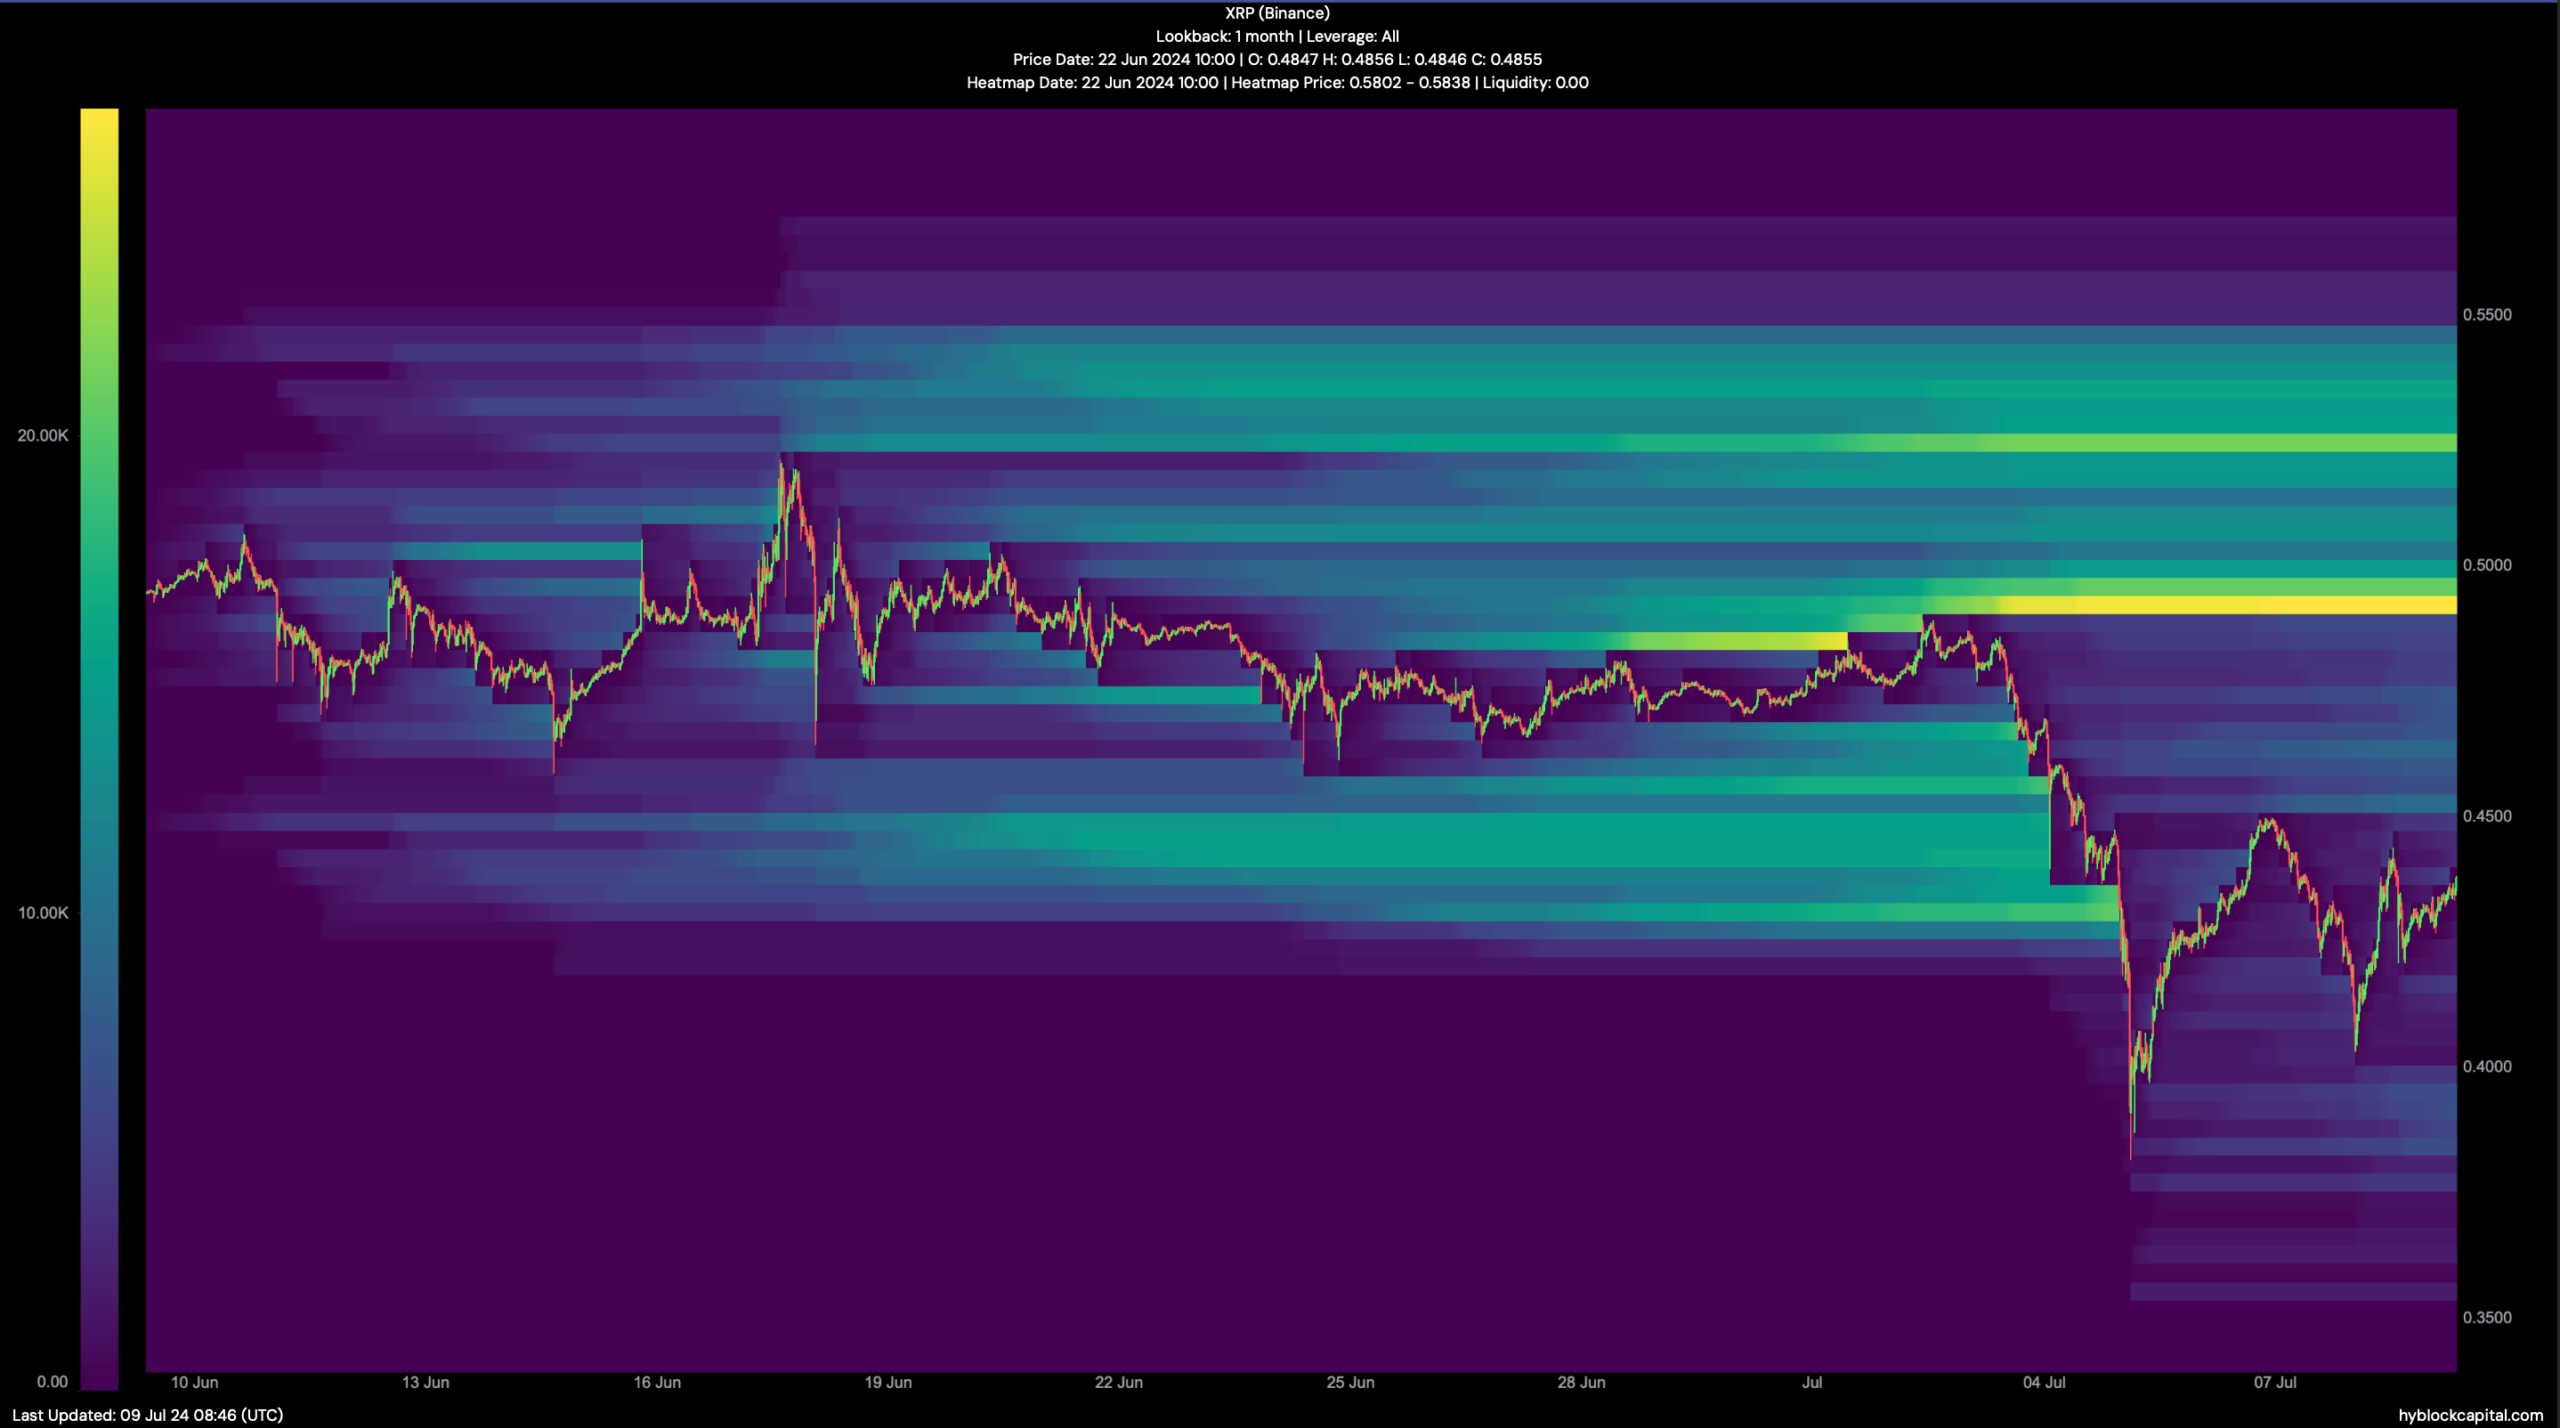
We then planned to check Hyblock Capital’s data to predict XRP’s price in the short term. As per our analysis, if XRP turns bullish, then the token’s value might soon reclaim $0.493.
A successful breakout above that mark could allow the token to touch $0.526 in the coming days.

Source: Hyblock Capital
Realistic or not, here’s XRP’s market cap in BTC’s terms
Next, we took a look at XRP’s weekly chart to find out long-term price targets. First of all, we found a falling wedge pattern. A breakout above the pattern would allow the token to reclaim $0.66.
Going northward, the next possible table would be $0.94. A jump above that mark would allow the token to reach $1.4 in the following months.
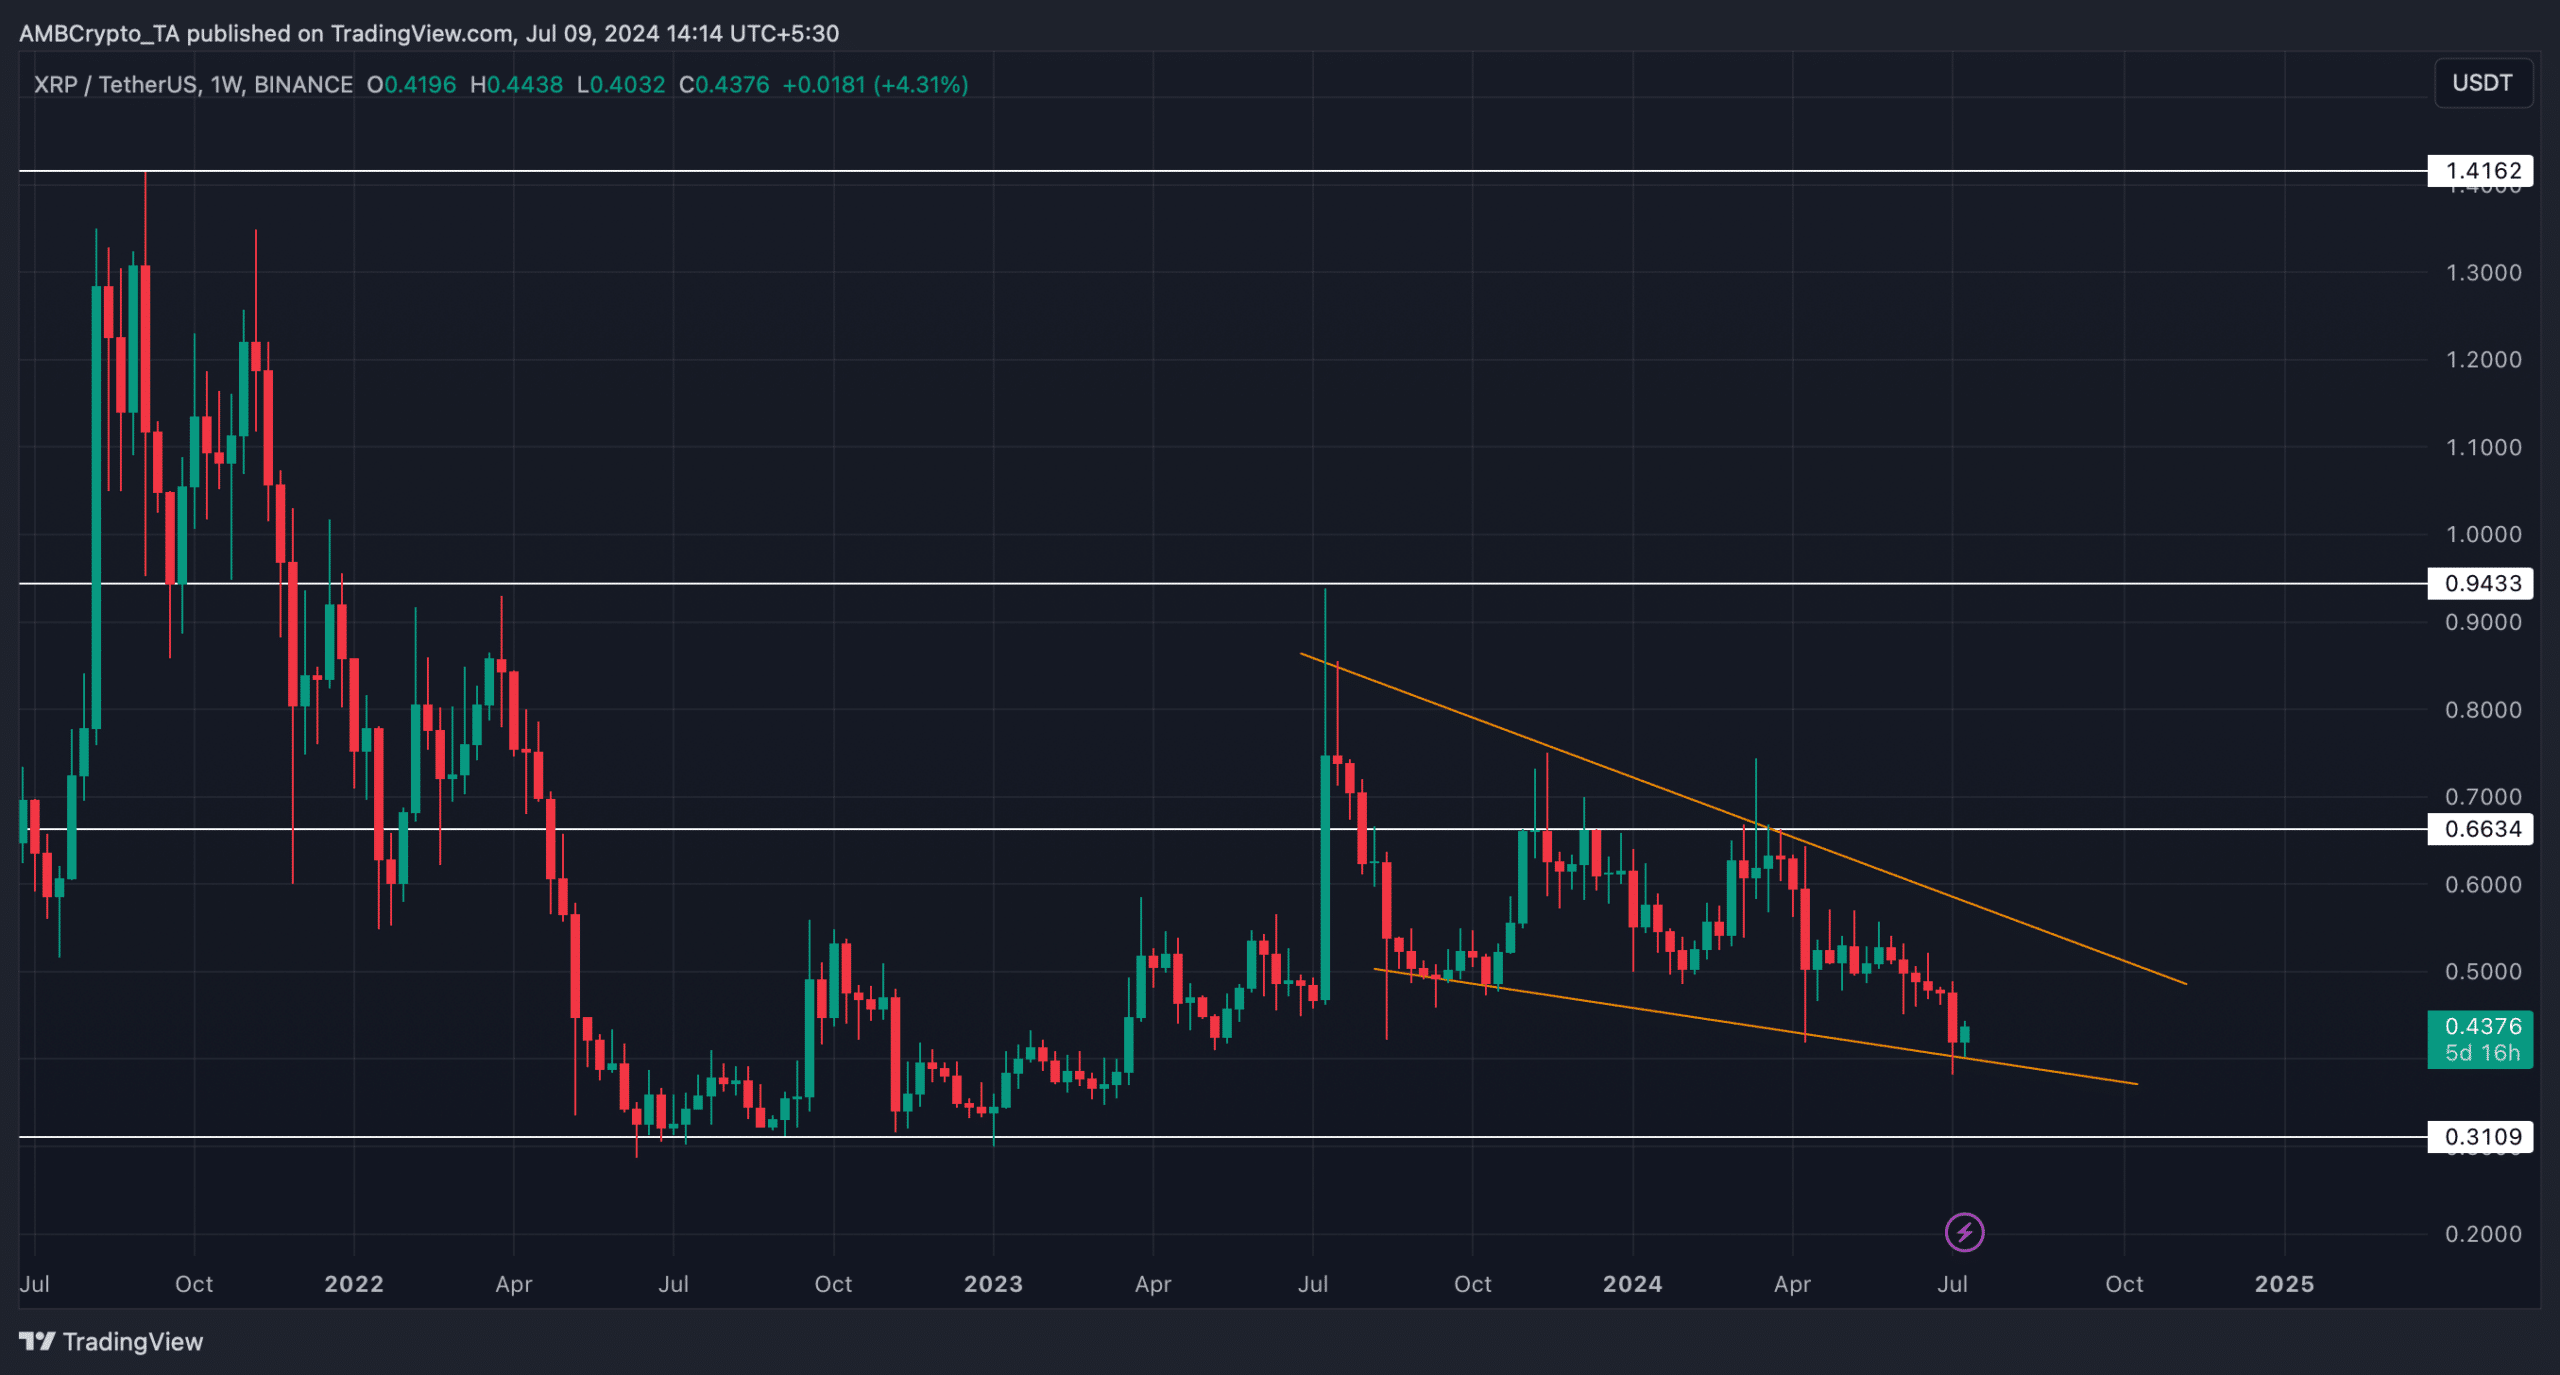
Source: TradingView
Bulls are getting back in the game, according to CoinStats.
Unlike other coins, the rate of DOGE has fallen by 0.18% since yesterday.
If it happens around current prices, sideways trading between $0.10 and $0.11 is the more likely scenario for the next few weeks.
DOGE is trading at $0.1072 at press time.
About the author
Denys Serhiichuk
The entire crypto market witnessed much volatility over the last week, and XRP was one of them as its value dipped.
However, the last 24 hours were in investors’ interest as the token’s chart finally turned green. Let’s have a closer look at the token’s state to predict XRP’s price action.
CoinMarketCap’s data revealed that XRP’s price dropped by more than 9% in the last seven days. However, the bears lost their hold in the market as the token’s price moved up marginally in the last 24 hours.
At the time of writing, XRP was trading at $0.4359 with a market capitalization of over $24.2 billion.
AMBCrypto’s analysis of Santiment’s data revealed that while the token’s price remained low, investors chose to accumulate more tokens. This was evident from the drop in its supply on exchanges.
Source: Santiment
Additionally, whale activity around the token also remained high throughout the last week, as its number of whale transactions increased. While the token’s price gained a slight bullish momentum, its trading volume also increased, acting as a foundation for a future rally.
Apart from this, the token’s network growth remained high, meaning that more new addresses were created to transfer the token.
However, XRP’s NVT ratio registered an uptick after a drop. Generally, a rise in the metric means that an asset is overvalued, which hints at a price correction.
Source: Santiment
AMBCrypto then analyzed XRP’s daily chart to see whether a price uptick was possible. We found that the token’s price had touched the lower limit of the Bollinger Bands, which often results in price upticks.
The Relative Strength Index (RSI) registered an uptick. On top of that, the Chaikin Money Flow (CMF) also followed a similar increasing trend, hinting at a price increase soon.
Source: TradingView
We then planned to check Hyblock Capital’s data to predict XRP’s price in the short term. As per our analysis, if XRP turns bullish, then the token’s value might soon reclaim $0.493.
A successful breakout above that mark could allow the token to touch $0.526 in the coming days.
Source: Hyblock Capital
Realistic or not, here’s XRP’s market cap in BTC’s terms
Next, we took a look at XRP’s weekly chart to find out long-term price targets. First of all, we found a falling wedge pattern. A breakout above the pattern would allow the token to reclaim $0.66.
Going northward, the next possible table would be $0.94. A jump above that mark would allow the token to reach $1.4 in the following months.
Source: TradingView
Dogecoin (DOGE) has been in a bearish trend, forming lower lows and highs after slipping off the $0.16 threshold on June 12. The downtrend continued this month, with Dogecoin briefly dipping below $0.1 on July 5.
While DOGE slightly rebounded above the $0.1 threshold, it still plays below significant price levels, with substantial selling pressure limiting its ascent.
DOGE trades around $0.108, with a 1.2% 24-hour decline and over 25% price drop in the last 30 days. Moreover, over the past seven days, DOGE has decreased more than 11%.
Despite Dogecoin’s struggles, market participants remain hopeful; some believe DOGE is on the verge of a major bullish breakout. But can Dogecoin overcome the prevailing bearish momentum to hit the $0.17 target? Let’s explore the possibilities.
Dogecoin (DOGE) has formed a bearish trendline since June. It is approaching the upper side of the trendline, and a break above this line could ensue a bullish reversal. However, most technical indicators paint a bearish picture.

The RSI stands at 38, indicating an oversold market. While this shows massive selling pressure, it could also lead to a price reversal if buy-the-dip investors enter the market.

DOGE’s price is in the lower Bollinger Band. While this usually suggests bearishness, it can also indicate a possible reversal. The MACD histogram bars are shrinking, suggesting that bearish momentum is weakening. The price remains below the 50-day and 200-day SMAs, showing that the bears are in charge.
The indicators show mixed signals; a trend reversal is possible but uncertain. But if Dogecoin eventually breaks above the trendline, it could push to the $0.17 target. Intense buying pressure is required to achieve this.
Crypto experts are optimistic about Dogecoin’s potential rebound. A prominent analyst, Big Mike, recently predicted that DOGE could exceed $1 in this bull cycle.
Mike based his projection on the Elliott Wave theory. In his analysis, he indicated that Dogecoin has completed a corrective phase and is entering a new upward phase.
$DOGE / $USDT possible count into 2025 pic.twitter.com/ua71Njnklm
— BigMike7335 (@Michael_EWpro) June 30, 2024
Big Mike noted that Dogecoin (DOGE) is about to start a new five-wave uptrend. According to him, the third wave of this pattern is often the strongest and could push Dogecoin’s price significantly higher.
Furthermore, the analyst points out an ascending channel on DOGE’s chart, supporting the coin’s bullish outlook. He used Fibonacci extension levels to identify potential price targets, suggesting that DOGE could reach new highs.
The Volume Profile Visible Range (VPVR) also supports this bullish view. It shows minimal resistance above current price levels. Consequently, this lack of resistance could allow for rapid price increases if DOGE breaks current barriers.
This bullish analysis has excited many Dogecoin supporters, offering hope for significant gains in the coming months. While the market remains uncertain, this bullish analysis provides a positive outlook for DOGE.
Another analysis suggests Dogecoin (DOGE) could present a significant investment opportunity. This analysis shows Dogecoin has retraced to the 88.6% Fibonacci level, indicating it might be at a critical turning point.
$DOGE
Primary Macro Analysis#DOGE presenting a 10x opportunity? In the midst of chaos, there may be opportunity. DOGE has done a full retracement into the 88.6% Fib lvl. This is a ride or die coin at this point, and the only way to count the larger degree wave 4 is a triangle. pic.twitter.com/XwiFeqfIWx— XForceGlobal (@XForceGlobal) July 8, 2024
The analyst describes the current market setup as a “ride or die” situation for the coin. It noted that DOGE’s larger degree wave 4 formed a triangle pattern, suggesting a breakout could happen soon.
The analyst believes this setup might lead to a 10x price increase for DOGE. While this analysis supports the growing bullish sentiment around Dogecoin, traders must apply caution as cryptocurrency investments carry high risks.
However, while awaiting Dogecoin’s potential breakout, PlayDoge has presented itself as a potential DOGE alternative for significant gains.
PlayDoge ($PLAY) is making waves in the crypto world as its presale surpasses the $5.5 million milestone.
This new meme coin combines nostalgia with play-to-earn features, attracting significant investor interest as a potential alternative to DOGE. Unlike Dogecoin, PlayDoge has utility through its play-to-earn game, giving it a competitive edge in the meme coin market.
PlayDoge offers a unique gaming experience. Users can earn cryptocurrency by caring for a Doge meme-inspired virtual pet. The game rewards players with $PLAY tokens, incentivizing engagement, which adds to its appeal to investors.
The game will be available on both Google and Apple stores, making it accessible to a broad audience. In addition to its gaming rewards, users can stake their $PLAY coins to earn staking rewards up to 93% APY.
This allows PLAY token holders to earn extra income while keeping the coin’s circulating supply in check.
Many believe $PLAY is among the meme coins whose value will bloom in 2024. Moreover, meme coins have posted notable gains this year, and PlayDoge appears well-positioned to mirror this trend.
Also, with the global video game market expected to reach $665 billion by 2030, PlayDoge is poised for significant growth. PlayDoge (PLAY) currently trades at $0.00517 in its presale phase. You can buy PLAY tokens using ETH, USDT, and a bank card.
Following the recent Bitcoin sell-off that saw the entire crypto market enter panic mode, XRP price broke out to the downside of a consolidation zone on July 4, crashing to a low of $0.382. The price of XRP quickly rebounded and stabilized around $0.43. Today, with Bitcoin’s price in the green, XRP has also mirrored this positive trend.
The price action of XRP is trending below the 21-day, 50-day, and 200-day simple moving averages (SMAs). The 21-day SMA is the nearest overhead resistance for the XRP price, around $0.445. The XRP relative strength index (RSI 14) is trending near the oversold (OS) region at 38. If the XRP price moves lower the RSI may drop into the OS zone, typically characterized by high selling momentum. On a positive note, the RSI in the OS region presents a great opportunity to buy in as the market believes the asset is undervalued.
The current price of XRP is in a precarious position as there is little to no support for this level in XRP’s price history. XRP price prediction shows the asset may rise by 7% to test the 21-day SMA as it attempts to break back into the previous range. If the bull succeeds, the XRP price may rise above the 50-day ($0.484) and 200-day ($0.531) SMAs to test the upper boundary of the range, around $0.545.
On the flip side, if the bears prevail, XRP may drop 18% from the current price to hit a low of $0.34, which coincides with the next decent support level for the asset. Key support levels on the way down include $0.40 and $0.36.
The court has scheduled a date for further motions and hearings on unresolved claims in the Ripple lawsuit. July 26 is a crucial day for Ripple’s legal motions and could influence the price of XRP.
American lawyer Fred Rispoli predicts that July 31 may mark a significant turning point, potentially signaling the end of the Ripple lawsuit.
Rispoli also anticipates a penalty of no more than $25 million and no disgorgement.
XRP’s price potential decline to $0.35 may catch the attention of investors, as this level presents a potential buying opportunity. Market participants perceive this as a favorable entry point, anticipating a possible rebound from this support zone.
Related Articles
The next hearing for the Ripple case has been set for July 16.
Yes, its is possible for XRP price to soar to $1 as long as it wins its case against SEC.
Yes. XRP is listed on Binance for trading.
However, the optimistic eyes hold on to the recent bounce back in the market as the Ethereum ETF application gets more attention for all the right reasons. Therefore, the HODLers can expect the prices to shoot up in the highly anticipated altcoin season.
With Polygon preparing to take off this season, investors are curious about whether Polygon can reach $100. Will Polygon go up? Is Polygon a good investment?
We bring our Polygon Price Prediction for 2024 – 2030 to explore the MATIC price prediction and answer such questions for you.
So read on because MATIC Prediction Prediction can be your golden ticket in the crypto universe.
| Cryptocurrency | |
| Token | |
| Price | |
| Market Cap | |
| Trading Volume | |
| Circulating Supply | |
| All-time High | $2.92 Dec 27, 2021 |
| All-time Low | $0.003012 May 10, 2019 |
| 24 High | |
| 24 Low |
Polygon, a key player in Ethereum’s Layer 2 ecosystem, is making significant progress in the crypto market. It is more than just a platform; it is a vision for the future. The release of Polygon 2.0, a network of ZK-powered L2 chains, will provide limitless scalability and unified liquidity.
What is PoS? Proof-of-Stake (PoS) is a consensus mechanism where validators are chosen to create new blocks based on the number of tokens they hold and are willing to “stake” or lock up.
Significance in ZK L2: In the context of Polygon’s ZK L2, ZKP ensures that all transactions are valid without revealing the specifics of the transaction. This enhances privacy and reduces the computational power required to validate transactions.
With a bullish breakdown of the $0.65 support level, the MATIC price trend is under extreme supply pressure. Further, the increasing gap between the 50D and 200D EMA following the death cross, the bearish influence is on the rise.
With the dynamic resistance of the 50D successful in keeping the bullish growth under check, the consolidation patch breaks with support breakdown.
With the breakdown rally gaining momentum, the altcoin may soon test the psychological mark of $0.50. On the upside, a reversal could retet the 50D EMA at $0.70.
| MATIC Price Prediction | Potential Low ($) | Average Price ($) | Potential High ($) |
| July 2024 | $0.42 | $0.60 | $0.70 |
Welcoming 2024 with a modest 2.04% increase on New Year’s Eve, MATIC’s journey above $1 was short-lived, succumbing to a pullback. However, the recent 17.35% dip seems to be a mere hiccup in its bullish trajectory, rejuvenated by the Bitcoin Spot ETF nod from the U.S. SEC.
This pivotal moment has rekindled the bullish fervour, positioning MATIC on a path to reclaim and potentially exceed the $1 mark.
The Polygon network shows a strong presence with a TVL of $1.217 billion and a stablecoins market cap of $1.815 billion. Over the past 24 hours, the network has seen a volume of $33.05 million and inflows of $1.11 million. The network has 1.28 million active addresses. MATIC, the native token, is priced at $0.50, with a market cap of $4.621 billion and an FDV of $4.978 billion. The data highlights Polygon’s active and growing ecosystem.
Following a sharp decline after the early 2023 gains, MATIC’s price displays an impressive bounce back, ready to challenge the overhead resistance trendline.
The recovery trend in the weekly chart is gaining momentum and starts an uptrend in 2024. Further, the trend momentum helps sustain the bullish price movement.
In short, the price of Polygon (MATIC) price forecasts for 2024 is a projected high of $6.91. On the flip side, the Polygon crypto price may drop back to its previous low at $1.62, resulting in an average price of $1.85 throughout the year.
| MATIC Price Prediction | Potential Low ($) | Average Price ($) | Potential High ($) |
| 2024 | $0.59 | $3.24 | $6.91 |
MATIC price forecast for 2025 predicts a new all-time high formation with the large-scale adoption of Polygon 2.0.
With a potential high of $3.15, the MATIC coin price is set to sustain the bull run. However, a short correction may reach a potential low of $1.899, making an average of $2.5245.
| MATIC Price Prediction | Potential Low ($) | Average Price ($) | Potential High ($) |
| 2025 | 2.628 | 3.843 | 5.067 |
| MATIC Price Prediction | Potential Low ($) | Average Price ($) | Potential High ($) |
| 2026 | 3.42 | 3.95 | 4.48 |
| 2027 | 4.45 | 4.944 | 5.438 |
| 2028 | 4.828 | 5.666 | 6.504 |
| 2029 | 6.267 | 6.8585 | 7.45 |
| 2030 | 8.715 | 8.8975 | 9.08 |
Anticipating further expansion, MATIC’s potential high for 2026 is projected to be $4.48, while the potential low is estimated at $3.42, resulting in an average price of $3.95.
MATIC crypto can make a potential high of $5.438 in 2027, with a potential low of $4.45, leading to an average price of $4.944.
As the MATIC coin price progresses, the potential high price for 2028 is projected to be $6.504, with a potential low of $4.828, resulting in an average price of $5.666.
Polygon coin price potential high for 2029 could be $7.45, while a potential low of $6.267, with an average price of $6.8585.
With an established position in the market, MATIC’s potential high for 2030 is projected to be $9.08. On the flip side, a potential low of $8.715 will result in an average price of $8.8975.
| Firm Name | 2024 | 2025 |
| Gov Capital | $2.14 | $3.46 |
| Digital Coin Price | $2.02 | $2.84 |
| Trading Beasts | $1.38 | $2.01 |
*The aforementioned targets are the average targets set by the respective firms.
The Polygon community is rapidly growing, and there are upcoming improvements in Polygon 2.0, which aligns with the expanding DeFi ecosystem. Coinpedia’s price prediction for Polygon is extremely bullish, suggesting MATIC crypto price may reach new swing highs and possibly surpass its all-time high in 2025.
The Polygon Price Forecast 2024 anticipates a swing high of $6.91, with an average price of $3.24.
We expect the MATIC Price to reach $6.91 by the end of 2024.
| Price Prediction | Potential Low ($) | Average Price ($) | Potential High ($) |
| 2024 | $0.59 | $3.24 | $6.91 |
What was the initial price of Polygon (MATIC)?
The initial price of Polygon (MATIC) was $0.00263 in 2019.
What is the all-time low (ATL) price of Polygon (MATIC)?
The all-time low price of Polygon was $0.003012 on May 10, 2019.
What is the all-time high (ATH) price of Polygon (MATIC)?
The all-time high price of Polygon was $2.92 on December 27, 2021.
What is the year-to-date (YTD) performance of Polygon (MATIC)?
Polygon (MATIC) has a year-to-date (YTD) growth of -48%.
Also Read the Latest Crypto News in 100 words! Get the live News on Cryptocurrency and blockchain at your fingertips. Stay up to date on major announcements and breaking news.
MATIC price could possibly close its trade for 2024, with a pricier tag of $6.91.
Yes, MATIC is a profitable investment, the digital asset should be under due consideration for the long term.
According to our MATIC price prediction, the altcoin could possibly reach a maximum of $5.0678 by the end of 2025. With a potential surge the price could go as high as $23.040 by the end of 2030.
While it is not a direct apples-to-apples comparison, as one is a layer-2 and the other is a layer-1. Polygon currently stands stout with its robust network.
At its best, Polygon can process 65,000 transactions per second.
The major functionality of Polygon is to enable the multichain Ethereum ecosystem. It provides a network that offers interoperability between previous and present infrastructure scenarios of Ethereum.
Matic Price Prediction $100, It is possible for Polygon Matic to reach $100 over the next 18 years.
Your investment of $100 in Polygon in 2020, considering at $0.022 (high of Dec 2020), would be now worth approximately $3554.55, with a percentage gain of 3454.55%
As of the reporting time, Dogecoin price is trading at $0.1086, reflecting a decrease of 0.96% during the European trading session.
According to CoinMarketCap data, the trading volume has decreased by 12%, amounting to approximately $784 million. Despite this reduction in trading activity, Dogecoin maintains its position as the ninth-largest cryptocurrency by market capitalization, currently at $15 billion. This movement highlights a cautious market sentiment amid broader economic cues.
Over the past week, DOGE has experienced a significant decline, with its price dropping by approximately 16%. The cryptocurrency’s value ranged between a high of $0.12 and a low of $0.09 during this period.
This dip reflects a broader downtrend in its value over the past month, where Dogecoin has fallen by around 36%. The volatility in Dogecoin’s price and its current market dynamics indicate a phase of consolidation within these range-bound limits.
The meme coin Dogecoin has rallied by 16% from its recent low of $0.0913, recorded last Friday. While this uptick mirrors a temporary recovery observed across many cryptocurrencies, not all are poised to maintain these gains.
Dogecoin price prediction may struggle to keep up its momentum. DOGE is anticipated that the price might stabilize or potentially decrease as buying pressure remains subdued. This downturn follows a period where Dogecoin had dipped below its March bottom, negating gains accrued later in that month.
In a significant cryptocurrency transaction, a total of 108 million Dogecoins (DOGE) valued at approximately $11 million were transferred to the trading platform Robinhood.
🚨 108,572,027 #DOGE (11,580,883 USD) transferred from unknown wallet to #Robinhoodhttps://t.co/rKRBitf8Qy
— Whale Alert (@whale_alert) July 8, 2024
The movement of these digital assets, originating from an unidentified wallet, was observed earlier today, marking one of the more substantial transfers involving DOGE in recent weeks.
In the current revival of the cryptocurrency market, Dogecoin is setting its sights on crucial price points. If DOGE climbs past $0.11, it might face a tough barrier at $0.20. This breakthrough from its typical trading pattern would mark a significant achievement. If it maintains above this threshold, Dogecoin could aim for a higher resistance level at $0.50.
Conversely, if it falls below $0.10, Dogecoin could withdraw to a lower support line at $0.09. Negative market trends could push it further down towards $0.08.
The daily technical indicators for Dogecoin reveal significant trading patterns and potential trends for investors. The Chaikin Money Flow (CMF) indicator currently sits just above zero at 0.07, suggesting a slight bias towards buying pressure in the market.
Moreover, the Average Directional Index (ADX) reads at 47.38, indicating a relatively strong market movement trend.
The Relative Strength Index (RSI) has been hovering around the mid-50s, specifically noting a current value of 50.44. This suggests a relatively balanced market with neither overtly bullish nor bearish momentum. The Moving Average Convergence Divergence (MACD) shows a slight bullish crossover, indicating the potential for a modest upward price movement.
Related Articles
DOGE transactions are completed within a few minutes, benefiting from its efficient Proof-of-Work mechanism.
Elon Musk, CEO of SpaceX and X (formerly Twitter), frequently promotes DOGE, significantly boosting its value with his endorsements.
Yes, DOGE’s valuation is closely tied to internet memes, reflecting its origins from the Shiba Inu meme.
In this blog, let us discuss why the XRP price is rising in the market today and what is coming next for the token between drop and surge.
Since its drop to $0.3955, XRP price has recovered by 11% to $$0.4344, which is quite significant for such a losing crypto. Since its launch, XRP has spent most of its time undervalued and attacked by external factors, limiting its growth in the market. Despite that, it is among the top ten cryptocurrencies in the market, hinting at its strong command over the market. The recent surge is another prime example of XRP’s strong support system, a.k.a XRP community.
Talking of which, XRPscan reveals that the token has gained the highest number of daily executed transactions in months. As per the reports, the number of transactions has jumped past 2.3 million, the highest mark since February 2024. The reports also mentioned the surge in the average transaction amount on the network, indicating an increased network activity among investors.
Per the CoinmarketCap data, the 24-hour trading volume has also increased by 30% in the last 24 hours, currently at $1,325,023,216 Billion, indicating the same. It is because the adoption of the network might be triggering as Ripple does offer cross-border payment
options. The current 3% surge is here, thanks to these factors, and much more might come as the new inflow can trigger user sentiments, leading to new hikes for the XRP price.
With this, many crypto analysts have identified the possibility of the XRP price surging to months or even years highs. EGRAG CRYPTO, a crypto analyst, has predicted of XRP price rising to a new ATH at $18.22, whereas Dark Defender has spoken of history repeating itself and the XRP price rising to $9.50.
When you see, you see.
It was never easy for #XRP & will not be, but in the end,
History repeats itself.
Believe In Miracles? pic.twitter.com/BWz14ScY7X
— Dark Defender (@DefendDark) July 8, 2024
Many predictions have stormed the market with ongoing recovery, creating new hopes among investors for nullifying their losses over the years.
The exponential and simple moving averages over the 10,20, 3050,100 and 200 intervals put the XRP token in a strong selling position, which means the sellers are more likely to bring the value down. The MACD (12,24) level also indicates the Sell, which means the downward pull is higher on the token, which could lead to declines in the XRP price.
However, technical indicators like the Relative Strength Index, Average Directional Index (14), Williams Percent Range (14), and many other indicates the neutral marking, indicating the presence of both bulls and bears in the market. With Momentum (10) and Commodity Channel Index (20) indicating buy, the possibility of a price rise is also present.
If the token can bounce up the support of 0.40897 towards the pivot at 0.48719, the XRP price might see an uptrend. However, if the next candlestick moved down to the support, the price might face further declines.
Continue Reading Why Meme Coins Might Bounce Back Stronger?
TL;DR
The cryptocurrency market experienced a significant decline at the end of last week but started rebounding in the past few days. According to CoinGecko’s data, the sector’s global market cap currently stands at over $2.2 trillion (a 5% increase on a daily scale).
Ripple’s XRP is among the notable gainers, with its price briefly surpassing $0.44: a 13% spike compared to last week’s low of $0.39. Some analysts believe the valuation is yet to explode to unseen peaks, with the X user EGRAG CRYPTO being one example.
The trader set the staggering $17 as XRP’s “new top target.” Closing above $0.75 “with conviction,” reclaiming the $1 mark, and passing through the “equilibrium” of $1.80 was outlined as “crucial” for reaching the depicted all-time high.
“XRP Army STAY STEADY! My aim is for some coins to pump so I can rotate the profits to XRP. This is the conviction,” EGRAG CRYPTO added.
Another analyst who envisioned a bright future for Ripple’s native token was Dark Defender. The X user predicted a rally above $9.50 should “history repeat itself.”
Important indicators part of XRP’s ecosystem have been relatively flat in the past several months until a significant resurgence was spotted on July 8. XRPscan data shows that the daily number of executed transactions jumped above 2.3 million for the first time since February 2024.
The number of successfully executed transactions and the average number of transactions per ledger have also headed north.
The uptrend generally indicates increased activity and utilization of the XRP network. It can also be a sign of rising adoption either by individual users or by financial institutions leveraging Ripple’s technology for cross-border payments.
Such an uptick often coincides with an increase in trading volume. CoinGecko’s data show that the figure has reached almost $1.5 billion on a 24-hour scale, surpassing major altcoins such as BNB ($1.3 billion) and DOGE ($900 million).
These advancements could positively affect investor sentiment and attract more people into the ecosystem. In turn, the potential new flow of capital can trigger a price spike for XRP.


 Price Prediction, is it Too Optimistic?")