The main tag of cryptocurrency price today Articles.
You can use the search box below to find what you need.
[wd_asp id=1]
The main tag of cryptocurrency price today Articles.
You can use the search box below to find what you need.
[wd_asp id=1]
Moreover, top crypto tokens such as BTC, ETH, and XRP price recorded a variation of less than ±2% in their respective portfolio during the whole week, highlighting a reduced price action for these crypto tokens.
Dive in as, in this article, we have covered the market sentiments, price analysis of Bitcoin (BTC), Ethereum (ETH), and Ripple (XRP), and also their potential price targets for June!
The cryptocurrency market leader, Bitcoin price, has displayed a consolidated price action throughout the week, indicating a significant decline in the buying and selling pressure for the star crypto. Moreover, the price has breached its important support level, indicating a high possibility of a bearish reversal.
The technical indicator, SMA, shows a bearish convergence in the price chart, suggesting an increase in the selling-over-buying pressure in the crypto market.
Moreover, the Moving Average Convergence Divergence (MACD), displays a constant decline in the chart, indicating increased negative sentiment for the BTC price. Moreover, the averages show a bearish convergence in the 1D time frame, suggesting uncertainty in its future price action.
If the market holds the price above the resistance level of $68,000, the bulls will regain momentum and prepare to retest its all-time high of $73,750.07 this month. However, bearish price action could pull the price toward its lower support level of $60,000 during the upcoming weeks.
Despite increased bearish sentiment in the crypto space, the ETH price has successfully held its value above the important support level of $3,730, indicating a rising bullish influence for the altcoin leader in the crypto market.
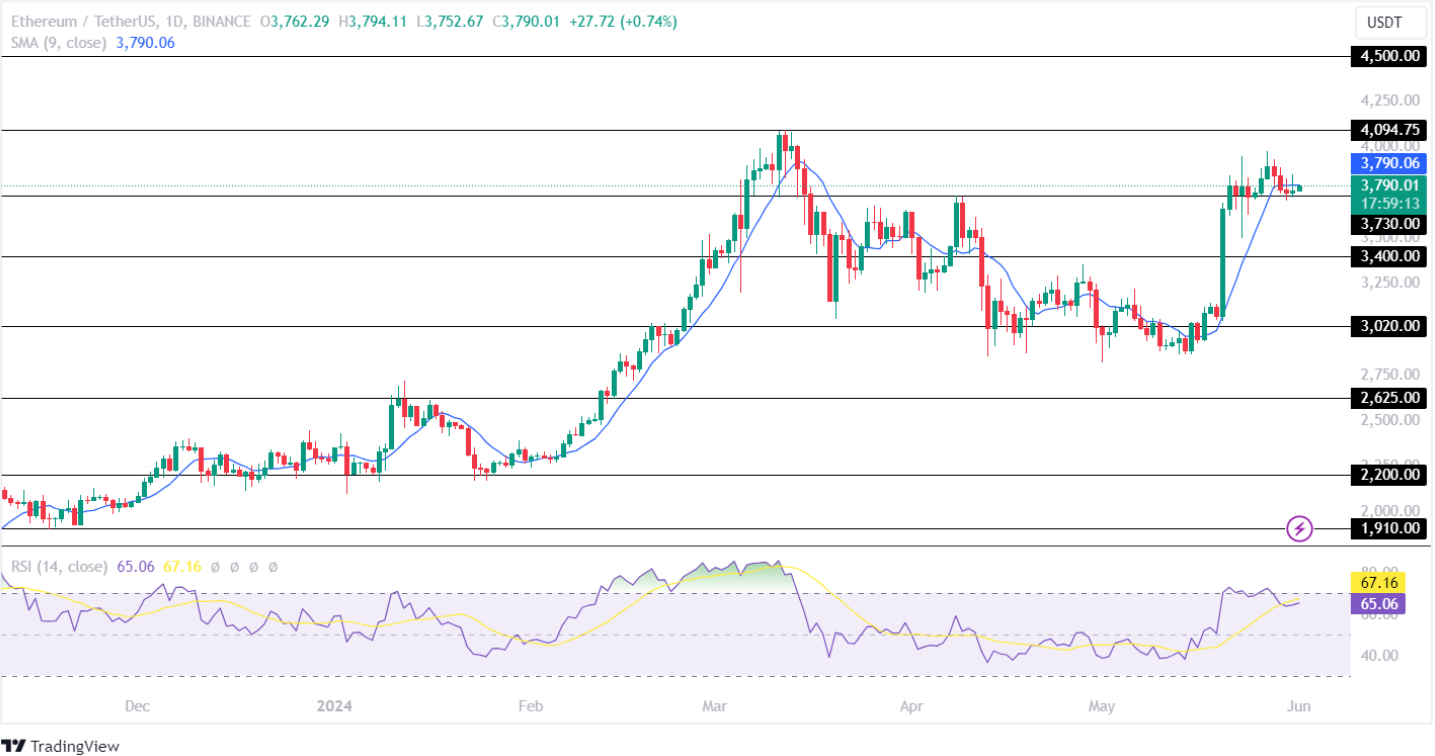
The Ethereum crypto has added approximately 2% to its portfolio this week. However, the ETH coin price has added 28.38% over the past 30 days, highlighting a positive outlook during the upcoming weeks.
The Simple Moving Average (SMA) shows a high possibility of a bullish convergence in its 1D time frame. Furthermore, the Relative Strength Index (RSI) displays a bullish curve below the overbought range, suggesting the Ethereum price will continue gaining value this month.
If the bulls hold the price above the support level of $3,730, the ETH crypto will surpass its resistance of $4000 and head toward its upper resistance level of $4,500 during the upcoming weeks. Conversely, a bearish trend reversal could result in the price testing its low of $3,400.
Amid increased volatility, Ripple’s XRP crypto has recorded a constant price fluctuation by adding 0.25% within the past day but recording a correction of 3% over the past week. Moreover, it added 4.35% in May but has a YTD of -15.59%, indicating a mixed price sentiment for the XRP Price.
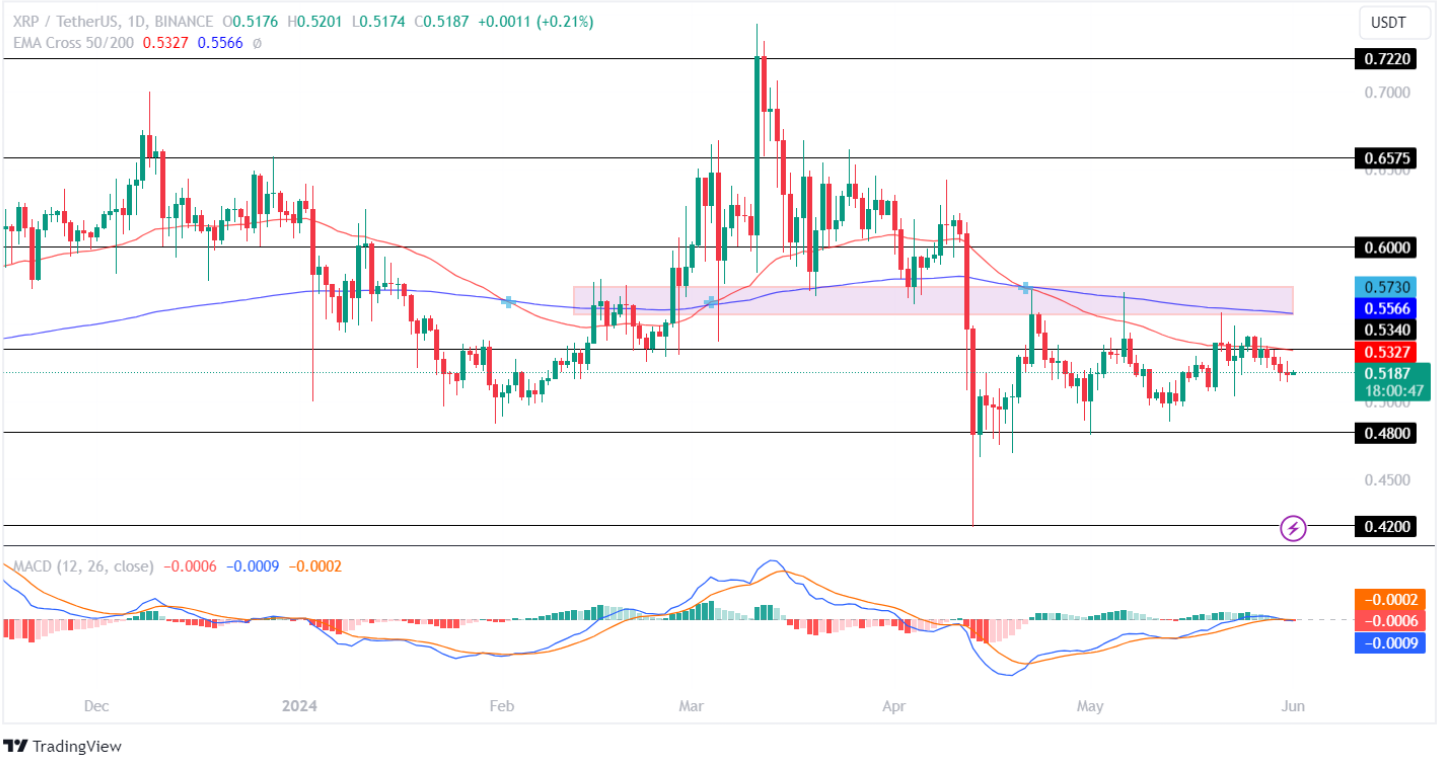
The Cross EMA 50/200-day acts as a resistance to the price chart, highlighting increased selling pressure for the Ripple price in the crypto market.
The technical indicator, MACD, displays a constant flatline with its averages showing a neutral trend. This highlights uncertainty in the future price action of this altcoin.
Suppose, the bulls regain momentum. In that case, the XRP coin price will surpass its resistance level of $0.5340 and retest its important resistance zone. However, a weak price action could result in the Ripple token plunging toward its crucial support level of $0.480 in the coming time.
Also Check Out : What to Expect from Ripple (XRP) & Cardano (ADA) Prices: Will They Ever Make It to $1?
From a low of 118 recorded on 1st May price has rallied 58% to the recent high of 188 recorded on May 20th and got rejected at a descending trendline.Since the rejection on 20th May. Today 1st of June, SOL is currently trading at a Support level, a 14% decline from the 188 high.
If prices can drop to the double support level of the demand zone and the 6-month ascending trendline at around $145, that level could prove too strong to break lower, keeping in mind the recent Solana ecosystem developments.
But then again, If the bulls can defend the current support level at around $165, next target would be at the descending trendline that has rejected price above it for three consecutive times, 2-month descending trendline. A strong breakout would drive prices to the $200 level and beyond.
Solana is trading close to several key moving averages. While the token is above both the 50-day Exponential Moving Average (EMA) of $152 and the 100-day EMA at $157, it has maintained a good distance above the more substantial 200-day EMA at $122, offering a potential support base in the lower zones.
The CMF indicator which measures buying and selling pressure, is currently at the neutral 0 level on the daily timeframe. This equilibrium suggests a period of consolidation, as the amount of money flowing into the asset is equal to the outflow, potentially leading to a stabilization phase without significant upward or downward momentum until a new market catalyst emerges to shift sentiment.
The RSI also backs up this consolidation phase while reading at 53, a neutral reading showing neither the buyers nor the sellers have control of the market currently
Looking ahead as we start a new month, , according to projections from Coincodex. The platform predicts that SOL could gain 15% by end of June establishing a new high from the previous $188 and trading at the $191 level.
Backing up the bullish outlook, Coincodex technical indicators suggest a positive outlook, with the Fear & Greed Index reading at 72, firmly in the “greed” territory. Solana has recorded 14 out of 30 which is 47% green days over the last month and with a price volatility of 9.77% indicative of its recent upwardtrend.
Disclaimer: Analytics Insight does not provide financial advice or guidance. Also note that the cryptocurrencies mentioned/listed on the website could potentially be scams, i.e. designed to induce you to invest financial resources that may be lost forever and not be recoverable once investments are made. You are responsible for conducting your own research (DYOR) before making any investments. Read more here.
XRP is among the altcoins that continue to command a large following even after putting on a poor performance for the last few years. At the same time, expectations for the altcoin have fluctuated between bullish and bearish, especially in the long term. However, in the short term at least, the machine learning algorithm at CoinCodex predicts some level of bullishness for XRP.
As the month of May draws to an end and June swims into view, there are varying expectations for the crypto market and where it could go from here. For XRP, the CoinCodex machine learning algorithm predicts that the month of June will be bullish for it.
The one-month prediction timeframe on the website shows that the price would rise as high as $0.627709, and from the current price of XRP, this would mean an over 20% increase in price. This prediction is followed by greed among investors despite the website showing that sentiment is turning bearish.
In the shorter term, the machine learning algorithm is just as bullish on the XRP price, expecting a major jump in price. This 5-day prediction timeframe shows an approximately 24% increase in the price of the altcoin, putting it as high as $0.6448.
The machine learning algorithm shows that general XRP sentiment from various indicators shows bearishness. However, it could present an opportunity for investors to get in before a surge, taking advantage of the popular investing belief to “Buy when there is blood in the streets.” Simply put, this means buying when other investors are bearish.
One thing that continues to drive the belief in XRP is the expectation that the coin is next in line to get a Spot ETF approval from the United States Securities and Exchange Commission (SEC). This comes after the regulator approved Spot Ethereum ETFs, putting an end to the argument of whether Ethereum qualifies as a security or not.
Many in the space believe that since Ethereum was able to get a Spot ETF approval, it is not out of the cards for XRP, which is currently battling the regulator regarding its security status. However, Ripple CEO Brad Garlinghouse said at the Consensus 2024 Conference that he believes three altcoins, Solana, XRP, and Cardano could receive an ETF approval from the SEC.
At the time of writing, the altcoin’s price is still struggling to break and turn the $0.52 resistance into support. It has fallen 2.47% in the past week to trade at $0.518.

Featured image created with Dall.E, chart from Tradingview.com
The primary resistance lies around $0.1629, a breach that could open the path toward higher levels at $0.165 and $0.170. Support is at $0.158. If Dogecoin falls below this, it could drop to the following key support level at $0.155.
The daily chart for Dogecoin (DOGE) reveals moderate fluctuations within a narrow trading range, which is particularly evident from the consistent oscillation between support and resistance levels over the month.
When writing this piece, Dogecoin had stabilized at $0.620.The closing price for today is $0.1645, but with a small rise, represented by the small green candle. The Relative Strength Index (RSI) remains at the middle ground at 50. 42, This suggests that the market is balanced for the period in question and is neither overbought nor oversold.
Dogecoin has gained close to 12% of its value within the last 30 days, and though it has had a downward trend after the losses that have been observed in the crypto market. Whales and large holders are constantly active on the Doge network in buying/selling bigger amounts, adding an element of speculation to the market which is being closely observed by investors who are viewing the future plan with keen interest.
The market of Dogecoin has been marked with fluctuation as whale transactions have moved over 1.5 billion DOGE in the last 24 hours. Notably, the whale was identified.Notably, the whale with the wallet address “DDuXG…1wwKF” who recently bought 90 million DOGE from Robinhood, gives the sense of how much mayhem pivoting can happen quickly.
CrediBULL Crypto and professional analysts from other sources as well are of the view that
Potentially impacted by Bitcoin’s trends indicate that Dogecoin’s fate in the short and medium terms hinges on its current path. The next few trading sessions will be important in deciding whether Dogecoin can continue to hold the above support levels or drop to broader bearish serpentine pressures borne by the market during the whale activities.
Disclaimer: Analytics Insight does not provide financial advice or guidance. Also note that the cryptocurrencies mentioned/listed on the website could potentially be scams, i.e. designed to induce you to invest financial resources that may be lost forever and not be recoverable once investments are made. You are responsible for conducting your own research (DYOR) before making any investments. Read more here.
Over the past few weeks, Cardano [ADA] has been trading between $0.40 and $0.46, showing limited movement as it consolidates. It was worth $0.44 at press time, with a decrease of 0.7% in the past twenty-four hours. Is ADA ready to exit its consolidation phase?
First, let’s examine the state of ADA’s derivatives market. Coinglass data showed mixed sentiment and massive reductions in trading activity.
The derivatives data shows varying degrees of bullish and bearish sentiment across different trading platforms. Binance is bullish, but OKX is leaning toward a bearish stance.

Source: Coinglass
While some bullish sentiment is evident in long/short ratios, the drop in volume and options activity might cap any potential surge. Unless volume and trader engagement increase by a long margin, ADA may continue to trade within its current range without a clear breakout.
Currently trading at $0.447, ADA shows a slight downtrend as the MA50 (red line) dips below the MA200 (blue line), suggesting a bearish short-term outlook as it nears the lower boundary of its recent trading range.
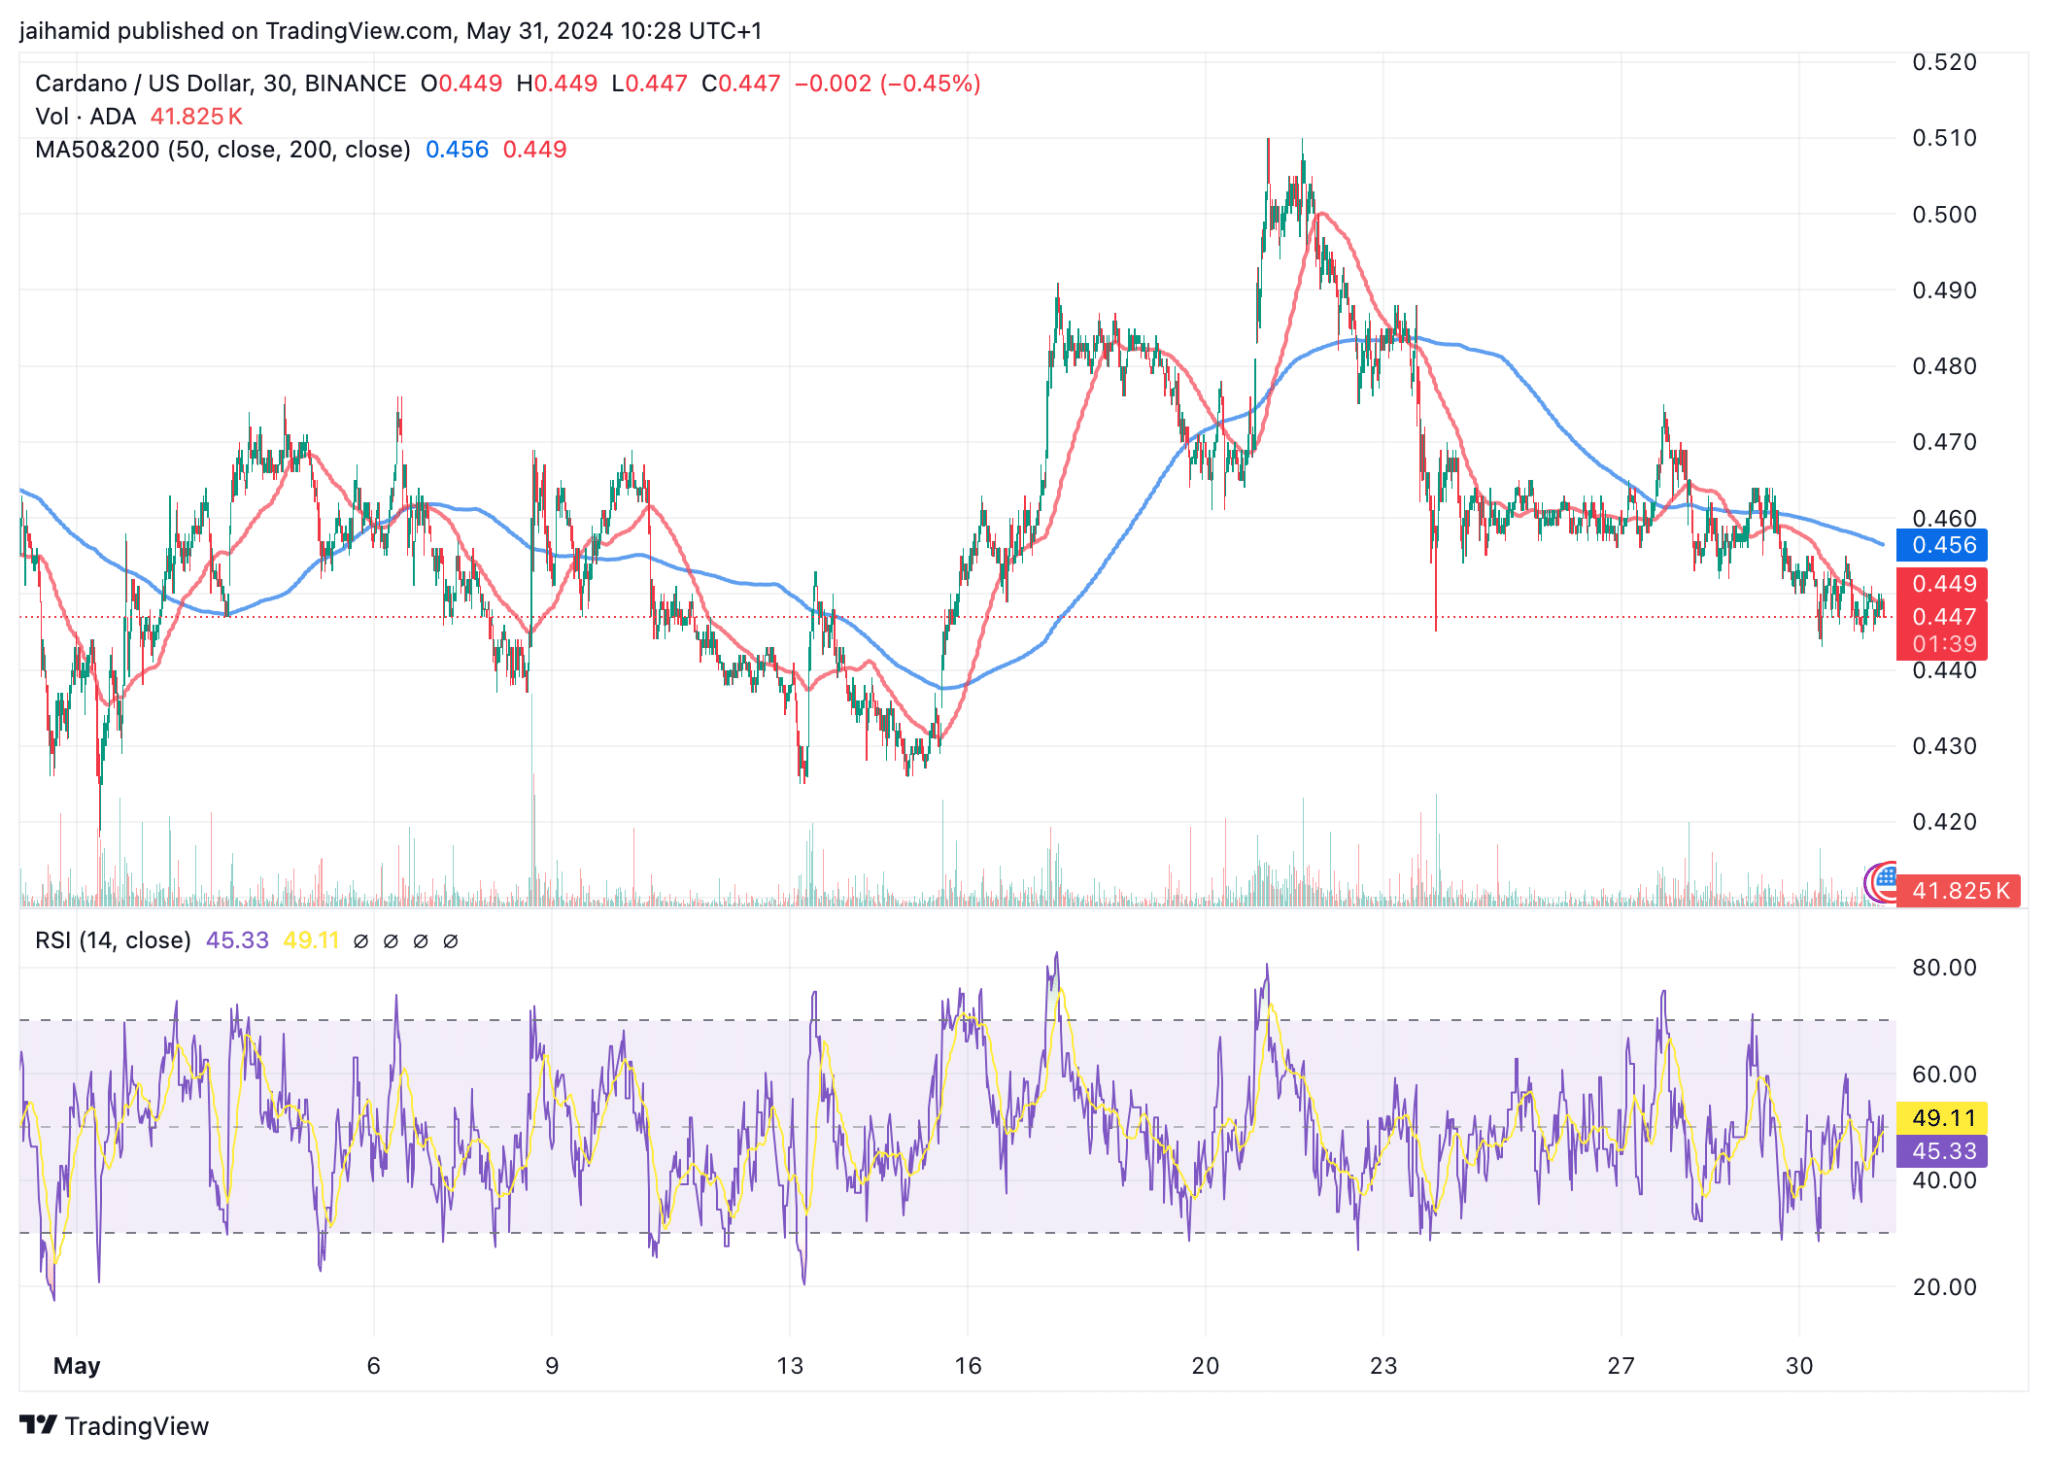
Source: TradingView
The Relative Strength Index (RSI), at 45.33, further supports a neutral to slightly bearish sentiment. It is neither in the oversold nor overbought zone, indicating that there is neither significant selling nor buying pressure driving the price out of its current consolidation zone.
To make matters worse, Cardano’s Fear and Greed Index right now sits at a comfortable score of ‘Fear.’ This is corroborated by predominantly negative ratings across several indicators.
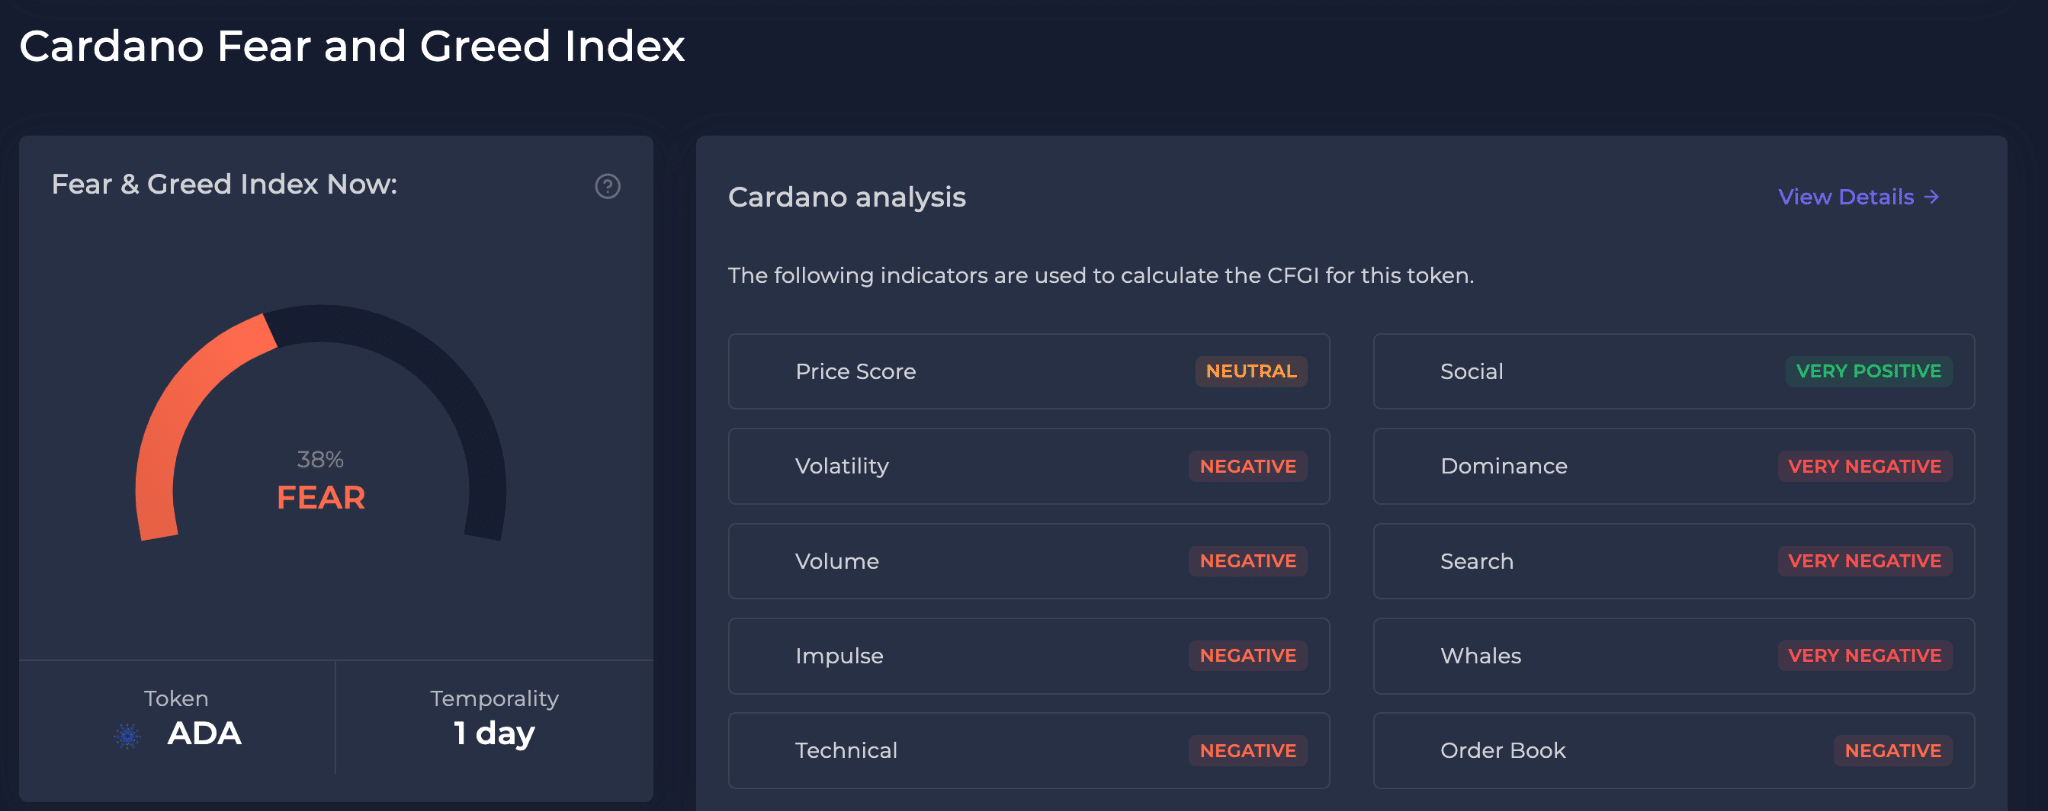
Source: CFGI
Volatility, volume, whales’ activities, and order book depth are all flagged as negative, which suggests reduced market activity and possible sell pressure. Over the past day, ADA’s social volume has fluctuated a lot, indicating varying levels of community interest and discussion.
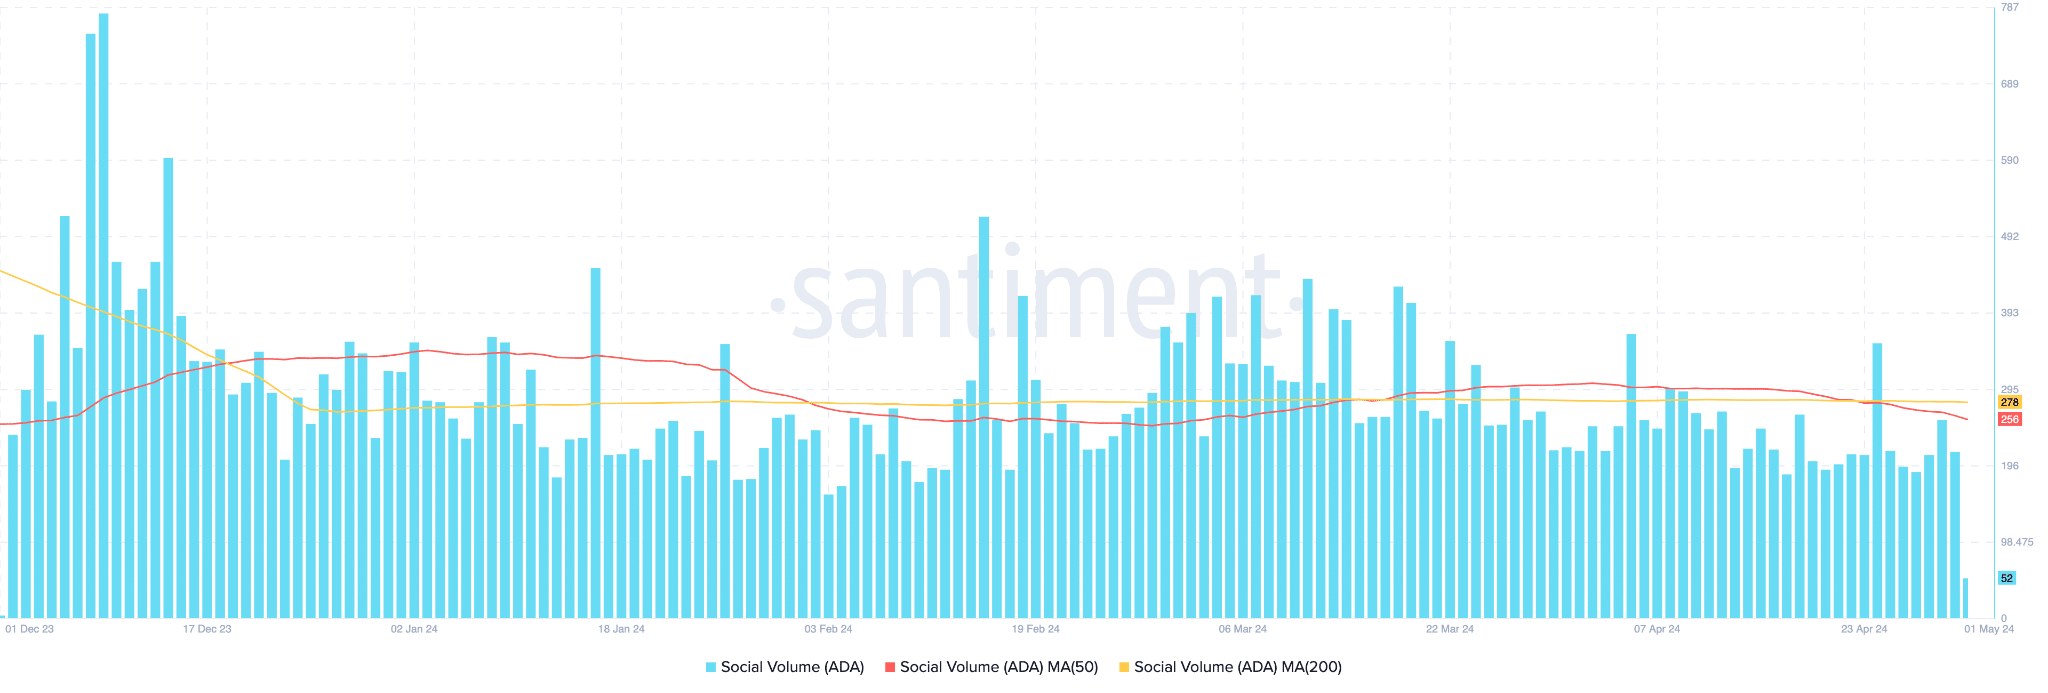
Source: Santiment
The 50-day moving average (red line) shows a gradual decline in social activity, suggesting that while there may be an intermittent rise in discussion, the general trend points to decreasing engagement.
This decline is more pronounced with the 200-day moving average (yellow line), highlighting a more sustained decrease in social mentions. All in all, ADA doesn’t seem to be getting out of consolidation anytime soon.
Here are the top three news stories by U.Today from the past day.
In a recent post, the team behind the official Shiba Inu X handle addressed its followers to commemorate a significant date in the project’s history. Three years ago, in May 2021, Ethereum cofounder Vitalik Buterin sent 410 trillion SHIB tokens (worth about $6.7 billion at the time) to a dead wallet, permanently removing them from circulation. This huge amount of meme tokens was part of a gift made to Buterin by the Shiba Inu founder, Ryoshi, who sent him 50% of the total SHIB supply. The amount of 410 trillion SHIB represented 90% of the amount sent to Buterin; the remaining 10%, the Ethereum cofounder decided to donate to charity. The commemoration post on Shiba Inu’s official X handle gained significant attention from SHIB enthusiasts, scoring 270,000 views and 2,100 likes, which shows that the SHIB community has not forgotten that watershed moment in the project’s history.
James K. Filan, a defense lawyer who is closely following the development of the Ripple-SEC lawsuit, has provided an update on the case. According to his post, Ripple has filed a reply letter in support of its motion to seal documents in connection with the SEC’s motion for judgment and remedies. Ripple stated that it is no longer selling XRP tokens through over-the-counter transactions. Bill Morgan, legal analyst and digital asset enthusiast, replied to Filan’s post, writing that the fintech giant’s statement is a “crushing blow” to proponents of the FUD that Ripple suppresses the XRP price by dumping tokens on retail investors. “Ripple points out what by now should be obvious. Sales of XRP to ODL customers do not have any of the terms the Court found relevant in deciding over-the-counter contracts were investment contracts such as price discounts. Ripple offers no discounts to ODL customers based on the evidence I have seen and this statement to the Court,” Morgan said.
Yesterday, prominent crypto analyst Jelle issued his prognosis on Ethereum’s future price trajectory on his X page. According to Jelle, the world’s second-largest crypto by market cap is continuing to follow the falling wedge pattern, as expected. The analyst then stated that there might be a few more days of fluctuations below the current local highs before the next upward movement. Concluding his post, Jelle suggested that some ETF news next week could potentially push Ethereum’s price beyond $4,100 and possibly even to all-time highs. At the moment of writing, Ethereum is changing hands at $3,760, down 0.41% over the past 24 hours, per CoinMarketCap. However, the asset has demonstrated significant resilience, increasing by 25.58% over the past 30 days. This bullish outlook is further bolstered by the latest regulatory developments in the U.S. concerning Ethereum spot ETFs.
About the author
Valeria Blokhina
DISCLAIMER: This article is a SPONSORED Press Release and does not constitute Finbold’s editorial content. Crypto assets/products involve significant risks. Do not invest unless you are prepared to lose your entire investment. For a full disclaimer, please .
Experts consider Arbitrum (ARB) and Solana (SOL) to be good investments due to their recent bullish signals. Conversely, Rebel Satoshi’s $RECQ is emerging as one of the most promising crypto investments in the current crypto market.
Let’s delve into the crypto price prediction to understand why $RECQ might be the best crypto to buy now compared to ARB and SOL!
On May 23, 2024, Aperture Finance announced that it had helped UniV3 liquidity providers on Arbitrum rebalance over $1 billion in liquidity in less than nine months. Following this news, the value of ARB increased from $1.201 to $1.231 a few days later, signaling a 2.50% surge in ARB’s value.
For price projections, some analysts have a positive crypto price prediction for Arbitrum because of signals from technical indicators that point to a bullish breakout. As such, they predict that ARB will rise to $1.811 before the end of June.
On the other hand, some crypto market analysts have a bearish projection for Arbitrum due to the crypto market volatility. Consequently, the price of ARB could drop to $1.015 in the next two weeks.
On May 17, 2024, Tinydancer announced that their Simplified Payment Verification (SPV) client is live on the Solana testnet. This announcement caused a lot of reactions from the Solana community, and the price of SOL also saw a slight price uptick.
Two weeks later, SOL rose from $169.53 to $170.00, representing a marginal 0.28% rise. Regarding the crypto price prediction, some analysts are bullish about Solana due to recent talks of a Solana exchange-traded fund. Hence, they predict that the price of SOL will surge to $210.55 by early June. Thus, these experts see Solana as the best crypto to buy now.
Conversely, other crypto market analysts are skeptical about investing in Solana because of sell-offs from investors looking to make a profit. Hence, the value of SOL could drop to $150.00 in the next two weeks.
Rebel Satoshi is a new meme coin project designed to spark a decentralized revolution in the market with its innovative, community-focused approach. Memebers of the Rebel Satoshi ecosystem play a crucial role in the platform’s governance and are actively involved in developing its dual-token ecosystem.
The $RBLZ token grants voting rights for key community decisions and provides various perks, such as early access to NFT collections. During its presale, $RBLZ raised over $2.5 million and is now available for $0.025 on Uniswap, CoinStore, Coingecko, and DEXTools. Notably, the token’s price surged by 150% from its initial presale price of $0.010.
Meanwhile, Rebel Satoshi’s new token, $RECQ, is in Stage 2 of its presale, priced at $0.0044. Early investors in this stage can anticipate a 25% gain when $RECQ reaches $0.0055 in Stage 3 and an 184% gain when it hits a launch price of $0.0125
$RECQ serves as the base currency for all transactions and interactions on the Rebel Satoshi platform, offering substantial real-world utility. Additionally, $RECQ holders benefit from the platform’s advanced buyback program and access to various play-to-earn games in the Rebel Satoshi Arcade.
Many traders now view $RECQ as a top investment opportunity with higher future potential than Arbitrum and Solana. Don’t miss the chance to participate in the promising Rebel Satoshi presale and diversify your portfolio with the rising $RECQ!
For the latest updates and more information, be sure to visit the official Rebel Satoshi Website or contact Rebel Red via Telegram
2024 began with significant momentum for cryptocurrencies like Bitcoin and Ethereum, eliciting enthusiasm among crypto enthusiasts. As of May 24, 2024, BTC is trading at $67,165, boasting a market capitalization of $1.33 trillion, representing a 3.83% decrease in the last 24 hours. However, it experienced a recent increase, hovering around the $69,000 mark and increasing by 1.30% over the previous seven days.
BTC, the leading cryptocurrency, has endured a tumultuous period, shedding approximately 65% of its market value over the past year. Crypto enthusiasts were taken aback by unforeseen events such as the Terra Luna crash, FTX decline, macroeconomic factors, and Binance’s legal issues. Nonetheless, the crypto market exhibited a remarkable recovery towards the end of the year, with BTC showing promising growth.
Bitcoin surged to impressive heights, surpassing its all-time high of $69,170 on March 8, 2024, reaching $70,083. Subsequently, on March 14, 2024, BTC again exceeded its previous peak, reaching $73,750. This surge propelled its market capitalization to $1.44 trillion, contributing to the overall crypto market capitalization of $2.77 trillion, reflecting exceptional performance.
Featured Partners
Legacy
Over 1 Million Investors Trust Mudrex for Their Crypto Investments
Security
Mudrex is Indian Govt. recognized platform with 100% insured deposits stored in encrypted wallets
Fees
Enjoy zero crypto deposit fees and industry’s best fee rates.
Multiple Award-Winning Broker
Listed On Deloitte Fast 50 index, 2022 Best Global FX Broker – ForexExpo Dubai October 2022 & more
Best-In-Class for Offering of Investments
Trade 26,000+ assets with no minimum deposit
Customer Support
24/7 dedicated support & easy to sign up
After surpassing the psychological threshold of the $31,000 mark, Bitcoin started exhibiting a bearish trend and traded below $30K levels for most of the last year. However, it has shown remarkable recovery in the latter months of the year. The world’s largest cryptocurrency, BTC, which was on a recovery path, has increased around 206.68% in one year. It is currently trading at its highest level, surpassing its all-time high in 2021 and setting a new benchmark at $70,083 on March 8, 2024. The current valuation is around $69,157.
The world’s largest cryptocurrency, BTC, which was on a recovery path, has increased around 150.88% in one year. As of May 24, 2024, it is currently trading at $67,165, with a market capitalization of $1.33 billion and a global cryptocurrency market capitalization of $2.51 trillion.
Cryptocurrency experts believed that if BTC maintained its level of $30,000, it could likely bounce back from there. Looking at the current scenario, Bitcoin surpassed its all-time high in March but witnessed a downtrend later.
In April 2023, the top cryptocurrency Bitcoin touched the key resistance of the $30,000 level for the first time since June 10, 2022, and then started dipping below to $26,000. It significantly rose to $45,203 after May 2022. Crypto experts believe that if Bitcoin maintains the $45,000 level and beyond, it could reach $60,000 by the end of 2024. In the first three months of the year, BTC has already touched the level of $73,750 and set a new record for an all-time high.
While the future of Bitcoin is unknown, retail investors must be very cautious about every move of Bitcoin, as it has witnessed tumultuous before. Moreover, India’s stance on cryptocurrencies continues to be firm with the government bringing all crypto-related transactions under the ambit of the Money Laundering Act. In a specific gazette notification, the Union Finance Ministry of India stated that all the transactions related to digital assets or virtual currency would fall under the purview of the Prevention of Money Laundering Act (PMLA).
The new development may appear damaging to the cryptocurrency community in India. On the ground, however, the move has been praised by the industry at large as a step towards regulating this space. In the absence of regulators, the enforcement agencies will immediately take recourse to any discrepancies.
The Spot Bitcoin ETFs have been a tremendous factor in Bitcoin’s growth. After the SEC approved the ETFs in the U.S., retail investors showed great interest, leading to Bitcoin surpassing its all-time high.
One of the other reasons crypto experts are hopeful about Bitcoin is that this year, 2024, will be a year for Bitcoin’s halving event. The Bitcoin halving event happens every four years, during which BTC rewards to its miners are cut by 50% (the miner’s payout will be reduced to 3.125 BTC). This event is usually positive for Bitcoin’s price, as it helps contract supply. Historically, halving has been seen as a great sign for bringing momentum to Bitcoin’s price.
Bitcoin Halving History
The above table shows that past Bitcoin halving events have established long-term bullish drivers for Bitcoin’s price. The Bitcoin halving event relates to its deflationary tendency and crushing its supply, which helps the Bitcoin price to rise further. As BTC is a decentralized cryptocurrency, any central banks or governments can’t print it, and thus, Bitcoin’s total supply is limited.
Moreover, “Bitcoin Whales,” referring to large investors, have started accumulating Bitcoin again. According to data from the on-chain aggregator Santiment, these large Bitcoin whales, holding 1,000-10,000 BTC in their wallets, indicate that investors have been filling up their wallets with a substantial amount of Bitcoins. This accumulation may contribute to boosting the price of Bitcoin.
The current year is the year of Bitcoin’s fourth halving. It is expected to occur in the month of April. It forms the basis of Bitcoin’s monetary policy and supports its increasing scarcity by cutting Bitcoin’s supply growth rate in half approximately every four years.
At one point, Bitcoin’s supply growth rate exceeded 10%, but it was cut to about 1.75%. In the halving month, i.e., anticipated in April this year, it will fall to just 0.85%. The BTC halving will continue until all 21 million coins are mined, sometime in the year 2140. Currently, around 19.6 million BTC coins are circulated in the cryptocurrency market.
Geoff Kendrick, head of crypto research at Standard Chartered Bank, believes that the BTC price will hit $100,000 by the end of the current year. Bitcoin’s halving can be one source of price upside.
As of May 24, 2024, BTC is trading at $67,165 with a market capitalization of $1.33 trillion. The halving was completed on April 20, 2024, at block height 840,000.
Note: The figures are taken from CoinMarketCap.
Bitcoin enthusiasts often make overly optimistic and sometimes unrealistic predictions for their favorite cryptocurrency. After this mini-bull run, numerous discussions have taken place around Bitcoin, the world’s largest digital coin. Some speculate that the crypto coin could reach $10 lakh by 2025.
Several well-known personalities have rolled this hypothetical and notable figure of $10 lakh in the crypto world. Recently, Standard Chartered, one of the leading British Multinational Banks, raised its prediction price for BTC from $1,00,000 to $1,20,000 by the end of 2024 in one of its most recent research reports, citing more profit to BTC miners. The MNC bank forecasts BTC to reach $50,000 by the end of this current year.
The Chinese-Canadian Bitcoin entrepreneur and CEO of crypto firm JAN3, Samson Mow, believes that the cryptocurrency will reach $1 million in the next five years. With several such wild guesses, Balaji Srinivasan, an investor and the former technology chief at Coinbase, bet that BTC could reach $10 lakh or more in just 90 days.
Srinivasan made this strong statement by merely believing that as the world enters the stage of hyperinflation, the value of the dollar will weaken, and people will start buying more and more BTC. The term “Hyperinflation” means an extreme increase in the price of goods and services over a period of time.
On the other hand, cryptocurrency experts believe BTC might touch $10 lakh in the coming years, but not that soon. Predicting this level in 2023 or in 90 days is just not possible.
Marshall Beard predicted, “Bitcoin will be a million dollars in 90 days. Some crazy things are happening in the world, which we don’t want.” However, he said it might take 10 years to reach this extreme prediction.
Featured Partners
Legacy
Over 1 Million Investors Trust Mudrex for Their Crypto Investments
Security
Mudrex is Indian Govt. recognized platform with 100% insured deposits stored in encrypted wallets
Fees
Enjoy zero crypto deposit fees and industry’s best fee rates.
Multiple Award-Winning Broker
Listed On Deloitte Fast 50 index, 2022 Best Global FX Broker – ForexExpo Dubai October 2022 & more
Best-In-Class for Offering of Investments
Trade 26,000+ assets with no minimum deposit
Customer Support
24/7 dedicated support & easy to sign up
Among the myriad predictions on Bitcoin, the bottom line remains that it has experienced several downfalls and has emerged stronger than before each time. Its resilient nature instills a sense of belief in crypto enthusiasts who see value in investing in decentralized currencies.
Only time can tell whether Bitcoin soars higher or faces challenges, and trading Bitcoin should be done with full awareness; your investment may yield a different return than the anticipated return.
Explore Our Top Cryptocurrency Picks
Learn More About Cryptocurrency
Coins Prediction
Price Analysis Articles
Crypto Buying Guides
With some assets in the cryptocurrency market seemingly breaking their bearish trend and others still waiting for their turn, Dogecoin (DOGE) has moved above the psychologically important threshold of $0.16, and artificial intelligence (AI) algorithms have mixed predictions for its price by the end of 2024.
As it happens, Dogecoin has managed to return above the $0.16 it maintained for most of the past week, returning to the steady growing trend it held since the year’s turn, albeit still below the yearly highs that witnessed it make a bullish rally to and beyond $0.20.
So, how high can Dogecoin go? In terms of its future performance, an advanced AI model that relies on chart patterns, historical price action, technical analysis (TA), and other factors has set the price of Dogecoin at $0.271106 on December 30, 2024, which would suggest an increase of 68.43% from DOGE’s current price.
Elsewhere, the most recent iteration of OpenAI invention ChatGPT, called ChatGPT-4o, has offered a slightly bearish price range in comparison to the above, pointing out that the DOGE price forecast for the end of 2024 stood between $0.148 and $0.16, arguing that:
“This aligns with current forecasts and trends, factoring in various expert reports without indicating any sudden surges or drops expected within this year.”
Meanwhile, Claude 3 Opus by Anthropic cited Changelly’s long-term prediction of DOGE trading at around $2.14 by 2030 and Finder’s panel of finance experts, which has set the average price of Dogecoin at $0.266 by the end of 2024, placing its own projection between $0.137 and $0.266.
For now, Dogecoin is changing hands at the price of $0.16096, recording a 1.31% gain in the last 24 hours, declining 1.43% across the previous seven days, while accumulating an advance of 28.44% over the past month, as per most recent charts on May 31.

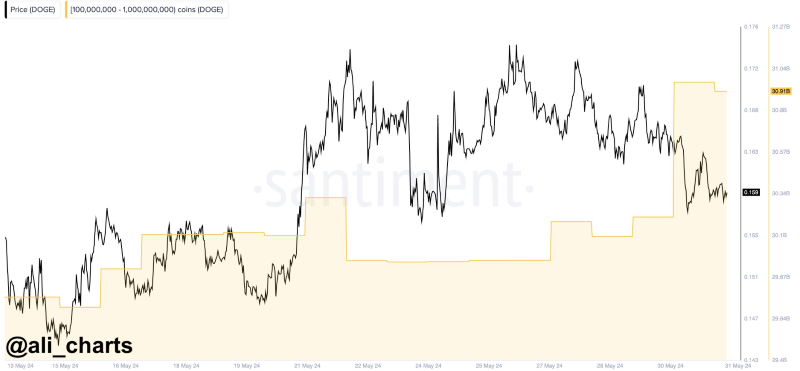
It is also worth noting that renowned crypto trading expert Ali Martinez has observed an increase in the activity of Dogecoin’s whales, noting that the largest holders of the doge meme digital asset had bought a massive amount of DOGE in only three days, according to his X post on May 31.
Indeed, as per the data retrieved by the crypto analyst from the blockchain and social metrics monitoring platform Santiment, DOGE whales have purchased over 700 million of the currently eighth-largest asset in the crypto sector by market capitalization, worth around $112 million.
Earlier, a dormant Dogecoin whale, holding nearly 900,000 DOGE, stirred from its hibernation after more than ten years of inactivity, making their first transaction since May 2014, in which they transferred 23,338 DOGE to Binance, one of the largest crypto exchanges, as Finbold reported on May 24.
All things considered, AI models seem divided regarding the future price action of the popular doge meme token, although some indicators suggest it might continue to grow towards the end of 2024, emphasizing the importance of carrying one’s own research when investing.
Disclaimer: The content on this site should not be considered investment advice. Investing is speculative. When investing, your capital is at risk.
XRP price prediction: The cryptocurrency market is steadily buoyed by Bitcoin (BTC) as it hovered at evaluated cliffs, slightly below the previous all-time high. Altcoins are moving sideways in the wake of a brief rally triggered by the approval of spot Ethereum ETFs. XRP holds above the crucial $0.52 support on Friday amid increasing signs of an inbound bullish move.
Market factors are strong for Bitcoin and altcoins. The approval of Ethereum ETFs raised the stakes for XRP and Solana to receive similar products in the future.
A turnaround in net Bitcoin ETF inflows has sparked a fresh interest in the leading cryptocurrency. In addition, the European Union is making impressive steps toward regulating the crypto market under its Markets in Crypto-Assets (MiCA) framework.
XRP Price Prediction: Is This A Good Time To Buy XRP?
XRP stands out as the eighth largest cryptocurrency, with a market cap of $28 billion. With a green candle established on the four-hour chart, this could be a good chance for traders to seek exposure to longs ahead of a larger move up.
The Relative Strength Index (RSI) in the same time frame is starting to reinforce the bullish grip with potential. Should the RSI cross above the descending trend line and close the gap to the midline in the neutral area, the path of least resistance would uphold the uptrend.
Two levels could shape the future outlook of the cross-border money remittance token—the green band support at $0.51 and the red band resistance at $0.53. XRP continues to oscillate in the narrow zone, implying little to no bearish or bullish bias.
The increasing four-hour candle shows that buyers have the upper hand. However, for XRP to establish a sustainable uptrend, all three exponential moving averages (EMAs) must flip to provide support.
Such a move would ensure that the short-term death crosses are canceled in favor of incoming golden cross patterns. Above the red band, traders must brace for more resistance from the descending trendline around $0.54. XRP price failed to cross this level last week, leading to the current sideways action.
The most important levels in the daily range moved to $0.56 and $0.5, respectively. XRP still holds below the 20-day, 50-day, and 200-day EMAs, a bearish signal.
However, the Moving Average Convergence Divergence (MACD) dons a bullish signal likely to encourage traders to consider buying XRP. A major rally would erupt if resistance at $0.56 is broken, paving the way for a smooth path to $1.
Related Articles


 Presale Ignites Excitement Amid 30x Predictions")

