The main tag of cryptocurrency price today Articles.
You can use the search box below to find what you need.
[wd_asp id=1]
The main tag of cryptocurrency price today Articles.
You can use the search box below to find what you need.
[wd_asp id=1]
However, the past few weeks have favored Solana’s current price momentum, helping the token regain its lost valuation and steadiness.
Also Read: Pepe Price Prediction: How High Can It Surge This Week?

As compared to other altcoins, Solana is currently trending and working its way towards the top. With Bitcoin rallying to $68k, the altcoin season is heading for a steady price rise, with Solana topping the chart due to its exponential ecosystem growth and progression.
The token has gained the maximum traction this season due to the plethora of on-chain activity that was spurred by the presale projects launched on SOL this year. Such projects were dubbed a boon for the ecosystem, injecting it with the influx of funds that eventually helped Solana establish credible price thresholds this season.
Per CoinCodex, Solana will continue its upward ascent, climbing to new highs this weekend. CC predicts that Solana will ultimately trade around $169 by June 2. The gradual to and fro will continue till June 5, after which SOL can encounter steadiness in its price momentum.
“The Solana price forecast for the next 30 days is a projection based on the positive and negative trends.SOL will be changing hands at $170.64 on June 5, 2024, gaining 0.89% in the process.”
The month of June looks particularly favorable for Solana, as the token may establish a new price of ATH per CoinCodex. The platform predicts the token will gain a massive 15% by June 29, helping SOL trade at the $191 price level.
Also Read: 3 Reasons Why Cardano (ADA) Is Bound For A Future Breakthrough
“The price of Solana may rise by 15.03% and reach $194.56 by June 28, 2024. Per our technical indicators, the current sentiment is bullish. While the Fear & Greed Index is showing 72 (greed). Solana recorded 14/30 (47%) green days with 9.77% price volatility over the last 30 days.”

XRP (XRP) is the native crypto of the XRP Ledger (XRPL). XRPL is an open-source public blockchain launched in 2011 by , a blockchain-based payment system. XRP is used as a transaction fee on the native network and a potential payment and investment option.
Ripple captivated the interest of investors with its distinct consensus protocol. It functions based on a federated consensus mechanism to validate transactions. The network allows any user to use the validation software and verify transactions according to their “unique node lists”. Thus, transactions are validated onto the ledger within 4-5 seconds at lower costs.

(Source: TradingView)
XRP (XRP) ranks 7th on CoinMarketCap in terms of its market capitalization. The overview of the XRP price prediction for 2024 is explained below with a daily time frame.

XRP/USDT Descending Triangle Pattern (Source: TradingView)
In the above chart, XRP (XRP) laid out a descending triangle pattern. The descending triangle is most commonly seen during downtrends and is often interpreted as a bearish signal. The ascending triangle pattern is reversed in the descending triangle pattern.
As the price continues to make lower highs, descending triangles indicate to investors and traders that sellers are more aggressive than buyers. When the price breaks out of the triangle in the direction of the overall trend, the pattern is complete.
Contrary to popular belief, a descending triangle can be bullish or bearish. A regular descending triangle pattern is traditionally regarded as a bearish chart pattern. A descending triangle pattern, on the other hand, can be bullish.
At the time of analysis, the price of XRP (XRP) was recorded at $0.5272. If the pattern trend continues, then the price of XRP might reach the resistance levels of $0.7161, $0.9364, and $1.4670. If the trend reverses, then the price of XRP may fall to the support of $0.4686, and $0.4565.
The chart given below elucidates the possible resistance and support levels of XRP (XRP) in 2024.

XRP/USDT Resistance and Support Levels (Source: TradingView)
From the above chart, we can analyze and identify the following as resistance and support levels of XRP (XRP) for 2024.

XRP Resistance & Support Levels
The technical analysis indicators such as Relative Volume (RVOL), Moving Average (MA), and Relative Strength Index (RSI) of (XRP) are shown in the chart below.

XRP/USDT RVOL, MA, RSI (Source: TradingView)
From the readings on the chart above, we can make the following inferences regarding the current XRP (XRP) market in 2024.

In the below chart, we analyze the strength and volatility of XRP (XRP) using the following technical analysis indicators — Average Directional Index (ADX) and Relative Volatility Index (RVI).

XRP/USDT ADX, RVI (Source: TradingView)
From the readings on the chart above, we can make the following inferences regarding the price momentum of XRP (XRP).

Let us now compare the price movements of XRP (XRP) with that of Bitcoin (BTC), and (ETH).

BTC Vs ETH Vs XRP Price Comparison (Source: TradingView)
From the above chart, we can interpret that the price action of XRP is similar to that of BTC and ETH. That is, when the price of BTC and ETH increases or decreases, the price of XRP also increases or decreases respectively.
With the help of the aforementioned technical analysis indicators and trend patterns, let us predict the price of XRP (XRP) between 2025, 2026, 2027, 2028, 2029, and 2030.

If XRP (XRP) establishes itself as a good investment in 2024, this year would be favorable to the cryptocurrency. In conclusion, the bullish XRP (XRP) price prediction for 2024 is $0.7381. Comparatively, if unfavorable sentiment is triggered, the bearish XRP (XRP) price prediction for 2024 is $0.4139.
If the market momentum and investors’ sentiment positively elevate, then XRP (XRP) might hit $2. Furthermore, with future upgrades and advancements in the XRP ecosystem, XRP might surpass its current all-time high (ATH) of $3.84 and mark its new ATH.
This content was originally published by our partners at The News Crypto.
In a recent video on the Cheeky Crypto YouTube channel, Nick mentioned that Cardano could rise to $38 at some point in the future, although he admitted that it won’t be anytime soon. He highlighted Cardano’s technological advancements as one factor that could drive the crypto token to such heights.
The crypto analyst further claimed that, despite criticisms about Cardano, the network is well-positioned to become one of the leading chains because it boasts a technology built with the future in mind. As such, he believes that ADA has a good chance to stand the test of time and rise to $38 no matter how long it takes to attain such a price target.
Interestingly, crypto expert Jason Appleton believes that Cardano could come close to this price target of $38 in this bull run. He once predicted that the crypto token would reach $32 in this market cycle. He claimed this price level is attainable in the “most prime of conditions by the peak of this bull market cycle.”
Meanwhile, Nick highlighted the range between $5 and $12 as his “conservative” price targets for Cardano. He believes that the crypto token could rally to such heights soon enough, considering that altcoins are well primed for significant gains, especially given the run that Bitcoin and, more recently, Ethereum have had.
He added that the news around the Spot Ethereum ETFs could trigger these moves for Cardano and other altcoins. Meanwhile, Nick is also optimistic that Cardano will soon have its own ETF following the approval of the Spot Ethereum ETFs. The launch of a Cardano ETF is another factor he believes could trigger such rallies for the crypto token.
Crypto analyst Dan Gambardello, the founder of Crypto Capital Venture, suggested in a recent X (formerly Twitter) post that patience is key as ADA holders await a significant rally from the crypto token. He reassured investors that Cardano would still have its bull run in this market cycle.
The analyst noted that Cardano was in a similar situation in the last cycle when it was down 90% from its all-time high (ATH). However, things turned around in the twinkle of an eye with the crypto token going on to enjoy a 3,000% price gain, rising from $0.10 to $3. He believes that Cardano could make such a run or even better in this cycle, noting that Cardano is more “secure, decentralized, and scalable,” this time around.

Featured image created with Dall.E, chart from Tradingview.com
Disclaimer: The opinions expressed by our writers are their own and do not represent the views of U.Today. The financial and market information provided on U.Today is intended for informational purposes only. U.Today is not liable for any financial losses incurred while trading cryptocurrencies. Conduct your own research by contacting financial experts before making any investment decisions. We believe that all content is accurate as of the date of publication, but certain offers mentioned may no longer be available.
The price of DOGE has declined by 3.15% over the last 24 hours.
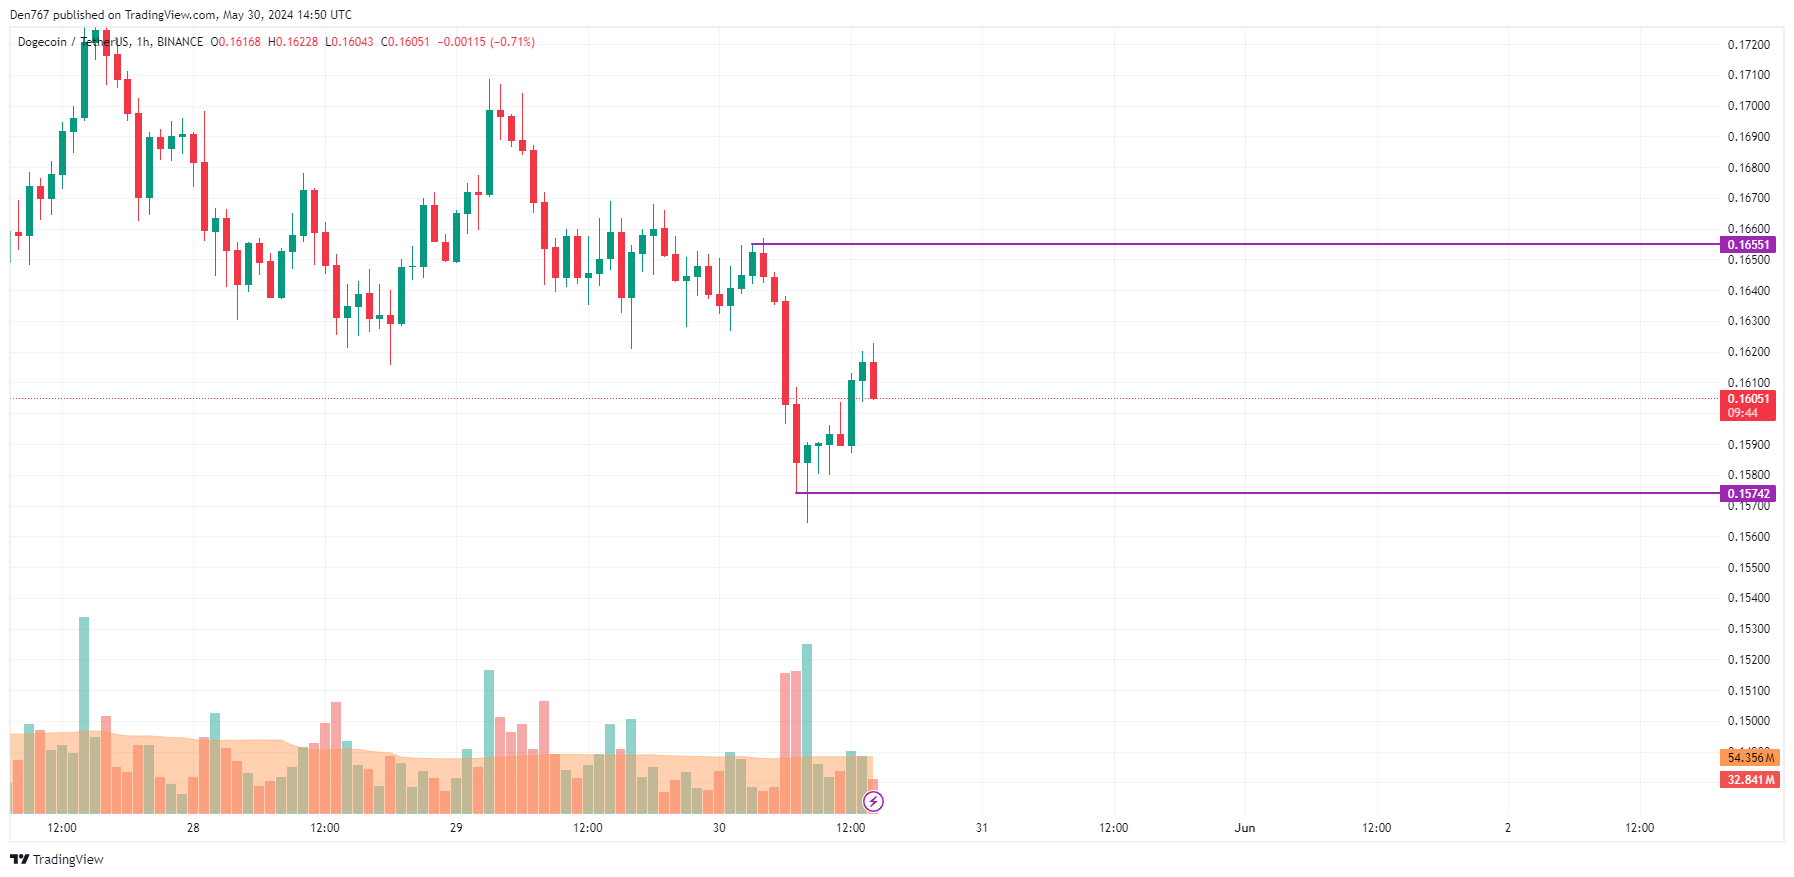
On the hourly chart, the rate of DOGE has made a false breakout of the local support level of $0.1574. However, if the daily bar closes near it, there is a chance to see a more profound decline to the $0.15 zone.
On the bigger time frame, neither bulls nor bears are dominating as the price is in the middle of a wide channel. In this case, traders are unlikely to see sharp moves any time soon.
All in all, consolidation in the range of $0.1550-$0.1650 is the most likely scenario.
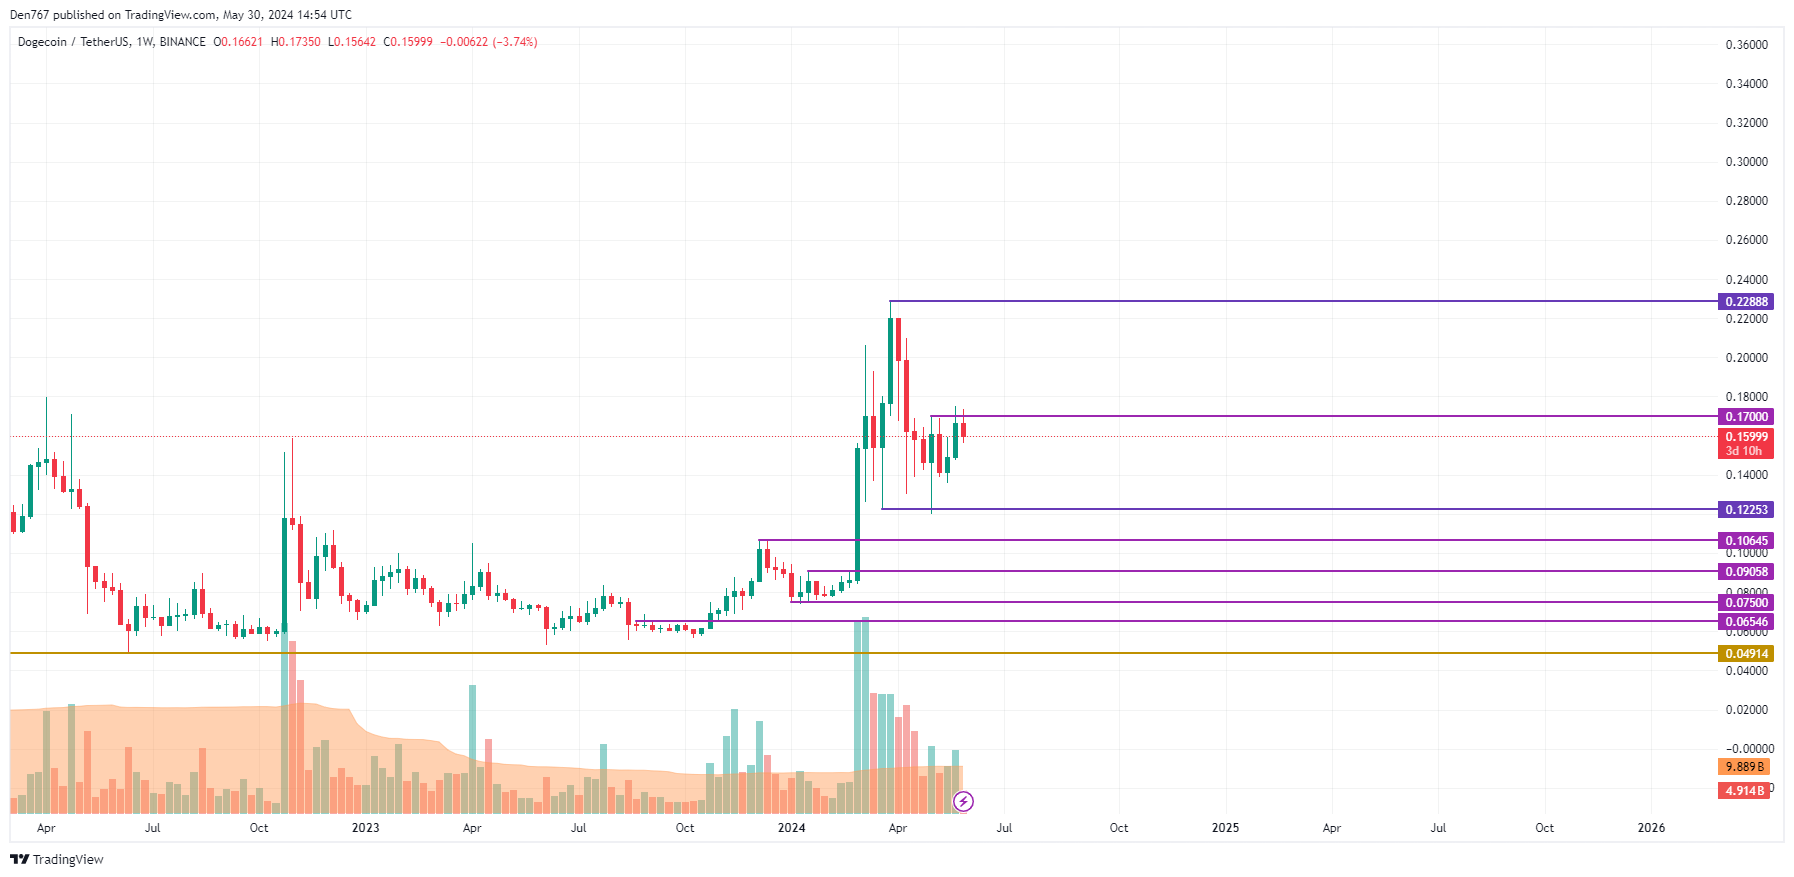
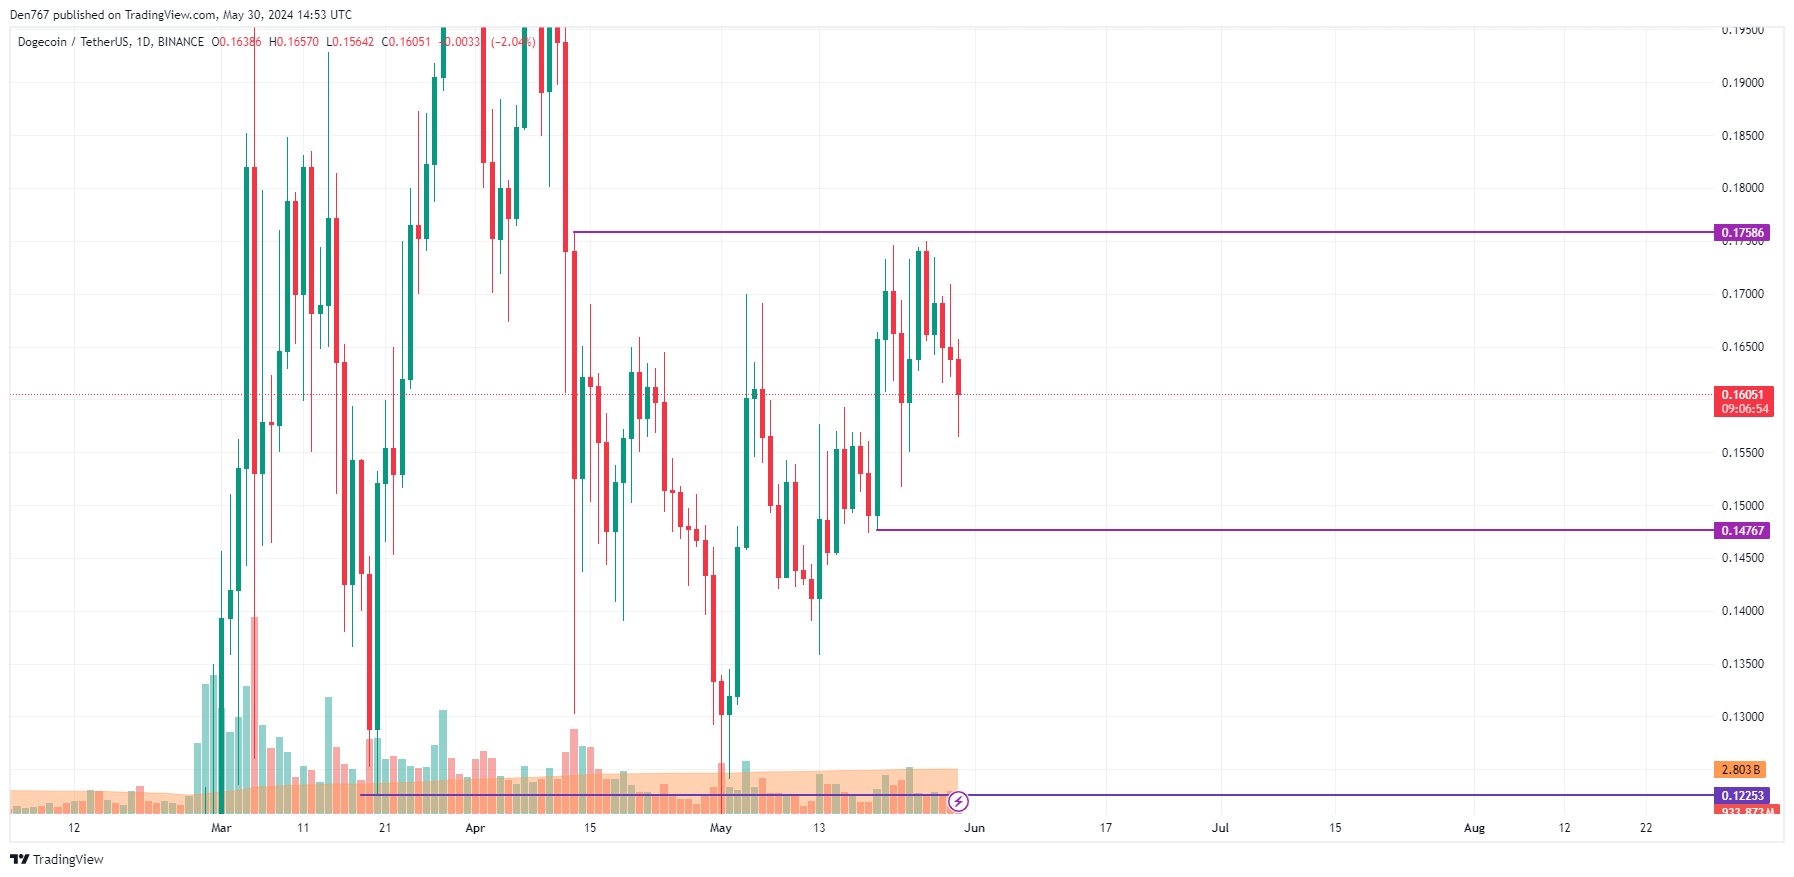
From the midterm point of view, the rate of DOGE has once again failed to fix above the resistance of $0.17. If the situation does not change by the end of the week, the correction may continue to $0.15.
DOGE is trading at $0.1599 at press time.
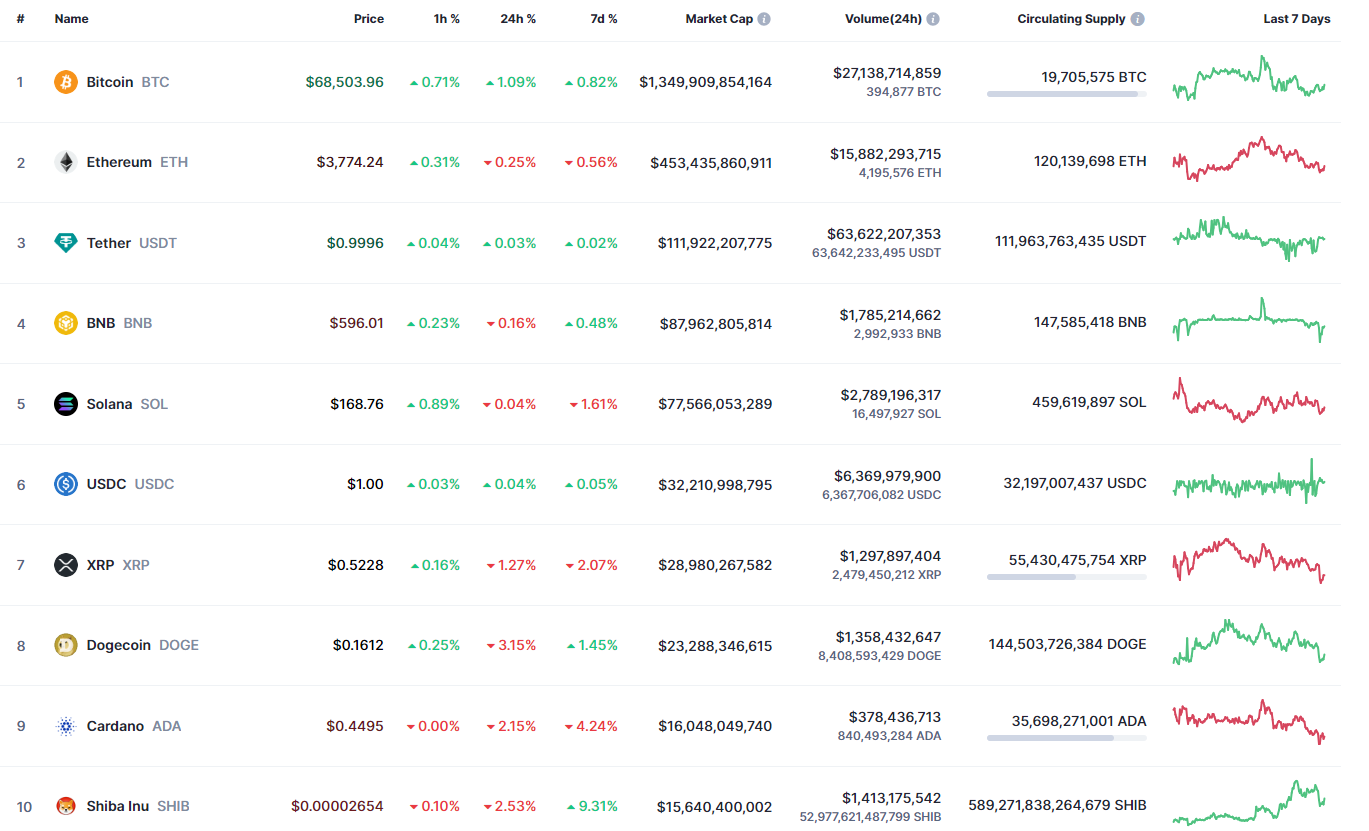
The market is again mostly red; however, there are some exceptions to the rule, according to CoinMarketCap.
The price of DOGE has declined by 3.15% over the last 24 hours.
All in all, consolidation in the range of $0.1550-$0.1650 is the most likely scenario.
DOGE is trading at $0.1599 at press time.
About the author
Denys Serhiichuk
The leading meme coins network, SOL, jumped today on 30 May from $176.8 to $165 with a shift from a bullish to a neutral zone technical and moving averages indicators.
The market movement is generally decided by multifactor scenarios, in this case, the fundamentals for Solana look all in favor.
Solana price has declined to -6.63% in the last 7 days trading in the range of $160 to $170 and currently trading at $165.5. Ethereum’s ETF approval uplifted Solana to surge near 21.7% in the last month despite a highly volatile market.
The price action is slightly corrected, reflecting high volatility, increased selling pressure, and downward moving volume. But SOL stands strong, maintained the wave over the previous support zones, and has shown resilience towards breaking to any direction intently.
The current technical indications display a breakout is on the foothill for Solana on the direction decided by sellers.
If the current price continues to break out below $160, the price will follow the lead toward the $150 zone. Conversely, the increased buying pressure will reclaim the $170 and fuel up the upward rally toward the $185 and $200.
The 4-hour SOL/USDT Chat reveals a chart pattern moving sideways with a mixed outlook. RSI reading at 50 shows price trading in a neutral zone with no overbought or oversold condition. While MACD also represents a crossover in neutral territory.
The Sideway chart pattern is usually a neutral zone for price and is best considered for traders to place positions.
The overall Solana trend is bullish, this correction phase has to be monitored cautiously. Followed by market sentiment the price seems to continue the sideway wave for a few more sessions before retesting $160 to create a buy opportunity Dip and then pull back the uptrend to $180+ in June 2024.
Also Check Out : After 150% Surge, NOT Token Price Aims 90% Extended Run
The crypto markets have given much cause for excitement to investors and traders throughout 2024. The year has featured significant rallies for many of the major cryptocurrencies, the approvals of both Bitcoin (BTC) and Ethereum (ETH) exchange-traded funds (ETFs), and the BTC halving event in April.
One token that has remained largely absent from the bull run and is yet also generating substantial optimism – in no small part due to the recent developments in the long-standing legal battle between Ripple Labs and the Securities and Exchange Commission (SEC) – has been XRP.
With the current trends and developments – both pertaining to XRP and the broader crypto market – in mind, Finbold decided to examine how they are reflected in the price predictions of the many platforms that leverage artificial intelligence (AI) technology to – along with other uses – assess the likely future prices of assets.
One platform that relies on XRP’s previous price movements, chart patterns, and other relevant developments on the token’s path estimates that its price will stand at $0.881514 at the tail end of the year. The algorithm also forecasts substantial volatility for XRP and considers it likely that there will be a spike to and a peak at $1.44 in November.
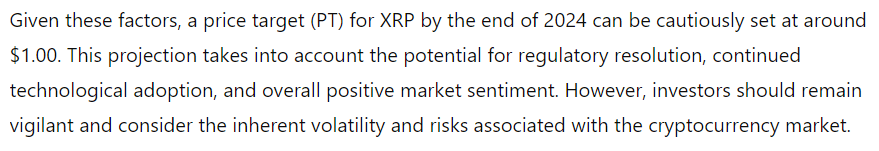
Meanwhile, the latest model of OpenAI’s flagship AI platform – ChatGPT-4o – considers it highly likely that XRP will stand at $1 on December 31. ChatGPT stated that the forecast takes into account the possibility of a favorable legal resolution, the overall market sentiment, and the high likelihood of continued technological advancement.
Finally, Google’s (NASDAQ: GOOGL) Gemini – once known as Bard – is significantly less bullish. Unlike ChatGPT, Gemini pointed out that the legal battle between Ripple and the SEC remains a major hurdle but also acknowledged XRP’s overall resilience and potential. The AI ultimately decided that the most likely price for the token at the end of 2024 is $0.58.

Should any of the AI forecasts come true, they would constitute a significant upside for the token given that XRP price today stands at $0.53 after a 13.43% decline since the start of the year.
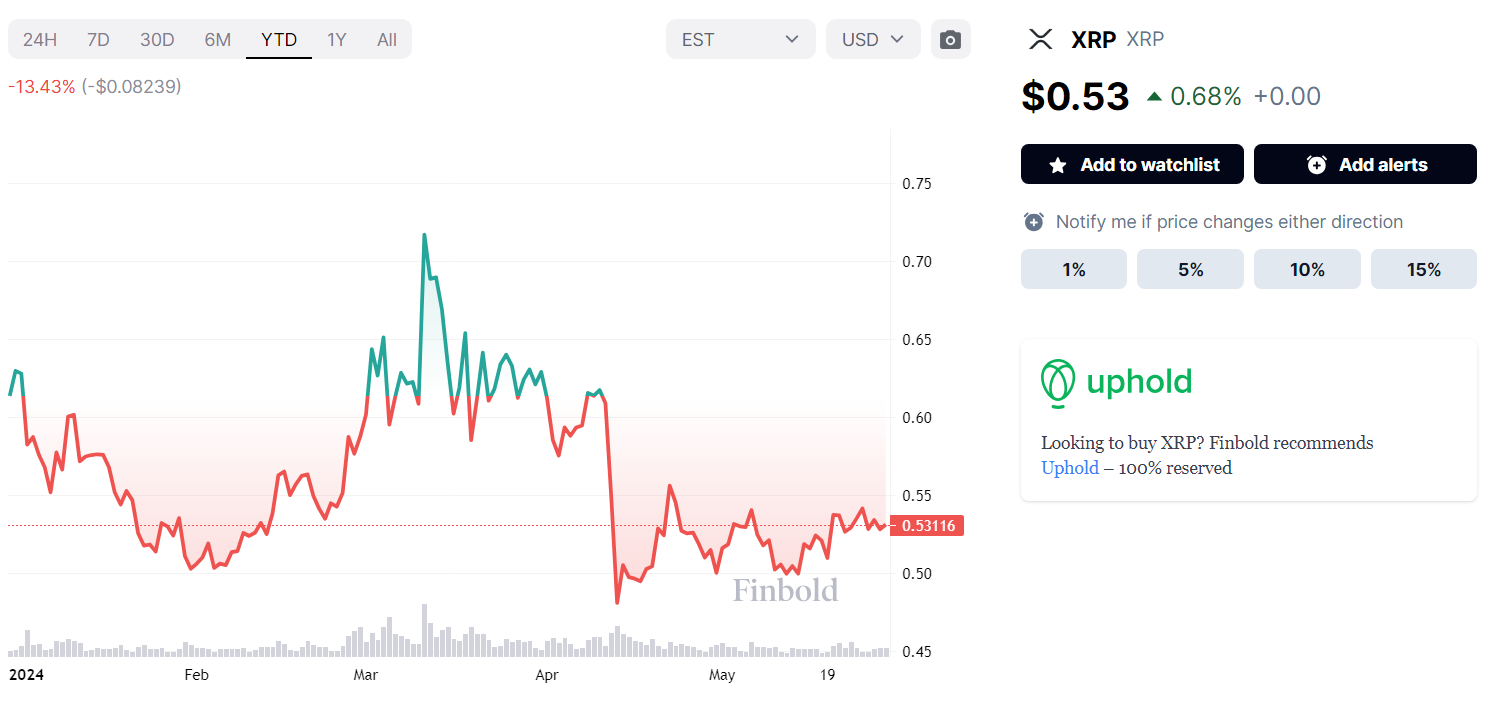
Indeed, XRP’s legal issues are well-reflected in its price chart, given that it is one of the few major cryptocurrencies to have declined since the beginning of 2024.
Additionally, the 12-month chart reveals the long-standing depressing effect SEC’s pressure has been having, given that despite multiple sharp yet brief rallies, the token is a mere 1.66% above the price it was at 52 weeks ago.
Disclaimer: The content on this site should not be considered investment advice. Investing is speculative. When investing, your capital is at risk.
Gain detailed insights on $WEN via an extensive daily technical analysis, followed by the coming days of the month, upcoming months, and yearly forecast tables derived from our AI/ML-based predictive models:
Dogs and frogs have dominated the memecoin market for a considerable time. Now, with $WEN—the new Solana (SOL)-based memecoin, cats have entered the market. Thus, the Wen price prediction for 2024 presents an opportunity to analyze the potential of this new token.
An analysis of the daily chart revealed that the period began with the price falling below $0.00035. Early attempts to flip this level succeeded briefly before losing momentum to bearish pressure. Continued declines pushed the memecoin to graze $0.00017.
The bulls tried to initiate a recovery, which elevated the price above $0.00021. The wavering attempt managed to push the token to test the support-turned-resistance at $0.00026. Nonetheless, the selling pressure was too strong to overcome, precipitating another series of drops.
This decisively turned $0.00021 into a barrier for any upswings. Attempts to test this level in early May faced a similar outcome as the price depreciated, bottoming out at the lowest chart support of $0.00015.
Despite losing their gains, the buyers remained resilient and reclaimed $0.00017 mid-month. For now, $WEN has managed to hold on to this level. At the time of writing, the token had slightly recovered to trade at $0.00018.
Current dynamics suggest that bulls need to stabilize above $0.00021 to regain the upper hand in the market. If buying pressure intensifies, it could drive the price to test the $0.00035 mark and possibly ascend toward the all-time high (ATH). A speculative extension to $0.00080 is conceivable, though it would require significant time and overcoming $0.00051 to materialize.
Given the market’s slight bearish condition, the current support is under threat. Should it falter, the price might fall to the lowest floor. Increased selling pressure can even drive the token as low as $0.00007.
Notwithstanding, the predictive models forecast an optimistic future for the cat-themed token. According to the predictions, $WEN can average a price point of $0.01 within the next five years and is expected to grow to $0.9 in 2035.
XRP price prediction: The Ripple vs SEC lawsuit is far from over as renowned crypto lawyer John Deaton turns his guns on Gary Gensler, the current chair of the Securities and Exchange Commission (SEC). As Deaton intensifies his criticism of the agency and its leadership, XRP price consolidates respecting support above $0.52.
The prominent cross-border money remittance token fell 0.2% in 24 hours to $0.529. Its value remains relatively unchanged in a week, emphasizing the lack of direction.
John Deaton, who has taken part in various crypto-related lawsuits, has fired at Gensler for the agency’s actions against Coinbase, LBRY, and Ripple. The lawyer argues that the pursuit of the companies’ executives speaks volumes regarding an unhealthy regulatory framework that continues to set the industry back.
The SEC believes some digital assets are securities and therefore fall under its oversight. Because of this stance, the regulator has launched multiple lawsuits against the firms it believes are violating US securities laws.
Deaton hinged his criticism on a recent ruling that saw the SEC penalized $1.75 million due to misleading conduct in the Debt Box Case. In line with this lawsuit and the subsequent fine, Deaton and others in the crypto community say that the SEC’s actions are extremely aggressive not to mention financially crippling.
Deaton further narrowed his argument on the LBRY case in which a representative of the regulator was publicly quoted saying that the firm will be crippled with legal fees. This according to the attorney sets a precedent of bad faith and to a great extent, stifles innovation.
I am very proud of the fact that I was one of the very first people to battle @GaryGensler’s @SECGov, serving as amici curiae in the @Ripple, @LBRYcom and @coinbase cases. I sued the SEC on January 1, 2021 and for more than three years I argued lawyers at the SEC were… https://t.co/ssOgWzgGuK
— John E Deaton (@JohnEDeaton1) May 28, 2024
Deaton believes the crypto industry is under attack by bad leadership from regulators like the SEC.
In addition to demand for Gensler’s resignation, the lawyer recommended the former chair of the Commodity Futures and Trading Commission (CFTC), Chris Giancarlo take over.
XRP price hovered below all three short-term Exponential Moving Averages (EMAS), including the 20-day, 50-day, and 200-day on the four-hour chart. Overhead pressure has continues to intensify after the token hit a wall at $0.54 last week.
Two key levels may determine if XRP price will see a bullish or bearish outcome. The first is the ascending channel’s lower support boundary and the buyer congestion at $0.52. Breaching these two levels would leave XRP defenseless and increase the chances of a correction to $0.5 and below.
The Relative Strength Index (RSI) backs the potential bearish outcome as it slides below 50. Should the drop continue, declines in XRP value will also intensify.
On the other hand, a breach of resistance at $0.54 would affirm the bulls’ growing presence in the market. Should XRP break free of resistance at $0.7, the path of least resistance will flip upward, paving the way for a larger move to $1.
Related Articles
The market cap has increased slightly by 1.44%, now at $77.87 billion, indicating a strong market position despite the price decline. The 24-hour trading volume also saw a modest rise of 1.56%, reaching $3.166 million, which shows consistent trading activity among investors.
Over the past week, the Solana price has decreased more than 5%, indicating a potential bearish trend in the market. The SOL has been trading in a range of $160 to $168, reflecting increased volatility and cautious sentiment among investors.
With Ethereum ETF approval hype and a slight market crash, Solana surged by 23% last month, showcasing its resilience in a volatile market. The Solana price has been trading bullish, breaking through resistance levels and maintaining strong support despite slight corrections, indicating investor confidence and robust underlying network performance.
The online payments giant PayPal has expanded its stablecoin, PYUSD, to the Solana network. Initially launched on the Ethereum blockchain, this expansion signifies a major step for Solana’s adoption. By integrating PYUSD, Solana gains significant credibility in the payments processing industry.
The collaboration between PayPal and Solana announced on Wednesday, 29th May 2024, aims to boost Solana’s presence among PayPal’s millions of users. This strategic move highlights the growing importance of blockchain technology in mainstream financial services.
With the current market fluctuations, Solana (SOL) faces potential downward pressure. If the bearish trend strengthens, the price of SOL could fall toward the $160 support level. Continuation of this trend might lead to a dip to $150, indicating a significant shift in market sentiment.
Conversely, if bullish momentum returns, SOL could rise to the $170 level. With increased buying pressure, the price might surge above $180, reaching $200 in the next bullish run. This potential movement underscores Solana’s market performance’s volatility and dynamic nature.
The daily technical indicators for the Solana market show a mixed outlook. The Relative Strength Index (RSI) is currently at 54.63, hovering above the neutral 50 mark, indicating neither overbought nor oversold conditions. This suggests a potential consolidation phase, with the market preparing for its next directional move.
The Bollinger Bands on the daily chart for Solana indicate a period of moderate volatility. The upper Bollinger Band is 189, while the lower Bollinger Band stands at 138.
The Moving Average Convergence Divergence (MACD) histogram shows a slight bullish divergence, with the MACD line above the signal line by a small margin. Although the difference is minimal, this suggests some upward momentum, indicating cautious optimism among traders.
Related Articles


 Price Down Today?")


