Important DisclaimersFXEmpire is owned and operated by Empire Media Network LTD., Company Registration Number 514641786, registered at 7 Jabotinsky Road, Ramat Gan 5252007, Israel. The content provided on this website includes general news and publications, our personal analysis and opinions, and materials provided by third parties. This content is intended for educational and research purposes only. It does not constitute, and should not be interpreted as, a recommendation or advice to take any action, including making any investment or purchasing any product. Before making any financial decision, you should conduct your own due diligence, exercise your own discretion, and consult with competent advisors. The content on this website is not personally directed to you, and we do not take into account your individual financial situation or needs. The information contained on this website is not necessarily provided in real time, nor is it guaranteed to be accurate. Prices displayed may be provided by market makers and not by exchanges. Any trading or other financial decision you make is entirely your own responsibility, and you must not rely solely on any information provided through the website. FXEmpire does not provide any warranty regarding the accuracy, completeness, or reliability of any information contained on the website and shall bear no responsibility for any trading losses you may incur as a result of using such information. The website may include advertisements and other promotional content. FXEmpire may receive compensation from third parties in connection with such content. FXEmpire does not endorse, recommend, or assume responsibility for the use of any third-party services or websites. Empire Media Network LTD., its employees, officers, subsidiaries, and affiliates shall not be liable for any loss or damage resulting from your use of the website or reliance on the information provided herein.Risk DisclaimersThis website contains information about cryptocurrencies, contracts for difference (CFDs), and other financial instruments, as well as about brokers, exchanges, and other entities trading in such instruments. Both cryptocurrencies and CFDs are complex instruments and involve a high risk of losing money. You should carefully consider whether you understand how these instruments work and whether you can afford to take the high risk of losing your money. FX Empire encourages you to conduct your own research before making any investment decision and to avoid investing in any financial instrument unless you fully understand how it works and the risks involved.
Cryptocurrency
markets are trading under pressure Wednesday as Bitcoin holds near $87,700,
down a marginal 0.2%, while Ethereum, XRP and Dogecoin face modest losses amid
regulatory uncertainty and consolidation fatigue. The entire crypto market is
stuck in a holding pattern ahead of the holiday period, with 75% of the top 100
coins now trading below key moving averages.
In this article, I answer
the question of why cryptocurrencies are falling and analyze the BTC/USDT,
ETH/USDT, XRP/USDT, and DOGE/USDT charts, drawing on more than ten years of
experience as a trader and analyst.
“The decline also coincided
with news that the U.S. Senate Banking Committee had delayed work on the
long-awaited bill addressing the structure of the cryptocurrency market,
postponing any hearings until early 2026,” explains Michał Stajniak, an analyst
at XTB. Although XTB is primarily known as a CFD broker, it
is currently working on introducing spot cryptocurrency trading.
The
committee failed to finalize a bipartisan agreement before the end of the year.
The office of Chairman Tim Scott emphasized that negotiations with Democrats
are still ongoing, but issues related to financial stability, market integrity,
and ethical standards continue to slow progress.
Adding
complexity, 2026 begins with a tight legislative calendar focused on government
funding, followed by November midterm elections that could push crypto
legislation even further back.
Why Bitcoin Price Is Going
Down? BTC/USDT Technical Analysis
Bitcoin (BTC)
on Wednesday costs $87,700 and is losing a negligible 0.2%, continuing to hold
within the same consolidation range it entered in mid-November. According to my
technical analysis, the resistance sits in the $92,000–94,000 range, reinforced
by 100% Fibonacci retracement and the 50-day exponential moving average, while
the lower boundary extends from $85,600 to $84,000, providing a temporary rest
stop for bulls.
Why Bitcoin price is going down today? Source: Tradingview.com
What can we
expect in the coming days before the holidays? I don’t anticipate anything
spectacular, rather a continuation of this sideways trend followed by further
downside, and only a reset and washout near this year’s lows will allow for a
stronger rally and re-accumulation at lower prices, with a medium-term return
to all-time highs and higher.
Ethereum Price Still Under
Death Cross Signal
The chart
of the second-largest cryptocurrency by market cap, Ethereum (ETH), looks very
similar to Bitcoin’s chart. We also see a local range here and a lack of
conviction from buyers and sellers about which direction to move.
At the
moment, ETH is losing for a fourth consecutive session, though the declines are
modest at 0.5% today, and the cryptocurrency is changing hands at $2,950.
The main
resistance zone is located between $3,350 and $3,435, supported by a grid of
moving averages, while support is the 61.8% Fibonacci retracement and
November-December lows around the $2,700 level. Here too I maintain a bearish
stance due to the ongoing downtrend, and I do not rule out a move toward
$2,200, the June low, and ultimately even $1,400, the April minimum.
Why Ethereum price is going down today? Source: Tradingview.com
XRP Price Is Also Dropping
For one XRP you currently pay $1.92, and the quotes are standing for another session at the
height of a local support level marked by November lows, last tested also in
June. Once again, as on the two previous charts, we see roughly a month-long
consolidation whose upper boundary is the current range between $2.20 and
$2.30, additionally supported by the 50-day moving average.
The
arrangement of moving averages is practically the same, with a death cross
drawn in November and a dominant downtrend. A breakout of the local support
would open the way to the April lows near $1.61, and further to $1.25 where
price was last located during the October flash crash and earlier over a year
ago in late November 2024.
Why XRP price is going down today? Source: Tradingview.com
Why Is Dogecoin So
Volatile?
For dessert
I saved the precursor of the meme coin market, namely Dogecoin (DOGE), which has
already permanently broken the support zone I set earlier in the year around
0.14 and 0.15 dollars, as well as its deepening from the beginning of this
month.
Dogecoin
trades near $0.13 Wednesday, illustrating high-beta, sentiment-driven behavior
where thin liquidity and fading risk appetite drive exaggerated percentage
moves.
Why Dogecoin price is going down today? Source: Tradingview.com
How Low Can Crypto Go?
“Most
are surprised by the lack of follow-through despite so many positive
catalysts,” said Pratik Kala, a portfolio manager at hedge fund Apollo
Crypto. This sentiment reflects broader market frustration with the inability
of Bitcoin and altcoins to break higher despite constructive regulatory
developments and ETF approvals.
If current
support breaks, the next major zone for Bitcoin lies near the $74,000 area I
have outlined. For Ethereum, a deeper correction toward $2,200 or even $1,400
cannot be ruled out if macro conditions worsen. For XRP and Dogecoin, downside
can be amplified due to thinner liquidity and higher volatility, with targets
at $1.61 and $0.09 respectively.
Crypto Price Analysis, FAQ
Why is Bitcoin falling?
Bitcoin is
falling because it remains trapped in a month-long consolidation range with
resistance at $92,000-$94,000 and weakening momentum signaled by a death cross
formation on the daily chart. According to my technical analysis, BTC is
targeting a move down to this year’s lows around $74,000 as the sideways
pattern resolves to the downside.
Why is Ethereum crashing?
Ethereum is
not crashing but declining modestly for a fourth consecutive session, down 0.5%
to $2,950, as it mirrors Bitcoin’s sideways consolidation pattern. The bearish
technical setup includes resistance at $3,350-$3,435 and support at $2,700,
with my analysis targeting potential moves toward $2,200 or even $1,400 if the
downtrend continues.
Why is XRP price dropping?
XRP is
dropping because it’s testing local support at November lows near $1.90 after
failing to break resistance at $2.20-$2.30, while regulatory delays add
uncertainty. My technical analysis shows a death cross formation and dominant
downtrend that could push XRP toward $1.61 and ultimately $1.25 if current
support breaks.
Why is Dogecoin going
down?
Dogecoin is
going down because it has already broken key support zones at $0.14-$0.15 and
is now testing April lows as a high-beta meme coin amplifies broader market
weakness. Trading near $0.13, DOGE faces potential further decline toward $0.09
if sentiment remains negative and liquidity continues to thin.
Will crypto recover?
Crypto can
recover if equity markets stabilize, central banks provide clearer easing
guidance, and forced liquidations subside, allowing spot buyers and long-term
holders to return. According to my analysis, a washout near this year’s lows
would create healthier conditions for re-accumulation and a medium-term return
to all-time highs.
SOL trades below key EMAs, confirming bearish momentum and limiting near-term recovery
Cooling futures open interest signals deleveraging, reducing upside despite active activity
Persistent spot outflows suggest distribution, raising risk of deeper support tests
Solana’s price action has entered a critical phase as traders reassess short-term risk on the 4-hour chart. Recent market data shows SOL/USDT trading under pressure after failing to sustain earlier rebounds. Consequently, technical signals, derivatives positioning, and spot flow data now point to a cautious outlook. Market participants continue to monitor whether current support can stabilize price or trigger deeper losses.
SOL Price Trend Signals Growing Short-Term Pressure
On the 4-hour timeframe, Solana shows a clear corrective structure. Price trades below the 20, 50, 100, and 200 exponential movin…
MATIC price prediction suggests potential recovery to $0.45 by January 2026, though immediate outlook remains cautious with $0.35 support critical for bulls.
Polygon’s MATIC token presents a complex technical picture as we approach the end of 2025, with current bearish momentum creating both risks and opportunities for strategic investors. Our comprehensive MATIC price prediction analysis reveals divergent short-term and medium-term outlooks that demand careful consideration.
MATIC Price Prediction Summary
• MATIC short-term target (1 week): $0.35-$0.40 range (-7.9% to +5.3%)
• Polygon medium-term forecast (1 month): $0.38-$0.45 range with potential 18% upside
• Key level to break for bullish continuation: $0.43 (SMA 20 resistance)
• Critical support if bearish: $0.35 immediate support, $0.33 strong support
Recent Polygon Price Predictions from Analysts
The analyst community shows remarkably conservative expectations for MATIC, with most Polygon forecast models suggesting limited upside potential through 2026. CoinCodex’s recent predictions cluster around the $0.11-$0.12 range, representing a significant disconnect from current market pricing at $0.38.
This stark divergence between current technical levels and analyst projections creates an interesting contrarian opportunity. Benzinga’s more optimistic $0.717 MATIC price target by 2030 aligns better with Polygon’s fundamental value proposition as Ethereum’s leading Layer-2 solution, though this represents a much longer investment horizon.
The consensus appears overly pessimistic given Polygon’s established market position and growing developer adoption. Our analysis suggests these predictions may underestimate MATIC’s recovery potential from current oversold conditions.
MATIC Technical Analysis: Setting Up for Potential Reversal
Current Polygon technical analysis reveals a token testing critical support levels after a prolonged decline from its 52-week high of $1.27. The RSI reading of 38.00 places MATIC in neutral territory, though closer to oversold conditions that historically precede bounce opportunities.
The MACD histogram at -0.0045 confirms bearish momentum remains intact, but the relatively shallow negative reading suggests selling pressure may be diminishing. MATIC’s position at 0.29 within the Bollinger Bands indicates the token trades in the lower portion of its recent range, often a precursor to mean reversion moves.
Volume analysis shows declining participation at $1.07 million on Binance, typical during consolidation phases before directional breakouts. The confluence of technical factors suggests MATIC approaches an inflection point where either support holds and initiates recovery, or breaks lower toward more significant support zones.
Polygon Price Targets: Bull and Bear Scenarios
Bullish Case for MATIC
Our primary MATIC price target sits at $0.45, representing the SMA 50 level that served as support during previous market cycles. This target offers approximately 18% upside potential and aligns with technical retracement levels.
For this bullish scenario to unfold, MATIC must first reclaim the $0.43 level (SMA 20), which has acted as dynamic resistance. A sustained move above this level would likely trigger additional buying interest and target the $0.50-$0.56 resistance zone defined by the upper Bollinger Band.
The weekly timeframe supports this optimistic view, with MATIC holding above key long-term support levels despite recent weakness.
Bearish Risk for Polygon
The primary risk to our constructive Polygon forecast centers on a breakdown below $0.35 immediate support. Such a move would likely accelerate selling toward the $0.33 strong support level, representing potential downside of 13-15%.
A more severe scenario targeting the 52-week low near $0.37 would invalidate the near-term bullish thesis and suggest continuation of the broader downtrend. This bearish case gains probability if Bitcoin and broader crypto markets experience additional weakness.
Should You Buy MATIC Now? Entry Strategy
Current levels present a reasonable risk-reward setup for those seeking exposure to Polygon’s Layer-2 narrative. Our recommended buy or sell MATIC strategy involves scaling into positions between $0.37-$0.40, with strict risk management below $0.33.
Conservative investors should wait for confirmation above $0.43 before initiating positions, sacrificing some upside for reduced downside risk. More aggressive traders can begin accumulating current levels while maintaining 15-20% position sizing to allow for additional purchases if MATIC tests lower support.
Stop-loss placement below $0.32 provides protection against major breakdown scenarios while allowing room for normal market volatility.
MATIC Price Prediction Conclusion
Our MATIC price prediction anticipates a gradual recovery toward $0.45 over the next 4-6 weeks, representing a medium confidence forecast based on current technical positioning. This Polygon forecast relies on broader crypto market stability and successful defense of the $0.35 support zone.
Key indicators to monitor include RSI movement above 45 (confirming momentum shift), MACD histogram turning positive, and daily volume expansion above $2 million on sustained moves higher. Failure to hold $0.35 support would necessitate reassessment of our bullish medium-term outlook.
The timeline for this prediction extends through January 2026, with initial confirmation signals expected within the next 7-10 trading days. Despite current bearish momentum, MATIC’s oversold conditions and strong fundamental backdrop support our constructive price target outlook.
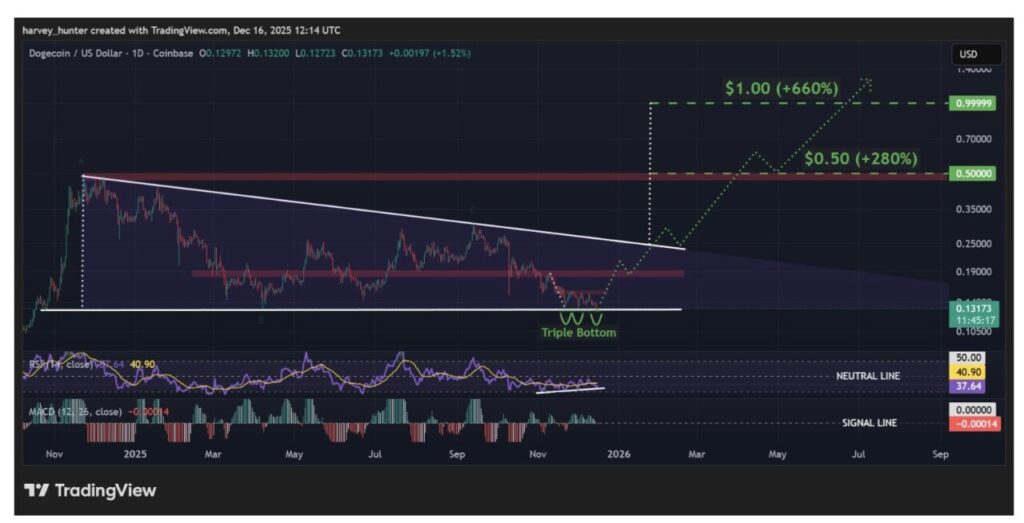
Jakarta, Pintu News – Although Dogecoin has deviated from its historical upward pattern, there is an important demand zone that could be a turning point and drive a bullish rally later in the year. Dogecoin price predictions still leave room for a strong rebound before the year ends.
So, how is the Dogecoin price moving today?
Dogecoin Price Rises 2.00% within 24 Hours
Source: Pintu Market
As of December 17, 2025, Dogecoin posted a 2% gain over the past 24 hours, trading at $0.1314, or approximately IDR 2,188. Over the same period, DOGE fluctuated between IDR 2,129 and IDR 2,211.
At the time of writing, Dogecoin’s market capitalization is estimated at around IDR 335.12 trillion, with a 24-hour trading volume of roughly IDR 16.69 trillion.
Dogecoin is currently testing the $0.13 level which could potentially be the cornerstone of a price rally, with demand likely to return if the year-end bullish trend actually materializes.
A popular analyst under the pseudonym BitGur via the X platform highlighted this pattern, and the green candle that appeared today could be a confirmation that the lowest price has been reached, as buying interest in this meme coin returns.
$DOGE is holding a key demand zone after a prolonged downtrend, showing signs of base formation.
As long as price stays above the current support, a relief bounce toward the marked resistance zone is possible. pic.twitter.com/gOSm3C73PM
The bottom formation mentioned by Bitgur has evolved into a triple bottom pattern, which is a strong reversal structure characterized by three consecutive touches of the basic trendline.
Based on this pattern, analysts expect a reversal of the downward trend over the past two months, with a target of returning to the $0.182 level – a 40% increase.
Historically, the last quarter of the year tends to provide a fairly positive performance for the Dogecoin price. However, 2025 seems to deviate from this pattern as it hasn’t shown a single green month so far.
Source: CryptoRank
So far, the Dogecoin price has weakened by 10.6% during the month of December, reinforcing the ongoing downward trend.
Even so, the analysis from Bitgur could be the turning point that marks December as a green month and maintains the historical pattern that the fourth quarter has at least one month with rising prices.
Dogecoin Price Prediction: December May Be Just the Beginning
The demand zone at $0.13 also coincides with the lower limit of the descending triangle pattern that has been forming for a year, and the triple bottom pattern could be a trigger for a move towards a breakout.
If the triple bottom pattern is successfully confirmed with a clean break above the $0.155 neckline, then the $0.182 target could be a higher and stronger foothold for a further breakout push.
The momentum indicators are still showing bullish tendencies. The RSI indicator continues to form higher lows, pointing towards the neutral line – this indicates buying pressure is slowly building behind the price movement.
Meanwhile, the MACD that had formed a “death cross” below the signal line seems to be temporary, as selling pressure seems to be weakening and losing control of the current trend.
If there is a clean breakout from the triangle pattern, then the upside target of around 260% towards the previous high of $0.50 could be achieved – potentially even towards the full target of $1, which would mean a jump of up to 680%.
However, a move of this magnitude is likely to depend on favorable market conditions – for example, a policy change from the US Fed or the resumption of the quantitative easing (QE) program in 2026 to boost appetite for risky assets.
For now, BitGur’s analysis is a noteworthy scenario in a potential year-end rally – although everything depends on the price’s ability to hold above the $0.13 level.
That’s the latest information about crypto. Follow us on Google News to get the latest crypto news about crypto projects and blockchain technology. Also, learn crypto from scratch with complete discussion through Pintu Academy and stay up-to-date with the latest crypto market such as bitcoin price today, xrp coin price today, dogecoin and other crypto asset prices through Pintu Market.
Enjoy an easy and secure crypto trading experience by downloading Pintu crypto app via Google Play Store or App Store now. Also, get a web trading experience with various advanced trading tools such as pro charting, various types of order types, and portfolio tracker only at Pintu Pro.
*Disclaimer
This content aims to enrich readers’ information. Pintu collects this information from various relevant sources and is not influenced by outside parties. Note that an asset’s past performance does not determine its projected future performance. Crypto trading activities have high risk and volatility, always do your own research and use cold cash before investing. All activities of buying and selling bitcoin and other crypto asset investments are the responsibility of the reader.
Solana price is consolidating above the critical $120 support zone, with compressed price action and conflicting technical signals leaving traders focused on whether a breakdown or reversal comes next.
Solana price is consolidating near a critical demand zone after an extended corrective phase, with price action showing increasing compression around the $120–$130 range.
Solana current price is $126.95, down -4.33% in the last 24 hours. Source: Brave New Coin
According to Brave New Coin data, Solana is trading near $126.95, down modestly on the day but still holding above a long-standing support band that has repeatedly defined medium-term market structure. As price tightens within this range, traders are increasingly focused on whether SOL can continue to hold its key support levels.
Range Compression Keeps $120–$130 in Focus
A chart from ChiefraT shows Solana continuing to respect a clearly defined horizontal range, with $120–$125 acting as demand and $145–$146 capping upside. Price has revisited the lower boundary multiple times in recent weeks without follow-through selling, reinforcing this zone as a decisive support level.
Solana continues to trade within a well-defined range as volatility compresses. Source: ChiefraT via X
This repeated defense suggests that sellers are struggling to gain momentum below $120, while buyers remain active enough to prevent a clean breakdown. Until SOL decisively exits this range, the market remains in a neutral holding pattern.
Fake-Out Risk Grows as Head-and-Shoulders Becomes Obvious
Elja Boom highlighted a key behavioral dynamic developing on Solana’s chart: the emergence of a widely visible bearish head-and-shoulders structure. Rather than viewing this as a guaranteed breakdown signal, Elja argues that overly obvious patterns often lead to fake-outs designed to flush late sellers.
Obvious bearish structures increase the probability of a shakeout rather than continuation. Source: Elja Boom via X
His outlook suggests that any brief move below the neckline could serve as a liquidity grab, potentially setting the stage for a sharp reversal once selling pressure exhausts. This aligns with SOL’s repeated failure to extend losses despite multiple tests of the same demand region.
Short-Term Rejection Risk Builds Near $129–$132
From a short-term trading perspective, Crypto Tony maintains a bearish outlook on Solana as long as the price fails to reclaim the $129–$132 resistance band. His chart highlights this zone as a key rejection area, where previous bounce attempts have repeatedly stalled.
According to Tony, a clean rejection from this level keeps downside pressure active, with $120–$122 remaining the primary downside target. A breakdown below this support would likely accelerate selling toward the $112–$108 liquidity pocket, which aligns with prior consolidation lows. Until SOL can flip $132 into support, his bias remains firmly tilted toward continuation rather than recovery.
SOL faces repeated rejection risk near $129, keeping downside targets active. Source: Crypto Tony via X
Weekly Structure Weakens as SOL Trades Below EMA200
On higher timeframes, Trader Koala’s analysis reinforces a structurally bearish outlook. His weekly chart shows Solana closing below the weekly EMA200, a level that historically acts as a dividing line between bull and bear phases.
SOL remains structurally weak below the weekly EMA200. Source: Trader Koala via X
Solana chart identifies $120–$118 as the last meaningful weekly support before price risks sliding into the $89–$101 macro demand zone, which he labels as the next major landing area if selling pressure persists. In his broader projection, Koala suggests that a full market reset could eventually drag SOL into the $30–$50 region, though he emphasizes that such levels would likely only come into play under sustained macro weakness.
Solana Price Prediction: Key Levels to Watch
With bearish pressure dominating higher and lower timeframes, Solana price prediction scenarios hinge on a narrow set of technical levels:
Immediate resistance:
Key supports:
$120–$118 remains the primary demand zone.
$112–$108 is the next downside liquidity pocket.
$101–$89 is the weekly macro support.
As long as the Solana price remains capped below $132, downside risk continues to outweigh upside potential. Bulls would need a decisive reclaim of $145+ to invalidate the bearish structures.
Final Thoughts
Solana price is no longer in a neutral zone; it is sitting at a technical inflection point under bearish control. Repeated failures near resistance, combined with weekly closes below the EMA200, suggest that sellers still dictate the broader trend.
Unless SOL can reclaim key resistance levels with conviction, Solana price prediction models favor further downside exploration, particularly if $120 fails to hold. For now, Solana remains in a defensive posture, with rallies viewed as reactive rather than trend-shifting.
Bitcoin price rally prediction: Crypto investment firm and index fund manager Bitwise said that Bitcoin price could climb to new all-time highs again in 2026, even though the cryptocurrency has struggled over the past two months, as per a report.
Bitcoin Price Forecast: BTC USD Could Hit New All-Time Highs in 2026
In its latest outlook, Bitwise predicts that Bitcoin will move beyond its current record of $126,080, which was set in early October, and break away from the traditional four-year cycle that has long shaped crypto market behavior, as per a Decrypt report.
Why Bitwise Says Bitcoin Will Break the Four-Year Market Cycle
Bitwise Chief Investment Officer Matt Hougan said that, “Bitcoin has historically moved in a four-year cycle, with three significant ‘up’ years followed by a sharp pullback year. According to this cycle, 2026 should be a pullback year,” as quoted by Decrypt.
He pointed out that, “We don’t see that happening,” adding, “In our view, the forces that previously drove four-year cycles—the Bitcoin halving, interest rate cycles, and crypto’s leverage-fueled booms and busts—are significantly weaker than they’ve been in past cycles,” as quoted in the report.
Institutional Adoption and Bitcoin ETFs Fuel Bullish Outlook
Bitwise also highlighted the steady flow of institutional money into crypto following the approval of Bitcoin exchange-traded funds, along with improving regulatory conditions, as key reasons Bitcoin could push to fresh highs.
Hougan added that, “We expect the combination of these factors will push Bitcoin to new all-time highs, relegating the four-year cycle to history’s dustbin,” as quoted by Decrypt.
Bitcoin Price Today
Bitcoin was recently trading around $87,800, up about 2% over the past 24 hours, but still more than 30% below its all-time high.
Bitcoin vs Stock Market: How BTC Has Performed Against Nasdaq and S&P 500
Despite reaching new highs earlier in 2025, Bitcoin is down nearly 18% over the past year, according to CoinGecko data. Over the same period, traditional stock markets have performed better, with the Nasdaq up 14.5% and the S&P 500 gaining 12%.
Bitcoin’s Correlation With Stocks Expected to Decline in 2026
Looking ahead, Bitwise expects Bitcoin’s correlation with equities to decline further in 2026, again citing regulatory progress and institutional adoption. The firm also predicts that Bitcoin, historically known for sharp price swings, will be less volatile than Nvidia, the world’s largest publicly traded company by market value, as per the report.
By combining the potential end of the four-year cycle with lower volatility and reduced correlation to stocks, Bitwise believes investors could benefit from what it described as a “trifecta” of strong returns, steadier price action, and diversification.
Ethereum and Solana Price Outlook Hinges on US CLARITY Act
The firm’s broader 2026 outlook includes several additional predictions. Bitwise expects crypto-related equities to outperform traditional tech stocks, believes that half of Ivy League endowments will make crypto investments, and forecasts new all-time highs for Ethereum and Solana, if the US CLARITY Act passes, as per the Decrypt report.
FAQs
What is Bitwise predicting for Bitcoin in 2026? Bitwise believes Bitcoin could reach new all-time highs in 2026.
How has Bitcoin performed compared to stocks over the past year? Bitcoin is down nearly 18%, while the Nasdaq and S&P 500 are both up.
Dogecoin has had its share of ups and downs. As of December 16, the meme coin sector is sluggish, while DOGE continues to face downward pressure. With viral pumps largely gone, investors are left watching and wondering if a meaningful rebound is possible.
This Dogecoin (DOGE) price prediction gives a realistic view of where DOGE stands today and if 2026 might finally bring some positive momentum.
Summary
Doge’s steady slide underscores persistent selling pressure, especially as the wider crypto market remains subdued.
The token is roughly 82% below its May 2021 all-time high, and every rebound attempt has failed to hold strong.
The DOGE forecast indicates a year of gradual movement rather than big leaps, closely following the swings of overall crypto sentiment.
Current market scenario
Dogecoin is trading around $0.132, showing little upward momentum. The DOGE price has inched up about 1% in the last 24 hours, yet it is still down approximately 6% over the week and nearly 16% for the month.
This steady slide underscores persistent selling pressure, especially as the wider crypto market remains subdued. Meme coins like DOGE are often the first to drop when market sentiment turns cautious.
Part of the problem for DOGE is just how far it is from its peak. The token is roughly 82% below its May 2021 all-time high, and every rebound attempt has failed to hold strong. Short-term bounces can happen when it’s oversold, but resistance tends to cap them, meaning sellers are still active.
With liquidity low and hype-driven inflows largely missing, the DOGE outlook remains muted, even if we see small bursts from time to time
Short-term outlook
Trading below $0.15, DOGE is showing that bearish pressure isn’t going away anytime soon. Any bounce is likely to be weak unless the price can break through $0.20 and signal a shift in sentiment.
Bias: Bearish as long as DOGE stays below resistance.
Key levels: Strong support at $0.125–$0.130 and overhead resistance at $0.150–$0.155.
As long as DOGE trades below resistance, rallies may be viewed as corrective rather than trend-changing.
Dogecoin price prediction 2026
Looking ahead to 2026, the Dogecoin price prediction is giving off some mixed signals. CoinCodex thinks DOGE will stick close to $0.125–$0.145 — pretty calm.
DigitalCoinPrice is more upbeat, saying it could climb to $0.33 if crypto sentiment turns positive. WalletInvestor is more measured: DOGE could sit anywhere between $0.083 and $0.256, averaging $0.171.
The DOGE forecast indicates a year of gradual movement rather than big leaps, closely following the swings of overall crypto sentiment.
Cardano (ADA) is trading under pressure at the time of writing on Tuesday, as sellers remain dominant in the broader cryptocurrency market. The smart contract token’s recovery potential has remained a pipe dream since the October 10 flash crash, despite support at $0.3707-$0.3775 holding steady.
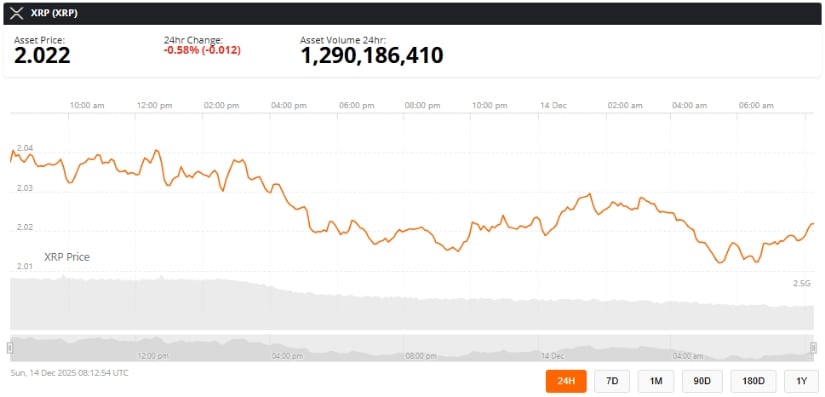
Ripple (XRP) is finding footing above $1.90 at the time of writing on Tuesday after a bearish wave swept across the broader cryptocurrency market, building on persistent negative sentiment.
Bitcoin trades lower on Tuesday, falling 3% over the past 24 hours to 87k amid cautious trading ahead of key U.S. data points that could affect the Fed’s rate path.
XRP is drawing renewed market attention as technical structure, institutional product flows, and regulatory developments converge, reinforcing the view that the asset has transitioned into a higher-trend regime across multiple timeframes.
Market data shows XRP consolidating near the $2 level after breaking out from a prolonged multi-year base. At the same time, rising assets in XRP-linked exchange-traded products and improving sentiment around Ripple’s regulatory outlook have added support to the current market structure rather than undermining it
Technical Structure Signals a Bullish Regime Shift
From a structural perspective, XRP has already completed a meaningful technical transition. On the daily chart, XRP has remained above its 21-day exponential moving average (EMA) near $1.80 for several consecutive weeks, a behavior historically associated with trend continuation during prior XRP expansion phases rather than late-stage rallies.
XRP shows a bullish 3–6 month outlook, consolidating above its 21 EMA near $1.80 after a multi-year breakout, with technical signals projecting 43–75% potential upside. Source: @egragcrypto via X
Crypto market analyst EGRAG CRYPTO, who focuses on long-term XRP market cycles, described the shift as structural rather than speculative. “Ignoring the percentages on the formation and focusing purely on market structure, the higher-probability scenario is up, not down,” EGRAG CRYPTO wrote on X.
The breakout above a multi-year consolidation range marked XRP’s first sustained impulsive move since its prior cycle peak. In technical analysis, such impulsive legs typically signal a transition from accumulation into expansion, with subsequent pullbacks often representing corrective pauses instead of trend reversals.
Time-cycle symmetry, comparing the duration and structure of previous XRP market phases, combined with Fibonacci extension modeling, suggests potential upside ranges of 43% to 75% from recent highs. However, this framework remains conditional. Sustained daily closes below $1.60 would weaken the bullish structure and signal that the breakout has failed to hold.
XRP ETF Assets Rise to $1.18B, Highlighting Institutional Interest
Alongside technical developments, institutional exposure to XRP-linked products has continued to expand. Data shared by ChartNerdTA, citing ETF flow tracker WhaleInsider, shows that total net assets across XRP-related exchange-traded products have reached approximately $1.18 billion following recent net inflows of more than $20 million. “$XRP ETF: Total Net Assets now sits at $1.18BN,” ChartNerdTA posted.
XRP ETF inflows surged by $20.17 million, lifting total assets to $1.18 billion as steady net inflows since mid-November highlight growing institutional demand around the $2 price level. Source: @ChartNerdTA via X
The figures primarily reflect non-U.S. exchange-traded products, including regulated ETPs listed in select international jurisdictions. Visual data from SoSoValue, a platform that tracks digital asset fund flows, shows net inflows remaining positive since mid-November, with cumulative assets trending steadily higher.
While these products differ structurally from U.S. spot ETFs approved for Bitcoin and Ethereum, the growth in assets nonetheless signals rising institutional participation and demand for regulated XRP exposure amid improving regulatory clarity.
Consolidation Phase Reflects Market Balance, Not Weakness
Short-term price action continues to reflect consolidation rather than directional breakdown. According to TradingView analyst ZACKFX7, who focuses on range-based market structures, XRP is currently trading within a clearly defined zone following a rebound from established demand levels.
“XRPUSDT is currently trading inside a well-defined range after a strong move from the demand zone,” the analyst noted.
XRP consolidates within a tight range above key support, signaling building bullish pressure as traders await a confirmed breakout for the next directional move. Source: ZACKFX7 on TradingView
Within this range, price reactions have continued to form higher lows, indicating that buyers remain active on pullbacks. This behavior is commonly associated with accumulation phases, where the market absorbs supply before attempting continuation.
A confirmed break above the range high and buyer-controlled zones would likely open the path toward upper supply targets. Conversely, failure to maintain support could result in another controlled retest of demand without necessarily invalidating the broader structure.
Regulatory Progress Remains a Key Background Driver
Regulatory developments continue to serve as an important backdrop rather than an immediate catalyst. Ongoing progress in the Ripple vs. SEC case has gradually reduced uncertainty for institutional participants assessing XRP exposure, even though no new legal milestones were announced during the period.
While regulatory clarity has improved relative to previous years, legal outcomes remain a variable. Any adverse developments could still influence sentiment, liquidity, and product availability across regulated markets.
Final Thoughts
XRP’s current price behavior reflects consolidation within a broader bullish framework rather than signs of structural exhaustion. The combination of a confirmed long-term breakout, sustained participation in XRP-linked investment products, and steady technical support suggests the market is absorbing supply rather than distributing it.
XRP was trading at around 2.02, down 0.58% in the last 24 hours at press time. Source: XRP price via Brave New Coin
That said, the outlook remains conditional. Macro volatility, regulatory uncertainty, and failures to hold key support levels would alter the trend narrative. For now, analysts broadly emphasize confirmation and structure over speculation, positioning XRP within a constructive but closely watched market regime heading into 2025.


