Bitcoin (BTC), Ethereum (ETH) and Ripple (XRP) are trading under pressure on Tuesday as bearish sentiment in the broader cryptocurrency market lingers.
Despite Bitcoin trading above $86,000, up from an intraday low of $85,266, the overall outlook remains bearish, characterised by “extreme fear”, according to the Crypto Fear & Greed Index.
Solana (SOL) remains under bearish pressure, extending its decline for the third consecutive day with over 1% loss at press time on Tuesday. An ongoing Distributed Denial of Service (DDoS) attack on the Solana blockchain, peaking at 6Tbps, remains ineffective so far but continues to add pressure on traders’ sentiment. Additionally, the derivatives market sentiment is bearish, as Open Interest falls and funding rates turn negative.
The United Kingdom’s Financial Conduct Authority (FCA) launched a series of consultations on proposed rules for digital asset markets, marking the next phase in the government’s effort to establish a comprehensive regulatory framework for crypto assets.
Bitcoin (BTC) price fell to $85,266 today (Tuesday), December 16, 2025, declining 2.06% from the previous day and extending its losing streak to four consecutive sessions.
The world’s largest cryptocurrency has dropped 30% from its October all-time high of $126,000 and now trades 18% below year-ago levels. This persistent weakness comes despite the Federal Reserve’s third rate cut of 2025, as hawkish forward guidance and elevated correlation with correcting tech stocks override traditional liquidity narratives.
In this article, I answer the question of why Bitcoin is going down today by analyzing the BTC/USDT chart and presenting a current Bitcoin price outlook, drawing on my more than 10 years of experience as an analyst and trader.
Why Bitcoin Is Going Down Today?
At the moment, one Bitcoin is trading at 87,251, although the intraday lows are clearly lower. The price has posted four consecutive declining sessions and has moved decisively away from the 94,000 level that was still observed last week.
Bitcoin price today. Source: CoinMarketCap.com
Federal Reserve Hawkish Pivot Undermines Rally
The Federal Reserve delivered its third consecutive 25-basis-point rate cut on December 10, bringing the target range to 3.50-3.75%, the lowest in three years. However, the central bank’s signal of a potential easing pause in 2026 has triggered risk-off sentiment across digital assets, with Bitcoin proving particularly vulnerable.
“From a macro standpoint, crypto continues to trade in close alignment with traditional risk assets, particularly U.S. equities,” Joel Kruger, crypto strategist at LMAX, explains the macro headwinds. “Correlations remain elevated, reinforcing bitcoin’s role as a proxy for broader risk sentiment. Interest rates, real yields, and the U.S. dollar remain key variables for crypto pricing.”
Ten-year U.S. Treasury yields climbed to 4.2%, the highest since early September, creating unfavorable conditions for non-yielding assets like Bitcoin. The disconnect between rate cuts and rising yields reflects market concerns about persistent inflation and fiscal sustainability, pressuring growth assets across the board.
How Low Can BTC Price Go? Death Cross Pattern Signals Extended Decline
Bitcoin’s technical structure has deteriorated significantly since mid-November when the dreaded “death cross” pattern emerged. On November 16, the 50-day moving average crossed below the 200-day moving average while Bitcoin traded around $93,000-$94,000. This bearish signal remains active as of December 16, with the 50 EMA currently residing near $94,000 and the 200 EMA above $103,000.
According to my technical analysis, the price action shows Bitcoin consolidating at local support between $84,000-$85,000, levels that coincide with lows from April, November, and December. Recent daily data confirms the weakness: Bitcoin fell from $92,494 on December 12 to $86,413 by December 16, testing multi-week lows.
Resistance has formed between $92,000-$94,000, representing May highs and the 61.8% Fibonacci retracement level where the 50 EMA acts as a ceiling. My chart structure suggests bears maintain control, with moving averages aligned in a bearish configuration supporting further downside.
My technical analysis of the Bitcoin chart. Source: Tradingview.com
“Bitcoin is consolidating at multi-month lows, and the chart structure with moving averages suggests bears have the advantage, not bulls,” Arkadiusz Jóźwiak, Editor-in-Chief at Comparic.pl, reinforces the bearish outlook. “Although we could move in either direction from this consolidation, I lean more toward a downside breakout scenario moving toward April minimums.”
BTC Targets $74,000: Capitulation Zone Ahead
Using Fibonacci extensions, the primary technical target sits at $74,000, representing the 161.8% extension of the recent corrective wave and coinciding with 2025 yearly lows. This level represents an expected full capitulation zone where weak hands exit and institutional reaccumulation begins.
Historical data shows Bitcoin testing progressively lower levels: $90,257 on December 14, $88,230 on December 15, and $86,413 on December 16. The critical support level to monitor is $80,000, a sustained break below this threshold would flip market structure decisively bearish and potentially trigger forced liquidations from institutional treasuries and ETF holders defending their balance sheets.
BTC Year-End Dynamics and Reversal Scenarios
Holiday season illiquidity may extend the current consolidation between $84,000-$94,000 before the next directional move materializes. The Bank of Japan meeting on December 19 represents a potential catalyst, as any hawkish tilt could trigger broader currency market volatility and additional pressure on risk assets.
Kruger from LMAX expects range-bound but volatile trading: “Looking ahead, markets are likely to remain reactive to macroeconomic data and policy commentary this week. Absent a clear crypto-specific catalyst, price action may remain range-bound but volatile. Overall, bitcoin and ethereum are expected to trade as high-beta expressions of global risk conditions.”
Despite the bearish technical setup, my bearish scenario would be invalidated by a sustained breakout above $94,000, where the 61.8% Fibonacci retracement and 50 EMA converge. Ultimate bullish confidence returns only with a break above $103,000, where the 200 EMA resides, confirming the death cross reversal.
Changpeng “CZ” Zhao, former Binance CEO, offered perspective on market cycles via Twitter: “If you were ever jealous of people buying crypto on the cheap, and able to hold them through the cycles, think about what they did in moments like this.”
If you were ever jealous of people buying crypto on the cheap, and able to hold them through the cycles, think about what they did in moments like this.
Dec 16, 2025
FAQ: Bitcoin Price Analysis Questions
Why is Bitcoin falling today?
Bitcoin is falling due to the Federal Reserve’s hawkish 2026 guidance despite December rate cuts, elevated correlation with correcting Nasdaq tech stocks, active death cross pattern since November 16, and capital rotation from crypto to gold as safe-haven preference intensifies. The 10-year Treasury yield at 4.2% creates unfavorable conditions for non-yielding digital assets.
How low can Bitcoin go in 2025?
Technical analysis using Fibonacci extensions identifies $74,000 as the primary target, representing the 161.8% extension and 2025 yearly lows where full capitulation and institutional reaccumulation is expected. Critical support sits at $80,000, a break below triggers bearish market structure flip. Current consolidation between $84,000-$85,000 represents April/November/December lows.
Will Bitcoin crash further?
The bearish scenario toward $74,000 remains probable while Bitcoin trades below $94,000 resistance and the death cross pattern stays active. Historical death cross patterns precede extended declines, though Bitcoin must fail to bounce within seven days of testing support to confirm another leg down. Sustained breakout above $94,000 (50 EMA, 61.8% Fibonacci) invalidates the bearish thesis.
What is Bitcoin price prediction for 2026?
Current technical setup suggests capitulation at $74,000 before institutional reaccumulation begins. Bullish reversal requires sustained breakout above $103,000 (200 EMA) to confirm death cross invalidation and trend change. Year-end holiday illiquidity may extend $84,000-$94,000 consolidation before next directional move.
When will Bitcoin recover?
Sustained breakout above $94,000 where the 50 EMA and 61.8% Fibonacci retracement converge negates the bearish scenario. Full bullish confidence returns above $103,000 (200 EMA), confirming death cross reversal. The Bank of Japan meeting December 19 could provide near-term catalyst for volatility in either direction.
Before you go, you can also check my previous Bitcoin price predictions:
MATIC price prediction suggests potential 18-37% upside to $0.45-$0.52 range by January 2025, contingent on breaking $0.58 resistance with current support holding at $0.35.
Polygon (MATIC) finds itself at a critical juncture as December 2025 draws to a close, with the cryptocurrency trading at $0.38 amid mixed technical signals. Our comprehensive MATIC price prediction analysis suggests the token is positioned for a potential recovery toward the $0.45-$0.52 range within the next 4-6 weeks, provided key resistance levels are broken and critical support zones hold firm.
MATIC Price Prediction Summary
• MATIC short-term target (1 week): $0.40-$0.42 (+5-11%)
• Polygon medium-term forecast (1 month): $0.45-$0.52 range (+18-37%)
• Key level to break for bullish continuation: $0.58
• Critical support if bearish: $0.35
Recent Polygon Price Predictions from Analysts
The latest analyst consensus reveals a cautiously optimistic outlook for MATIC, with multiple forecasts converging on similar price targets. Recent predictions from Blockchain.News consistently point to a MATIC price target range of $0.42-$0.58 across various timeframes, with most analysts maintaining medium confidence levels.
The December 6th Polygon forecast identified $0.42-$0.50 as the medium-term target, emphasizing that critical support at $0.35 remains intact despite current bearish momentum. Earlier predictions from November showed slightly higher ambitions, with some analysts targeting the $0.45-$0.58 range, contingent on breaking the crucial $0.58 resistance level.
What’s particularly noteworthy is the consistency across multiple analyst reports regarding the $0.58 resistance level as the key determinant for MATIC’s next major move. This level has repeatedly emerged as the make-or-break point that could either trigger a 53% rally or send the token retreating to $0.35 support.
MATIC Technical Analysis: Setting Up for Consolidation Breakout
The current Polygon technical analysis reveals a token in consolidation, trading near the lower end of its recent range. With MATIC positioned at $0.38, the price sits below all major moving averages except the 7-day SMA ($0.37), indicating underlying weakness that requires careful navigation.
The RSI reading of 38.00 places MATIC in neutral territory but leaning toward oversold conditions, potentially setting up for a relief bounce. However, the MACD histogram at -0.0045 confirms bearish momentum remains intact, with the MACD line (-0.0246) still below its signal line (-0.0202).
Perhaps most telling is MATIC’s position within the Bollinger Bands, where the token trades with a %B position of 0.2879, suggesting it’s closer to the lower band ($0.31) than the upper band ($0.56). This positioning often precedes either a breakdown below support or a mean reversion toward the middle band at $0.43.
The Stochastic oscillator readings (%K: 25.19, %D: 19.74) indicate MATIC is approaching oversold territory, which historically has provided buying opportunities for patient investors willing to wait for confirmation.
Polygon Price Targets: Bull and Bear Scenarios
Bullish Case for MATIC
The optimistic MATIC price prediction scenario envisions a staged recovery beginning with an initial move toward $0.42-$0.45, representing the first significant resistance cluster. This upside case relies heavily on MATIC maintaining support above $0.35 while gradually building bullish momentum.
Should MATIC successfully reclaim the 20-day SMA at $0.43, the next logical target becomes the $0.48-$0.50 zone, which aligns with analyst price targets and represents the convergence of the 50-day SMA ($0.45) and psychological resistance levels.
The ultimate bullish MATIC price target remains the critical $0.58 level, which has consistently appeared in analyst forecasts as the gateway to more substantial gains. Breaking this resistance could potentially trigger the 53% rally mentioned in previous predictions, targeting the $0.72 region.
Bearish Risk for Polygon
The bearish scenario for our Polygon forecast centers around a failure to hold the $0.35 support level that analysts have repeatedly identified as critical. A breakdown below this level could trigger a cascade toward the next major support at $0.33, representing the 52-week low territory.
Given MATIC’s current distance of over 70% from its 52-week high of $1.27, further downside could potentially test the lower Bollinger Band at $0.31. This scenario would likely be accompanied by deteriorating market sentiment and continued bearish momentum as indicated by current MACD readings.
The bearish case gains credibility if MATIC fails to reclaim the 20-day SMA at $0.43 within the next two weeks, as this would suggest the current consolidation is more distribution than accumulation.
Should You Buy MATIC Now? Entry Strategy
For investors considering whether to buy or sell MATIC, the current technical setup presents a complex decision matrix. The token’s position near critical support levels offers both opportunity and risk in equal measure.
Conservative entry points should focus on the $0.35-$0.37 range, where strong support has historically emerged. This approach allows for tight risk management with stop-loss orders placed just below $0.33, limiting downside to approximately 8-12%.
More aggressive traders might consider scaling into positions on any bounce toward $0.40-$0.42, using this level as a launching pad for the anticipated move toward our medium-term MATIC price target of $0.45-$0.52.
Risk management remains paramount given the mixed signals in current technical indicators. Position sizes should be kept modest until MATIC demonstrates clear directional bias, preferably through a decisive break above $0.43 or below $0.35.
MATIC Price Prediction Conclusion
Our comprehensive analysis suggests a cautiously optimistic MATIC price prediction for the coming weeks, with the token positioned for a potential 18-37% recovery toward the $0.45-$0.52 range by January 2025. This Polygon forecast carries a medium confidence level, contingent on maintaining support above $0.35 and eventually breaking resistance at $0.58.
Key indicators to monitor include RSI movement above 45 for bullish confirmation and MACD histogram turning positive to signal momentum shift. The critical timeline for this prediction spans the next 4-6 weeks, during which MATIC must demonstrate its ability to reclaim key moving averages and build sustainable upward momentum.
Traders should watch for volume confirmation on any breakout attempts, as the current 24-hour volume of $1.07 million suggests limited institutional interest that must improve for any sustained rally to materialize.
The XRP price has come under enormous pressure after it experienced a huge sell-off throughout the weekend and closed on a bearish note. Bitcoin price slumped hard in the early trading hours, which dragged the entire market down, including XRP. The whale interest seems to have trembled a bit, which seems to have been absorbed by the bulls. With the technicals and the on-chain data hinting towards a ‘market reset,’ it would be interesting to watch whether the XRP price will reclaim $2 this year or not.
Whale Distribution Triggers Short-Term XRP Weakness
The clearest source of XRP’s current sell-side pressure comes from whales. Large-wallet holdings have fallen from roughly 4.8 billion XRP in late November to 3.6 billion XRP by December 15, according to Sentiment data presented by a popular analyst, Ali. This is a meaningful drop in deep-pocket supply and historically aligns with short-term tops or multi-week corrections.
Whales typically offload during high volatility or uncertainty, and their selling over the past three weeks has coincided with XRP breaking key support levels—including the crucial $0.60 zone—and sliding further in line with the broader market downturn. For now, the short-term trend remains bearish primarily because the largest holders are driving liquidity out of the market.
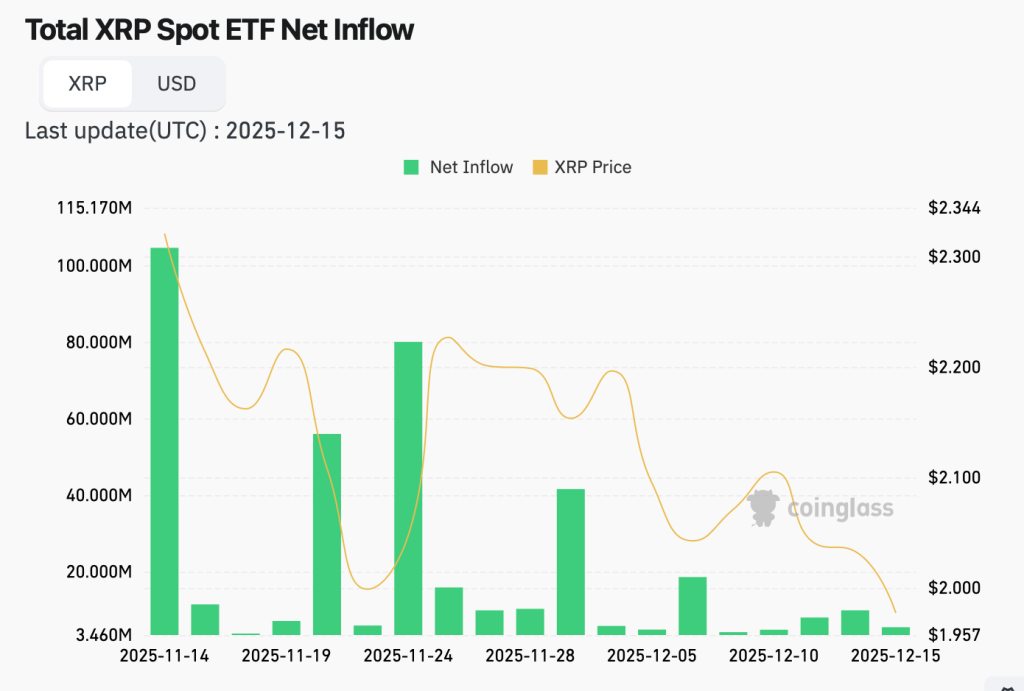
ETF Inflows Show Institutions Accumulating Into Weakness
But the second chart tells a very different story. While whales have been exiting, XRP-focused ETFs and ETPs have recorded consecutive net inflows, outperforming both Bitcoin and Ethereum products during the same period.
Bitwise, Franklin, and other issuers posted multi-million-dollar daily inflows, pushing cumulative net assets above $1.18 billion. Bitwise alone attracted nearly $3.9 million in new flows, while Franklin added more than $4.3 million, suggesting institutional allocators are quietly increasing exposure.
This divergence—whales selling, institutions buying—indicates that longer-term players view the current weakness as an opportunity rather than a trend reversal. ETF flows don’t typically chase short-term momentum; they reflect strategic positioning and confidence in future value.
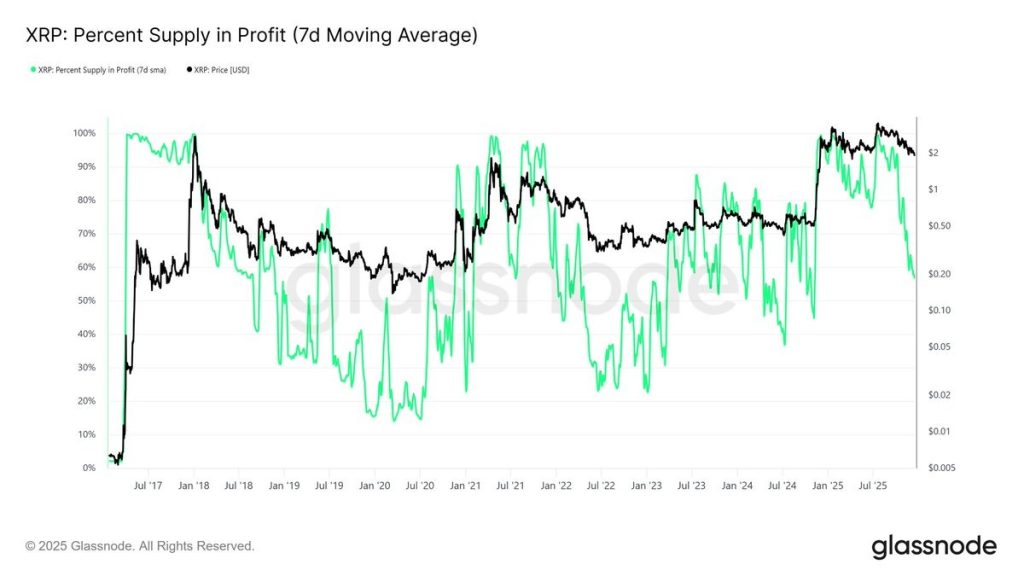
Percent Supply in Profit Confirms a Market Reset, Not a Breakdown
The final piece of the puzzle is XRP’s percent supply in profit, which has collapsed sharply during the recent decline. Historically, whenever the proportion of profitable supply falls this quickly, it signals one of two things: capitulation or the formation of an accumulation zone.
Current readings are now approaching levels seen during major resets in 2018, 2020, and 2022—each of which preceded substantial rebounds in the months that followed. This metric is crucial because it tells us that XRP’s corrective move is flushing out weak hands and resetting expectations, rather than ushering in a prolonged downtrend.
A Market That’s Weak Short-Term, But Strengthening Underneath
When all three signals are aligned, the conclusion becomes clearer: Whales are driving the immediate sell-off, and ETFs are absorbing a meaningful portion of that pressure, reflecting institutional conviction. Meanwhile, on-chain profitability metrics show XRP entering a historical reset zone.
Despite short-term weakness, XRP’s underlying market structure is quietly strengthening. Together, these trends suggest the current correction may be setting the stage for a broader recovery once selling pressure eases. If institutional demand holds and on-chain metrics continue to stabilize, XRP price could realistically work its way back toward the $2 level before the end of 2025.
FAQs
How high could XRP go by the end of 2025?
Analysts predict XRP could reach $5.05 by December 2025 if bullish momentum continues and key resistance levels are broken.
What factors influence XRP’s price movement?
XRP price is influenced by ETF approvals, on-chain activity, investor sentiment, legal developments, and broader crypto market trends.
Is XRP a good investment in 2025?
XRP shows bullish signs with strong on-chain activity and ETF interest, but investors should watch key support and resistance levels carefully.
What will XRP be worth in 2030?
XRP could reach an average of $26.50 by 2030, driven by growing adoption, institutional interest, and market expansion.
Trust with CoinPedia:
CoinPedia has been delivering accurate and timely cryptocurrency and blockchain updates since 2017. All content is created by our expert panel of analysts and journalists, following strict Editorial Guidelines based on E-E-A-T (Experience, Expertise, Authoritativeness, Trustworthiness). Every article is fact-checked against reputable sources to ensure accuracy, transparency, and reliability. Our review policy guarantees unbiased evaluations when recommending exchanges, platforms, or tools. We strive to provide timely updates about everything crypto & blockchain, right from startups to industry majors.
Investment Disclaimer:
All opinions and insights shared represent the author’s own views on current market conditions. Please do your own research before making investment decisions. Neither the writer nor the publication assumes responsibility for your financial choices.
Sponsored and Advertisements:
Sponsored content and affiliate links may appear on our site. Advertisements are marked clearly, and our editorial content remains entirely independent from our ad partners.
Solana price trades in a tight consolidation above key support near $120–$130, as market experts watch for a breakout or continuation following its extended 2025 pullback.
Solana price after extended pullback from its 2025 highs is now trading in a tight range, with traders closely monitoring whether the current structure marks a base for recovery or a continuation of consolidation.
Solana current price is $132.50, down 2.97% in the last 24 hours. Source: Brave New Coin
Recent data from Brave New Coin shows Solana trading near $132.50, reflecting modest intraday weakness but continued defense of a broader demand region. While short-term momentum remains mixed, market watchers note that SOL has yet to lose its most important higher-timeframe support, keeping both bullish and bearish scenarios in play as the market waits for confirmation.
Solana Trades Sideways as Market Searches for Direction
Solana’s recent decline pushed price back into the $125–$130 range, an area that has increasingly acted as a short-term balance zone rather than a confirmed breakdown region. While SOL is no longer testing the lower extremes of its macro support, price remains capped within this band, reflecting a market that is consolidating rather than choosing direction.
Solana’s range-bound structure signals a decisive move ahead. Source: Ali Martinez via X
A widely shared chart from Ali Martinez highlights the importance of nearby levels, noting that a move above $145 flips the trend bullish, while a loss of $125 would shift the structure lower. His analysis frames the current price action as a neutral compression phase, suggesting that SOL is effectively in wait-and-see mode rather than signaling either continuation or reversal.
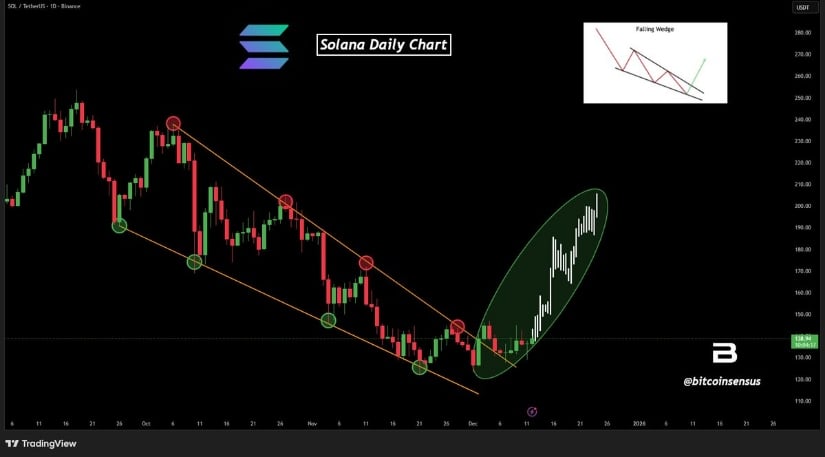
Technical Structure Signals Early Reversal Potential
From a pure chart-structure perspective, Solana price is beginning to show signs of reversal. Bitcoinsensus recently highlighted a falling wedge breakout on the daily chart. While the breakout has technically occurred, the analyst emphasized that follow-through remains limited, with price still struggling to reclaim the $140 region. Until a daily close above that level is achieved, the structure remains early rather than confirmed.
Solana breaks out of a falling wedge as compression tightens. Source: Bitcoinsensus via X
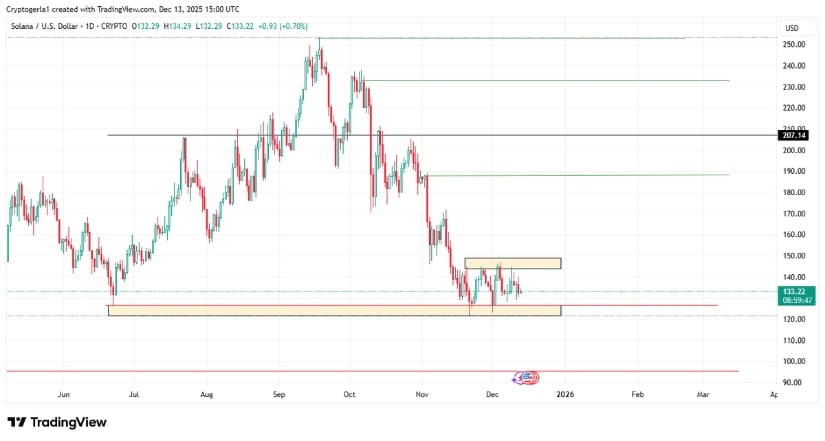
Support & Resistance Levels
Another perspective comes from CryptoGerla, who frames Solana’s current structure through clearly defined support and resistance zones rather than short-term momentum. His chart highlights $120–$125 as a major long-term demand area, a region that has repeatedly absorbed sell pressure since the sharp correction from the $200 region. On the upside, resistance is layered between $150 and $185, where previous rallies have stalled, and supply has consistently emerged.
Solana consolidates above long-term demand as key levels define the range. Source: CryptoGerla via X
Within this framework, SOL is not showing signs of structural breakdown. Instead, price action continues to base above support, suggesting absorption rather than aggressive distribution. As long as Solana holds above the $120–$125 band, the broader structure remains constructive, with any sustained push through the $150 zone likely to act as the first signal that a larger recovery phase is starting to take shape.
Market Sentiment and Analyst Outlook
Market sentiment around Solana price remains cautiously constructive. While short-term traders remain hesitant due to lack of momentum, longer-term analysts continue to point toward structural resilience rather than trend failure.
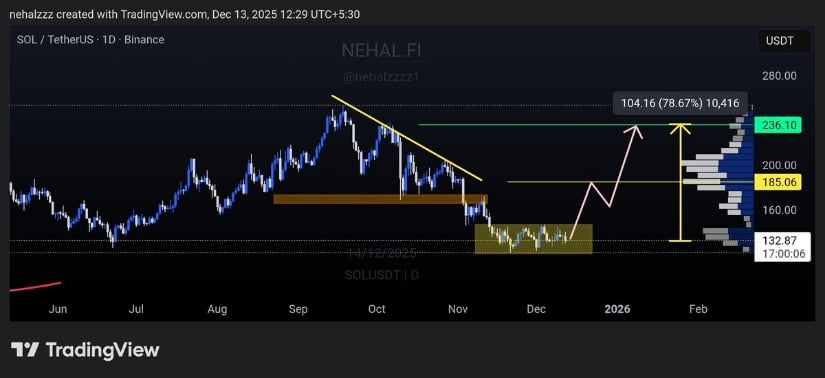
Solana’s macro structure hints at recovery if support holds. Source: Nehal via X
Nehal’s higher-timeframe chart places SOL Solana price inside a broad basing structure following a nearly 78% retracement from its peak, a magnitude historically associated with late-stage corrections rather than early bear phases. His projected recovery path outlines a gradual reclaim of $185, followed by potential expansion towards the $230–$240 region if momentum returns.
Final Thoughts
Solana price sits at a familiar crossroads. Price continues to respect a long-standing support zone while volatility compresses, suggesting that the market is preparing for a larger move rather than drifting aimlessly. The absence of panic selling, combined with repeated defenses of the $120 region, points towards structural stability rather than breakdown risk.
From a Solana price prediction standpoint, the coming weeks are likely to be decisive. A reclaim of key resistance would shift sentiment rapidly, while failure would extend consolidation.
Jakarta, Pintu News – Dogecoin experienced a sharp drop below the $0.1400 zone against the US Dollar. Currently, DOGE is consolidating its losses and may face resistance near $0.1400.
Current State of Dogecoin
Dogecoin (DOGE) started a fresh decline after closing below $0.1420, following in the footsteps of Bitcoin and Ethereum . DOGE dropped below the $0.1400 and $0.1380 support levels. In fact, the price has been trading below $0.1350.
A new low was formed near $0.1326, and recently the price tried to recover some losses with a slight increase towards the 23.6% Fib retracement level of the move down from $0.1530 to $0.1326.
Currently, the Dogecoin price is below the $0.1400 level and the 100-hourly simple moving average. In case of a recovery wave, the immediate resistance on the upside is near the $0.1380 level. There is also a key bearish trend line with resistance at $0.1375 on the hourly chart of the DOGE/USD pair. The first major resistance for the bulls is near the $0.1400 level, followed by the next major resistance near the $0.1425 level and the 50% Fib retracement level of the move down from $0.1530 to $0.1326.
Potential for Further Decline
If the price of DOGE fails to rise above the $0.1400 level, it is likely to continue moving down. Initial support on the downside is near the $0.1340 level, with the next major support near the $0.1325 level. Major support is at $0.130. In the event of a break below the $0.130 support, the price could drop further. In that case, the price may slide towards the $0.1250 or even $0.1240 level in the near term.
What’s Next for Dogecoin?
The Dogecoin market is currently showing signs of volatility with the potential for further declines. Investors and market watchers should pay attention to key support and resistance levels to anticipate further price movements. Whether DOGE will hit a new low or recover, only time will tell.
Enjoy an easy and secure crypto trading experience by downloading Pintu crypto app via Google Play Store or App Store now. Also, get a web trading experience with various advanced trading tools such as pro charting, various types of order types, and portfolio tracker only at Pintu Pro.
*Disclaimer
This content aims to enrich readers’ information. Pintu collects this information from various relevant sources and is not influenced by outside parties. Note that an asset’s past performance does not determine its projected future performance. Crypto trading activities are subject to high risk and volatility, always do your own research and use cold hard cash before investing.All activities ofbuying andselling Bitcoin and other crypto asset investments are the responsibility of the reader.
FAQ
What is Dogecoin (DOGE)?
Dogecoin (DOGE) is a cryptocurrency that was originally created as a joke but has grown into a digital currency with widespread use and a large community.
Why has the Dogecoin (DOGE) price dropped recently?
Dogecoin’s (DOGE) recent price drop has coincided with a decline in the crypto market in general, including Bitcoin (BTC) and Ethereum (ETH), affecting overall market sentiment.
What are the key support levels for Dogecoin (DOGE)?
The key support levels for Dogecoin (DOGE) are currently $0.1340 and $0.1300. If the price breaks below these levels, there could be a further decline.
What is a Fib retracement level?
Fibonacci retracement levels are technical analysis tools used to determine potential support or resistance levels based on previous price movements. These levels are calculated as a percentage of the total price movement.
What is the long-term outlook for Dogecoin (DOGE)?
The long-term prospects of Dogecoin (DOGE) are highly dependent on market adoption, innovations in the Dogecoin ecosystem, and general crypto market dynamics.
Dogecoin’s price would need to rise more than seven-fold before the calendar turns to 2026.
It seems like there are an unlimited number of cryptocurrencies on the market these days. Despite a crowded field, Dogecoin(DOGE4.32%) was one of the early ones, and it’s still around. The dog-themed blockchain network was launched in 2013. It’s impressive that it’s remained relevant for more than a decade.
Dogecoin currently trades 82% off its peak (as of Dec. 12), a high-water mark that was established in May 2021. But the meme coin has skyrocketed 110,000% in the past 10 years, generating phenomenal gains for its hodlers (crypto lingo for holders) in the process. The price right now is $0.1367 per coin. But can Dogecoin reach $1 by the end of 2025?
Image source: Getty Images.
Dogecoin is trying to make the improbable happen
Investors who are hoping that Dogecoin hits $1 before this year ends are asking for a monster gain in the digital asset’s price in less than three weeks. This translates to a whopping 630% return. To be clear, this outcome isn’t going to happen. It’s not realistic to expect any asset’s price to rise so much in such a short period of time.
Nvidia has been the hottest stock in recent years. Before reaching its record high in October, it took the leading artificial intelligence enterprise 30 months for the share price to soar roughly the same amount as Dogecoin would need to. If this return happened in a few short weeks, investors, analysts, and economists would all be convinced that there is something fundamentally broken with the market.
Dogecoin’s historical gain has been spectacular. However, investors have had to deal with tremendous amounts of volatility. And the market appears to be losing its enthusiasm for the token. Dogecoin’s price has tanked 57% in 2025 alone. The entire crypto market, which has also been under pressure, has shed about 6% of its value this year.
If Dogecoin’s price did get to $1 by year-end, it would imply that the blockchain carries a market cap of $152 billion. This exceeds the valuations of companies like Pfizer, Unilever, and Lowe’s, all of which sell in-demand products and services to their customers.
Let’s assume that before 2026 starts, there is unprecedented quantitative easing that leads to burgeoning federal debt and monumental currency debasement, Dogecoin’s developers also introduce game-changing innovations on the blockchain that result in a surge in usage, and capital allocators decide to buy the meme coin at historic rates. These are all extremely favorable factors, but they aren’t happening in isolation or together.
Today’s Change
(-4.32%) $-0.01
Current Price
$0.13
Key Data Points
Market Cap
$22B
Day’s Range
$0.13 – $0.14
52wk Range
$0.13 – $0.43
Volume
1.3B
Is Dogecoin still a smart buy today?
Dogecoin’s price surely won’t increase by 630% during the rest of this year. Those with more tempered expectations, though, might still be interested in speculating. Does this digital asset still present a smart buying opportunity? It depends on how you allocate your hard-earned savings.
The only people who will be even remotely interested are those looking to gamble on short-term price movements. A look at Dogecoin’s historical price chart will reveal that it experiences very short-term bursts in positive sentiment, followed by crashes. The token is driven by unpredictable hype cycles that naturally draw momentum traders looking for a quick profit.
If you’re a long-term investor, which I view as the best way to play the markets, then it won’t be hard to convince you to avoid Dogecoin like the plague. As mentioned, the investment community might slowly be forgetting about this blockchain project, as the price has been in a downward spiral. Unless there are some incredible catalysts on the horizon, this should continue.
Dogecoin doesn’t add any real-world value, and its supply is constantly increasing, an unfavorable comparison with a key competitor. The crypto it followed, Bitcoin, is completely decentralized, and it has a fixed supply of 21 million coins. Bitcoin is also being integrated into the traditional financial services industry in various ways. It’s the much better choice for investors who have a five- or 10-year time horizon.
The XRP price is trading sideways between $1.92 and $2.01 as of December 15, reflecting continued uncertainty in the broader crypto space. While the recent pullback has weighed on sentiment, XRP continues to benefit from solid fundamentals that could help drive a recovery.
For this XRP price prediction, we’re checking out the market conditions, the possible gains, and the downside, to see whether XRP can pick up bullish momentum.
Summary
XRP price is trading sideways between $1.92 and $2.01, reflecting market uncertainty and cautious investor sentiment.
XRP is down 3.7% in a day, 7.2% for the week, and nearly 14% over the month.
Reclaiming $2.00 could spark a rebound toward $2.20–$2.30 if support holds.
A decisive break below $1.97–$1.95 could trigger faster sell-offs, with potential drops toward $1.80 or even $1.20–$1.30.
XRP’s fundamentals remain strong, and the market is at a key turning point that could lead to either sideways consolidation or a mild bullish recovery.
Current market scenario
Trading around $1.93, Ripple (XRP) has dipped slightly — down 3.7% in a day, 7.2% for the week, and almost 14% over the month.
XRP 1-day chart, December 2025 | Source: crypto.news
But the long-term XRP outlook is still encouraging. Ripple’s approval for a national trust bank charter is a big regulatory win, and steady ETF inflows show that institutional interest in XRP hasn’t waned.
Upside outlook
A push back into the $1.95–$2.00 zone could provide XRP with the footing needed for a controlled rebound. Holding above this threshold may spark upward momentum and open the door to the $2.20–$2.30 resistance level. Entry into this territory would reflect renewed buying interest and hint at the emergence of a short-term bullish trend. Crucially, reclaiming $2.00 on solid volume is key to confirming the move.
Downside risks
The market’s cautious mood is putting XRP on the defensive. A clean break below $2.00 could dismantle the current base, triggering faster sell-offs. If the daily candle closes under $1.97, $1.80 could come into play. And should the selling frenzy continue, the coin may slide to $1.20–$1.30, underscoring how fragile these key support areas are.
XRP price prediction based on current levels
A decisive break below the $1.95–$2.00 area would likely increase the chances of XRP sliding toward $1.80. On the flip side, a clean move back above $2.00 would suggest the start of a mild recovery, with potential upside toward $2.20–$2.30.
Currently, XRP isn’t showing much rebound, suggesting the market is still playing it safe with the price. If the support level holds, we could see the coin settling into a sideways phase before making a meaningful upward move. Overall, this XRP forecast highlights a key turning point for the market in the near term.
Bitcoin(CRYPTO: BTC) is an extremely polarizing asset. There are strong supporters who believe it can go to the moon. There are also thunderous critics who think the cryptocurrency is worthless. Nonetheless, it has been a winning investment in the past.
As of the morning of Dec. 11, Bitcoin’s price siat at roughly $90,000 — down from the peak of more than $126,000 it touched in early October. I predict that it will triple to $270,000 in five years. Here are two of the most important catalysts that can drive the price to that level by the end of this decade.
Image source: Getty Images.
Perhaps the most notable macroeconomic trends in recent history have been the increases in debt levels and the money supply. These features have characterized the U.S. financial situation, and there are no signs that the growth on these fronts is ever going to let up. The Federal Reserve just announced another 25-basis-point cut to its benchmark interest rate. And it revealed that it would resume quantitative easing (QE), buying as much as $40 billion worth of Treasury bills every month. This pumps liquidity into the system with U.S. dollars that are created out of thin air.
This sounds crazy, but it’s a policy that has been used for quite some time. Back during the financial crisis of 2007-2009, Ben Bernanke, who was the Fed chairman at the time, made heavy use of QE to help get the U.S. economy back on a solid footing. This act was meant to be a temporary intervention. That hasn’t been the case.
When the COVID-19 pandemic struck, however, QE was supercharged, and trillions of dollars were pumped into the system to prevent what otherwise threatened to be an economic disaster. Ideally, QE should be used to help support the economy during recessionary periods. Now, it’s being used at a time when the economy is still growing, and the market has come to expect the central bank to always intervene in an accommodative way.
During the past 20 years, the amount of U.S. federal debt went from about $8 trillion to more than $38 trillion. And the M2 money supply has increased by 238% during that same period.
It’s interesting that Bitcoin was launched in January 2009, in the waning days of the financial crisis. Its price has skyrocketed over time as more investors have bought into the value proposition of owning an asset that isn’t controlled by anyone, that hasn’t been hacked, and that has a fixed supply cap.
You could easily argue that Bitcoin is the best way for investors to bet on the premise that the U.S. government will never be able to pay down its towering debt burden. Additionally, there’s no reason to believe that the debt is not going to keep increasing. The Congressional Budget Office forecasts that by 2055, the amount of federal debt held by the public will balloon to a jaw-dropping 155% of gross domestic product (GDP), up from 100% in 2020. This ever-expanding money supply will lead to ongoing currency debasement.
Another notable tailwind to pay attention to is how Bitcoin is being embraced by financial institutions that control large pools of capital. Spot Bitcoin exchange-traded funds were among the most successful product launches in Wall Street history. Mainstream banks are suggesting that their wealth management clients allocate a small percentage of their portfolios to Bitcoin. We’ve seen a proliferation of Bitcoin treasury companies that buy and hold Bitcoin on their balance sheets. And there are upstarts that provide Bitcoin-backed lending products.
Five years from now, it’s likely that Bitcoin will be even more integrated into the traditional financial services industry. That should lead to more innovation, resulting in creative solutions for businesses to find ways to serve their customers by leveraging the crypto. All of this supports the premise that there will be more demand for the digital asset.
For Bitcoin’s price to triple in five years would require a compound annual growth rate of about 25%. That would be an impressive run that would probably outperform the stock market. But it would also be well short of the crypto’s trailing five-year compound annualized return of 37%.
Investors should temper their expectations, as it’s unlikely that Bitcoin’s future returns will match those of the past past. However, there’s also a chance that my $270,000 price target for it in 2030 could prove to be too conservative.
Before you buy stock in Bitcoin, consider this:
The Motley Fool Stock Advisor analyst team just identified what they believe are the 10 best stocks for investors to buy now… and Bitcoin wasn’t one of them. The 10 stocks that made the cut could produce monster returns in the coming years.
Consider when Netflix made this list on December 17, 2004… if you invested $1,000 at the time of our recommendation, you’d have $513,353!* Or when Nvidia made this list on April 15, 2005… if you invested $1,000 at the time of our recommendation, you’d have $1,072,908!*
Now, it’s worth noting Stock Advisor’s total average return is 965% — a market-crushing outperformance compared to 193% for the S&P 500. Don’t miss the latest top 10 list, available with Stock Advisor, and join an investing community built by individual investors for individual investors.
Neil Patel has no position in any of the stocks mentioned. The Motley Fool has positions in and recommends Bitcoin. The Motley Fool has a disclosure policy.
Cardano price remained under pressure today, Dec. 15, mirroring the broader crypto market, where Bitcoin and most altcoins tumbled. ADA token dropped to $0.40 despite the ongoing turnaround of its network and the upcoming SEC roundtable on privacy.
Cardano Price Has Crashed Despite Key Milestones
ADA price has remained under pressure this month despite having some major milestones. One of them happened last week when Cardano finally inked a partnership with one of the biggest players in the oracle industry.
Pyth Network has now integrated with Cardano, enabling developers to access high-quality price feeds and market data.
This is important because Pyth is the fifth-largest participant in the oracle industry, with a total value secured (TVS) of over $4.5 billion. Some of the top protocols that use Pyth are Jupiter, Kamino, Drift, Save, and Avantis.
The integration is also key because it aligns with one of the five pillars that Cardano has set aside from the 70 million ADA tokens it is removing from its treasury.
The other notable catalyst for Cardano’s price is the Midnight launch’s success: the NIGHT token has soared, its market capitalization reaching $1.14 billion, and its 24-hour volume has risen to $940 million.
One reason the NIGHT token price has jumped is that most exchanges offering the token staking are offering huge rewards, with HTX offering a 100% APY.
The NIGHT token is also rising as investors await the upcoming roundtable on privacy, scheduled for later today. This is important as NIGHT focuses on privacy using the zero-knowledge (zk) technology.
ADA Price Technical Analysis Points to a Plunge
Cardano chart | Source: TradingView
The daily timeframe chart reveals that the Cardano price is at risk of a deeper dive in the coming days and weeks. It has dropped below the critical $0.50 support level, its lowest level since June and April this year, where it formed a double-bottom pattern.
It has dropped to the Ultimate Support level of the Murrey Math Lines, and a drop below it may trigger further downside in the near term.
The Cardano token has formed a bearish flag pattern, a common continuation sign in technical analysis. Therefore, ADA price will likely continue to fall, potentially to the key support level at $0.1900, which corresponds to the extreme oversold reading on the Murrey Math Lines tool.


 Price Drop: Will the Price Continue to Fall? (12/16/25)")


