The main tag of Crypto News Articles.
You can use the search box below to find what you need.
[wd_asp id=1]

11 12, 2025

Solana Price Prediction: Can SOL Rebound Towards $150 as Liquidity Resets and Key Support Holds Firm?

By |2025-12-11T02:24:11+02:00December 11, 2025|Crypto News, News|0 Comments

Solana price is stabilizing above a major support zone, with tightening structure and improving liquidity, hinting at a potential rebound towards the $145–$150 region.

Solana price is drawing renewed interest this week as price action stabilizes above a major multi-year support zone, forming a structure that several analysts believe could mark the beginning of a new accumulation phase. After a choppy start to December, SOL is attempting to reclaim bullish momentum while broader market liquidity undergoes a notable reset.

Solana current price is $137.58, up -3.44% in the last 24 hours. Source: Brave New Coin

As of today, Solana trades around $137.59, up 3.44% in the last 24 hours according to Brave New Coin. The asset briefly touched a daily low near $132 before recovering, reinforcing the importance of the $120–$130 support area that has historically acted as one of SOL’s strongest demand zones.

Support at $120 Holds as Buyers Begin Defending Structure

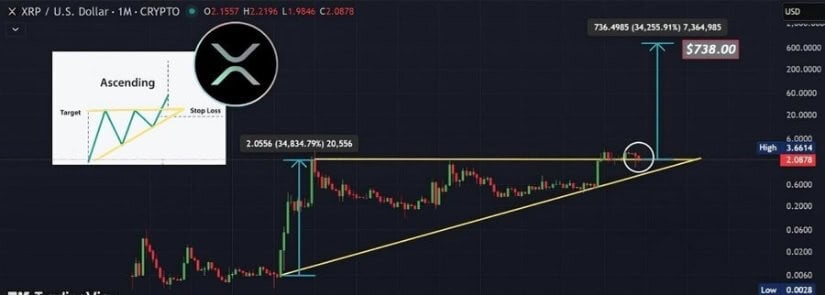
Recent long-term charts show Solana price forming a tight consolidation above $120, with sellers repeatedly failing to break the structure. The hold is particularly important because this level previously served as the midpoint for major reversal cycles dating back to late 2023.

Solana Price Prediction: Can SOL Rebound Towards 0 as Liquidity Resets and Key Support Holds Firm?

Source: SOL has repeatedly rebounded from this horizontal demand band through 2024–2025. Source: Gem Detector via X

At the same time, momentum is beginning to shift. Crypto TA King identified an ascending triangle pattern, a structure that statistically favors bullish continuation when support holds. The chart highlights a rising trendline from the $130 to $134 region, suggesting buyers are steadily stepping in at higher lows.

Support at $120 Holds as Buyers Begin Defending Structure

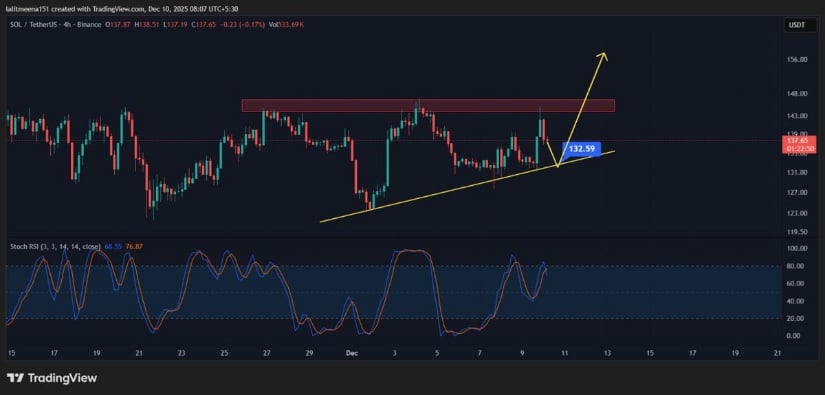
Solana’s ascending triangle continues to tighten, with higher lows forming between $130–$134 as buyers steadily build pressure beneath resistance. Source: Crypto TA King via X

The analyst notes that a confirmed breakout above the $145–$148 resistance band could trigger the next expansion phase, aligning with historical reaction points seen earlier this year.

On-Chain Data Hits Peak Bear Levels While SOL Defends Key Support

Solana’s realized profit-to-loss ratio has now traded below 1 since mid-November, according to Glassnode, meaning realized losses are consistently outweighing realized profits. This type of reading typically appears during deep bear-market conditions, when liquidity contracts and participants capitulate into weakness.


On-Chain Data Hits Peak Bear Levels While SOL Defends Key Support

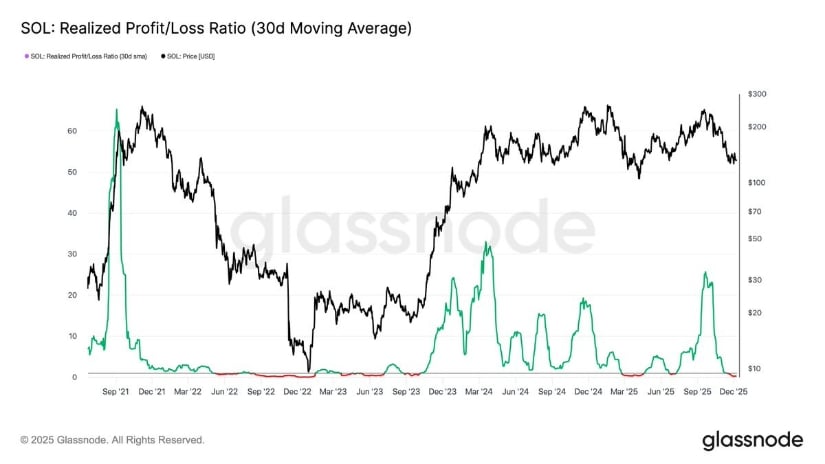
Solana’s liquidity dynamics now resemble early phases of prior recovery cycles. Source: Glassnode via X

What makes this significant is that price is simultaneously holding the critical $120 to $130 support, a level Solana has not lost in nearly two years. Historically, when major supports hold while on-chain metrics print extreme negative conditions, sellers often run out of momentum first. If capitulation pressure fails to push the Solana price below support, the setup can reverse sharply as liquidity normalizes.

While confirmation still requires a breakout above the $145 to $148 resistance band, the on-chain environment now reflects the same exhaustion conditions seen near Solana’s previous cyclical turning points.

Technical Outlook: Breakout Models Point Towards $145–$150

Ali Martinez’s comparative model shows Solana’s recent structure closely tracking Ethereum’s breakout pattern from last month. According to his analysis, if the correlation continues, the breakout projection for Solana sits around $150.


Technical Outlook: Breakout Models Point Towards $145–$150

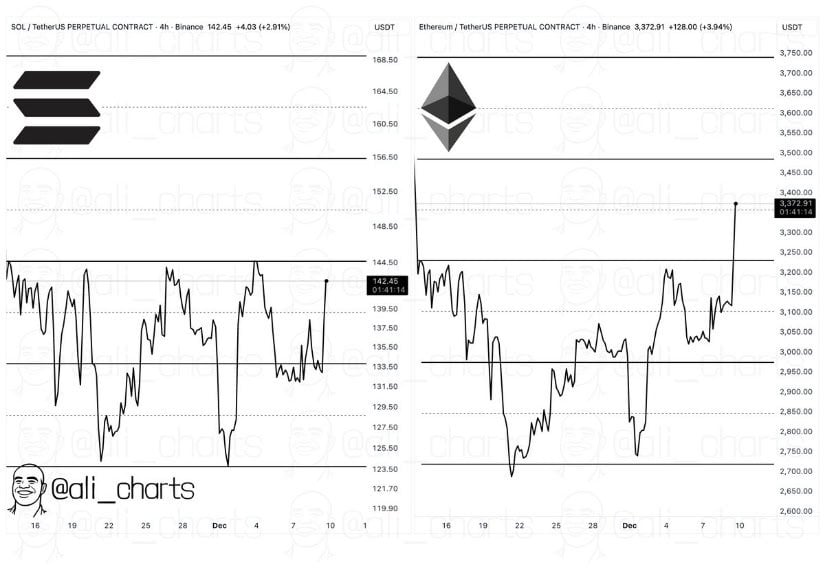
SOL may mirror ETH’s earlier breakout path towards the $150 region. Source: Ali via X

Several technical factors support this level as the short-term inflection point:

  • ETH-mirroring models indicate a clean breakout structure targeting $150.

  • Liquidity maps show minimal resistance between $142 and $150, increasing the probability of a rapid move if momentum builds.

  • The ascending triangle is targeting $145–$148.

Immediate support sits at $130–$134, with the major structural floor still anchored at $120. A breakdown below $120 would invalidate the bullish models, but current data suggests buyers remain firmly in control above this threshold.

Final Thought: Can Solana Extend Towards $150 and Beyond?

Solana price now sits at a critical intersection of technical and on-chain dynamics. The $120–$130 support continues to act as one of the most important structural floors of the entire 2024–2025 cycle, and the latest Glassnode readings show that realized losses have reached levels typically associated with late-stage seller exhaustion. When price stability converges with peak bearish on-chain conditions, markets often enter a phase where momentum can shift faster than sentiment anticipates.

From a broader Solana price prediction standpoint, the next reaction from this support band will likely define the remainder of December’s trajectory. A sustained hold above $130 combined with improving liquidity, could open room towards $145 and $150. However, failure to maintain this base would expose the lower demand zones near $120, delaying any meaningful rebound.

Regardless of the short-term noise, Solana’s current structure reflects a market approaching an important decision point. Confirmation will ultimately depend on whether buyers can convert this compression phase into a trend reversal, or whether sellers attempt one final push before volatility expands again.


Source link

11 12, 2025

MATIC Price Prediction: $0.45 Target by January 2025 as Polygon Tests Critical Resistance

By |2025-12-11T00:23:12+02:00December 11, 2025|Crypto News, News|0 Comments


Terrill Dicki
Dec 10, 2025 11:23

Our MATIC price prediction sees potential rally to $0.45 within 4-6 weeks if Polygon breaks above $0.43 SMA 20 resistance, though downside risk to $0.33 remains.


MATIC Price Prediction: Polygon Poised for Potential Breakout Above Key Technical Levels

Polygon (MATIC) finds itself at a critical juncture as the cryptocurrency trades near its 52-week low of $0.37, presenting both significant opportunity and notable risk for traders. With the current price at $0.38, our comprehensive MATIC price prediction analysis reveals a coin consolidating before a potential directional move that could determine its trajectory through early 2025.

MATIC Price Prediction Summary

MATIC short-term target (1 week): $0.41 (+8%) if SMA 7 holds as support
Polygon medium-term forecast (1 month): $0.45-$0.50 range upon breakout confirmation
Key level to break for bullish continuation: $0.43 (SMA 20 resistance)
Critical support if bearish: $0.33 (strong support zone)

Recent Polygon Price Predictions from Analysts

Recent analyst forecasts present a mixed but ultimately optimistic outlook for MATIC’s price trajectory. CoinCodex’s conservative MATIC price prediction of $0.1244 in the short term appears overly bearish given current technical positioning, while PricePredictions.com’s ambitious forecast of $0.763306 by December 2025 suggests significant upside potential.

The most balanced Polygon forecast comes from Benzinga, targeting $0.717 by 2030, which aligns with the token’s fundamental value proposition as Ethereum’s leading Layer-2 scaling solution. This range of predictions highlights the current uncertainty in the market, with our technical analysis suggesting the truth likely lies between the conservative and aggressive estimates.

Notably, the market consensus points toward cautious optimism, with medium to long-term MATIC price prediction scenarios favoring bulls despite near-term consolidation pressures.

MATIC Technical Analysis: Setting Up for Consolidation Breakout

The Polygon technical analysis reveals a cryptocurrency testing crucial support levels while building momentum for a potential upward move. With MATIC trading at $0.38, the token sits precariously close to its lower Bollinger Band at $0.31, indicating oversold conditions that often precede reversals.

The RSI reading of 38.00 places MATIC in neutral territory, suggesting neither extreme oversold nor overbought conditions. This positioning provides room for upward movement without immediately triggering profit-taking pressure. However, the MACD histogram at -0.0045 indicates lingering bearish momentum that must be overcome for any sustained rally.

Volume analysis from Binance shows $1.07 million in 24-hour trading, which while modest, provides sufficient liquidity for institutional participation. The key technical pattern emerging is a potential double-bottom formation near the $0.37-$0.38 range, which historically signals trend reversals when confirmed by volume expansion.

The critical resistance cluster between $0.42-$0.43 represents both the EMA 26 and SMA 20 levels, making this zone the primary battleground for MATIC’s next directional move.

Polygon Price Targets: Bull and Bear Scenarios

Bullish Case for MATIC

Our optimistic MATIC price prediction scenario targets $0.45 as the initial objective, representing the SMA 50 level and a 18% gain from current levels. This MATIC price target becomes achievable if Polygon successfully breaks above the $0.43 resistance with expanding volume.

The secondary bullish target sits at $0.58, matching both the strong resistance level and upper Bollinger Band. Achieving this level would require sustained buying pressure and broader cryptocurrency market support, representing a 53% upside potential.

For this bullish Polygon forecast to materialize, MATIC needs to reclaim the $0.43 level decisively, ideally with daily closing prices above this threshold for at least three consecutive sessions. The RSI would need to break above 50, while the MACD histogram should turn positive to confirm momentum shift.

Bearish Risk for Polygon

The downside MATIC price prediction centers on a break below the $0.35 immediate support level, which could trigger algorithmic selling toward the $0.33 strong support zone. This represents a 13% decline from current levels and would likely coincide with broader market weakness.

A more severe bearish scenario sees MATIC testing the lower Bollinger Band at $0.31, particularly if Bitcoin experiences significant selling pressure or if Ethereum scaling narratives lose market favor. The 52-week low of $0.37 serves as a psychological support level that, if broken, could accelerate selling momentum.

Risk factors include potential regulatory concerns around Layer-2 solutions, competitive pressure from alternative scaling technologies, and general cryptocurrency market sentiment deterioration.

Should You Buy MATIC Now? Entry Strategy

Based on our Polygon technical analysis, the current risk-reward setup suggests a cautious buy approach for those willing to accept moderate volatility. The optimal entry point for our MATIC price prediction scenario lies between $0.37-$0.39, with a stop-loss positioned below $0.33 to limit downside exposure.

For conservative investors, waiting for a confirmed break above $0.43 with volume confirmation provides a higher probability setup, albeit with reduced upside potential. This approach aligns with the “buy or sell MATIC” decision framework that prioritizes capital preservation over maximum returns.

Position sizing should remain modest given the mixed technical signals, with recommendations not exceeding 2-3% of total portfolio allocation. Dollar-cost averaging into positions over 2-3 weeks can help mitigate timing risk while building exposure to potential upside.

The technical setup suggests setting take-profit orders at $0.45 (first target) and $0.50 (extended target), while maintaining trailing stops to capture momentum if the Polygon forecast exceeds expectations.

MATIC Price Prediction Conclusion

Our comprehensive analysis yields a medium confidence MATIC price prediction of $0.45 within the next 4-6 weeks, contingent on breaking above the critical $0.43 resistance level. The Polygon forecast remains cautiously optimistic despite current consolidation, with technical indicators suggesting oversold conditions may soon reverse.

Key indicators to monitor for prediction confirmation include RSI breaking above 50, MACD histogram turning positive, and sustained volume expansion above $2 million daily. Invalidation signals include a decisive break below $0.33 support or failure to reclaim $0.40 within the next two weeks.

The timeline for this MATIC price target assumes normal market conditions and no major external catalysts. Traders should remain flexible and adjust positions based on evolving technical patterns, particularly monitoring Bitcoin’s influence on overall cryptocurrency sentiment that directly impacts Polygon’s price action.

Image source: Shutterstock


Source link

10 12, 2025

If Key Factors are Maintained, Some

By |2025-12-10T22:22:11+02:00December 10, 2025|Crypto News, News|0 Comments

If you’re hunting the best crypto to buy now, the renewed surge around Dogecoin (DOGE) has grabbed attention. Bitcoin’s recent rally and a revived appetite for meme coins have pushed Dogecoin back into the limelight. Some analysts now say that if a few key conditions line up, DOGE could hit the $1 mark by 2026.

Momentum feels real. Crypto communities are buzzing, and new investors are rushing in. Meanwhile, there’s a new DeFi project whose release on the App Store has stirred improved optimism.

Dogecoin Price Prediction: Why It Could Become Top Crypto Under $1 by 2026

Dogecoin has always been the maverick of the crypto world. What started as a joke has turned into a legit contender every time the crypto market gains energy. Right now, DOGE trades well below one dollar, but sentiment is heating up again.

Memes, endorsements from influencers, and fresh interest from retail buyers are fueling hope. Some analysts now call it a “next big altcoin in 2025” candidate, especially if overall crypto momentum stays strong.

There are a few real reasons DOGE could rise. First, its supply is high, but inflation is low; new coins are added slowly. That makes it a sort of long-term play. Second, its status as a low-gas-fee crypto means users don’t pay crazy fees to send DOGE. That can make it useful for tipping, small payments, and micro-transactions.

Remittix: A Shift Toward Real Utility in Crypto

A rising cross-chain DeFi project quietly gaining attention is Remittix. https://remittix.io/ Unlike meme-coins, this project aims to deliver a real PayFi solution. Remittix recently raised $28.5 million in private funding. That shows investors believe in its vision. Remittix wants to make crypto useful for everyday money movement.

Remittix stands out because it does more than promise hype. It aims to let users send crypto across borders, move funds from crypto to fiat, and handle real payments. In a world where many cryptos stay speculative, Remittix offers real-world use.

For people who think DOGE might pop, they might also believe in buying a token that could serve as a bridge between crypto wallets and real banking systems.

Why Remittix Is Gaining Traction

● Global reach: It plans to support bank transfers to many countries.

● Real-world use: It is built for payments and remittances.

● Fast, low-cost transfers: Fees are designed to stay low; no massive gas costs.

● Multi-asset support: The wallet is meant to handle many cryptos and fiat types.

● Secure and funded: $28.5 million in backing gives it a runway for growth.

Price Scenarios for Dogecoin

Scenario – Conditions – Estimated DOGE Price by 2026

Bullish – Major adoption, social momentum, crypto bull run – About $1.00

Moderate – Sluggish growth, some adoption, stable market – About $0.65

Conservative – Weak demand, fading hype, bear conditions – About $0.25

The Best Crypto To Buy Now

Dogecoin could become a quiet contender for that dream $1 price if things go right. It remains speculative, but the appetite is clearly there. If meme-coin energy returns, DOGE might surprise people.

Yet even as DOGE fancies itself a funny coin turned serious bet, real innovation is happening elsewhere. Remittix offers a different angle: crypto that wants to work like money does. For investors who want a mix of fun and fundamentals, combining a small DOGE stake with a position in Remittix might make sense.

Discover the future of PayFi with Remittix by checking out their project here:

Website: https://remittix.io

Socials: https://linktr.ee/remittix

$250,000 Giveaway: https://gleam.io/competitions/nz84L-250000-remittix-giveaway

Frequently Asked Questions

Q: Is $1 Dogecoin realistic?

A: Yes, if social buzz returns and more platforms accept DOGE for payments, $1 is possible. But it needs real demand, not just hype.

Q: What could stop Dogecoin from reaching $1?

A: Lack of adoption, fading media attention, or crypto regulation could weaken demand. Without growth, the price may stay low.

Q: Is Remittix less risky than Dogecoin?

A: Possibly. Remittix targets actual utility: payments and remittance tools. That gives it real-world value even if markets wobble.

Q: Should I invest in both Dogecoin and Remittix?

A: That depends on your risk appetite. DOGE is speculative and volatile. Remittix leans toward utility and long-term growth. Splitting a small budget between both could spread risk.

Q: How soon could Remittix begin real operations?

A: Since the project has already raised over $28.5 million and is focusing on wallet and payment tools, real usage could start soon, especially if development remains on schedule.

Disclaimer: This article is for informational purposes only and does not constitute financial advice. Cryptocurrency investments carry risk, including total loss of capital. Readers should conduct independent research and consult licensed advisors before making any financial decisions.

Crypto Press Release Distribution by https://btcpresswire.com

This release was published on openPR.

Source link

10 12, 2025

Cardano At A Crossroads, Can ADA

By |2025-12-10T20:21:03+02:00December 10, 2025|Crypto News, News|0 Comments

The crypto space doesn’t stop moving; one month’s market leader can become the next month’s afterthought. Cardano is a good example, and you’ll find out why soon.

Meanwhile, newer projects on the scene, like Remittix https://remittix.io, are stealing the spotlight. Investors love that it offers a straightforward use case, a strong presale run, and a narrative that’s easy to understand without reading a 50-page technical paper. In a market that rewards clarity and momentum, that combination goes a long way. So, if you are asking, “Should I stick with Cardano, or pivot to something like Remittix?”, make sure to read to the end.

Comparison Table: Cardano (ADA) vs. Remittix (RTX)

Feature / Factor – Cardano (ADA) – Remittix (RTX)

Current Narrative – At a crossroads: slow recovery, uncertain upside, ecosystem fatigue – Rapid momentum: rising presale demand, strong onboarding narrative

Technology Focus – Layer-1 blockchain with Hydra scaling, smart contracts, and staking – Cross-chain payment infrastructure + remittance optimisation

Market Sentiment (2025) – Mixed-leaning bearish; frustration over delays and limited DeFi traction – Strongly bullish; investors rotating from older L1s to utility-based newcomers

Adoption Signals – Hydra testing is ongoing, but limited real-world deployment; TVL is still small – Beta wallet testing reported; growing user interest; remittance-focused use cases

Token Utility – Staking, governance, and smart contract gas fees – Transaction fees, settlement layer, governance, and on-chain remittance operations

Risk Level – Medium to High: development delays + declining liquidity – Medium: early-stage project but with clear utility and stronger growth narrative

2026 Growth Outlook – Slow, dependent on ecosystem revival and Hydra success – High, fuelled by remittance expansion, exchange listings, and increasing hype

Investor Movement – Capital rotating out due to slow tech progression – Increasing inflows from ADA, SHIB, and mid-cap altcoins

Whale Activity – Lower engagement compared to the 2021-2022 cycle – Whales entering presale early; multiple large-ticket buys reported

Potential ROI (2026) – Modest unless a catalyst emerges – High upside due to early position, strong demand, and real-world use case

What’s Going Right for Cardano (ADA): Why Some Still Believe

Beneath the market noise, the Cardano network continues to push out real technical progress. The Cardano team recently rolled out Hydra to finally address the “it’s too slow” complaint that critics have long had.

And it doesn’t stop there. Cardano’s 2025 development plan is packed with upgrades, including Ouroboros Leios, an advanced version of its consensus mechanism designed to improve performance without sacrificing security. There’s also Project Acropolis, which focuses on making Cardano nodes more modular and efficient; a significant move toward long-term scalability.

If delivered, these could significantly modernise Cardano’s core infrastructure. And that’s why some analysts remain bullish: under optimistic conditions (full upgrade success, adoption growth), ADA could target $1.20-$1.30 by late 2025, with long-term potential toward $2-$3+ if network activity and ecosystem growth pick up.

There is speculation that a possible spot-ETF, renewed institutional interest, or macro-economic tailwinds could add fuel to a rebound; scenarios that keep ADA on many watchlists. In short, Cardano isn’t dead. It may still deliver if its ambitious upgrades land, and the ecosystem revives.

Why ADA Might Be at a Crossroads: Real Risks and Growing Headwinds

But hope alone isn’t a strategy. Here’s where ADA’s path looks fragile:

● Utility adoption is weak. On-chain metrics show flattened transaction counts and low active-wallet growth since mid-2025. The DeFi/NFT/usage volume that once fueled optimism hasn’t materialized at scale.

● Many traders and HODLers are losing patience. Poor price performance despite upgrades, and lingering skepticism around “bait-and-hold” cycles dampen confidence.

● Technical charts show ADA struggling to break resistance zones. Recent forecasts suggest potential short-term drops to $0.64-$0.66 if momentum fails, a reminder that crypto can be unforgiving even for long-term believers.

● The success of the upgrades is still uncertain. Delays or poor adoption of Hydra/ Leios/Acropolis could revive old criticisms: high supply, low velocity, and add skepticism among investors.

Worse yet, competition is fierce. Other chains (fast execution, cross-chain, high throughput) and newcomers with sharper “crypto-to-fiat” or “PayFi” value propositions are siphoning interest and capital.

At this junction, Cardano risks sliding into “good on paper but poor in demand.” For many investors, that’s a risky gamble, especially given how crowded and competitive the blockchain landscape is now.

Enter Remittix: Why Some Investors Are Eyeing It as a Tactical Exit or Diversification Move

While ADA wrestles with structural complexity, another story is unfolding in the presale space: Remittix. https://remittix.io/ Here’s what catches attention about it:

● Clear utility and a simple value proposition: send crypto, recipient receives fiat; cross-chain support; real-world payment rails. https://remittix-organization.gitbook.io/remittix/vision/crypto-usage-for-cross-border-payments No hype, just utility.

● Strong early backing and presale traction: substantial funds raised, investor interest; public presale allocations are transparent.

● Product rollout: https://x.com/remittix/status/1993280422973669757 The Remittix Wallet is now live and available to download on the Apple App Store; it’s the first major product release – and a massive milestone for the entire project.

● Lower structural risk (on certain dimensions): smaller token supply compared to mega-cap altcoins; if tokenomics and launch execution go well, upside-per-token could be meaningful.

● Timing matters: in a cooling market, early-entry tokens with utility may outperform older projects, dependent on massive ecosystem growth.

In a sense, Remittix represents a hedge: less dependent on long-term protocol adoption cycles, more on immediate use-case growth and global payments demand. For investors wary of Cardano’s “all-or-nothing” bet, Remittix offers a middle ground.

So What Should You Do: Hold ADA, Diversify, or Exit?

Apparently, Cardano isn’t dead; far from it. However, without renewed adoption, clarity, and momentum, ADA could continue to tread water even as competitors and fresh projects move ahead.

So, you may only want to consider Cardano as a speculative long-haul bet if you believe strongly in blockchains and long-term protocol adoption. But for many investors watching closely, Remittix (RTX) isn’t a throwaway option; it’s a serious tactical bet. And if you’re keen on seeking a credible path to growing your portfolio, you don’t want to dismiss Remittix’s “utility-first, user-facing token economics.”

Discover the future of PayFi with Remittix by checking out the project here:

Website: https://remittix.io/

Socials: https://linktr.ee/remittix

$250,000 Giveaway: https://gleam.io/competitions/nz84L-250000-remittix-giveaway

Frequently Asked Questions (FAQ)

1. Why are some investors shifting from Cardano (ADA) to Remittix (RTX)?

Because ADA’s growth has slowed. Hydra is still not delivering the high-speed, real-world scaling investors expected, and ecosystem adoption is not expanding at the pace the market demands. Meanwhile, Remittix offers a cleaner, more immediate value proposition: real-world remittance utility, cross-chain payments, and strong presale traction.

2. Is ADA still a good long-term investment?

ADA isn’t “dead,” but it’s in a consolidation phase. Its future depends heavily on the actual adoption of Hydra scaling and a revitalised dApp ecosystem. Investors seeking faster growth are diversifying rather than abandoning ADA entirely.

3. What makes Remittix stand out from other presale tokens?

RTX differentiates itself with a utility-driven model (cross-chain remittances), reported presale growth momentum, a live wallet rollout, and high investor demand driven by real-world use cases. This is a clearer, stronger narrative than typical meme or hype-driven presales.

4. Can Remittix realistically outperform ADA in 2026?

Given Remittix’s early market position and momentum, yes, in terms of percentage ROI. ADA is a large-cap asset, meaning it requires massive inflows to move significantly. As an early-stage company, RTX requires far less capital to achieve greater growth.

5. Is Remittix a high-risk investment?

Like all early-stage crypto projects, it carries risk, but its model is not pure speculation; it’s tied to payments, remittances, and cross-chain utility. Compared to purely meme-driven projects, Remittix is positioned as a more fundamentals-based option.

Disclaimer: This article is for informational purposes only and does not constitute financial advice. Cryptocurrency investments carry risk, including total loss of capital. Readers should conduct independent research and consult licensed advisors before making any financial decisions.

Crypto Press Release Distribution by https://btcpresswire.com

This release was published on openPR.

Source link

10 12, 2025

BTC, ETH, XRP wobble as traders brace for Fed decision

By |2025-12-10T18:20:29+02:00December 10, 2025|Crypto News, News|0 Comments

Bitcoin (BTC) is trading above $92,000 at the time of writing on Wednesday as traders brace for volatility ahead of the upcoming US Federal Reserve (Fed) decision, which is widely expected to cut interest rates. An upswing from the previous day pushed BTC to $94,588, but headwinds amid macroeconomic uncertainty capped the rebound, leading to a minor correction.

Ethereum (ETH) remains broadly stable above $3,300, buoyed by inflows into spot Exchange Traded Funds (ETFs). Ripple (XRP), on the other hand, is edging lower toward its short-term support $2.00 despite steady but mild ETF inflows.

Data spotlight: BTC, ETH, XRP ETF inflows build as markets await Fed rate call

The Federal Reserve (Fed) is expected to announce its monetary policy decision later on Wednesday. Markets have almost fully priced in a 25-basis-point cut, with probabilities in favor standing at 87.6%, according to the FedWatch Tool.

If the Federal Open Market Committee (FOMC) follows through with the cut, it will take the benchmark interest rate down to a range of 3.50%-3.75%. Nonetheless, the weight of the matter lies with the post-meeting statement and Fed Chair Jerome Powell’s news conference. Here, investors will watch for clues about the central bank’s monetary policy direction, especially in the first quarter of 2026. This outlook will help shape sentiment, either bullish or bearish, over the next few weeks.

FedWatch Tool : Source: CME Group

Bitcoin experienced a resurgence of inflows into US-listed spot ETFs, with nearly $152 million streaming in on Tuesday. BlackRock’s IBIT was the best-performing ETF with almost $199 million, followed by Grayscale’s BTC with $34 million and Grayscale’s GBTC with approximately $17 million.

Bitcoin ETF stats | Source: SoSoValue

Ethereum ETFs extended their inflow streak for the second consecutive day with nearly $178 million deposited on Tuesday. Fidelity’s FETH ETF led with approximately $51 million, followed by Grayscale’s ETH with $45 million.

Ethereum ETF stats | Source: SoSoValue 

Meanwhile, XRP spot ETFs recorded their 17th consecutive day of inflows, with almost $9 million flowing in on Tuesday. The cumulative inflow volume stands at $944 million, with net assets of $945 million. A break above $1 billion may affirm institutional interest in XRP ETFs.

XRP ETF stats | Source: SoSoValue

Chart of the day: Bitcoin consolidates above short-term support 

Bitcoin is trading above $92,000 at the time of writing on Wednesday, supported by an uptrending Moving Average Convergence Divergence (MACD) indicator on the daily chart. 

The MACD histogram bars are rising above the mean line, indicating steady bullish momentum.

However, the Relative Strength Index (RSI) on the same chart hovers around the midline, signaling that momentum is cooling. A rejection at this level may accelerate bearish pressure, increasing the odds of a trend correction below $90,000.

BTC/USDT daily chart

Bitcoin also remains below the 50-day Exponential Moving Average (EMA) at $96,830, the 100-day EMA at $102,174 and the 200-day EMA at $103,714, which underpin the general bearish outlook.

A break above the 50-day EMA would likely reinforce the bullish outlook, with buyers targeting the second recovery phase above $100,000.

Altcoins update: Ethereum shows subtle recovery signs while XRP struggles 

Ethereum is edging up above the 50-day EMA at $3,316 at the time of writing on Wednesday. The RSI on the daily chart has crossed above the 50 midline, increasing the probability of recovery toward the 100-day EMA at $3,513.

The MACD indicator on the same chart is almost crossing above the mean line, as green histogram bars expand, supporting the short-term bullish outlook. 

Still, the 200-day EMA at $3,456 may cap rebounds. Moreover, a reversal below the 50-day EMA at $3,316 could push Ethereum toward the pivotal $3,000 support level.

ETH/USDT daily chart 

As for XRP, the token is trading under pressure and below the 50-day EMA at $2.26, the 100-day EMA at $2.42 and the 200-day EMA at $2.47, which reinforces a short-term bearish outlook.

XRP/USDT daily chart 

The RSI remains in the bearish region, at 44 and is pointing downwards, signaling a weakening of bullish momentum. Support at $2.00 is the short-term target, but if selling pressure increases, XRP may extend its down leg to the band support at $1.98-$1.82. Looking up, buyers should accelerate the price above the 50-day EMA at $2.26 to flip the trend upward toward the descending trendline.

Crypto ETF FAQs

An Exchange-Traded Fund (ETF) is an investment vehicle or an index that tracks the price of an underlying asset. ETFs can not only track a single asset, but a group of assets and sectors. For example, a Bitcoin ETF tracks Bitcoin’s price. ETF is a tool used by investors to gain exposure to a certain asset.

Yes. The first Bitcoin futures ETF in the US was approved by the US Securities & Exchange Commission in October 2021. A total of seven Bitcoin futures ETFs have been approved, with more than 20 still waiting for the regulator’s permission. The SEC says that the cryptocurrency industry is new and subject to manipulation, which is why it has been delaying crypto-related futures ETFs for the last few years.

Yes. The SEC approved in January 2024 the listing and trading of several Bitcoin spot Exchange-Traded Funds, opening the door to institutional capital and mainstream investors to trade the main crypto currency. The decision was hailed by the industry as a game changer.

The main advantage of crypto ETFs is the possibility of gaining exposure to a cryptocurrency without ownership, reducing the risk and cost of holding the asset. Other pros are a lower learning curve and higher security for investors since ETFs take charge of securing the underlying asset holdings. As for the main drawbacks, the main one is that as an investor you can’t have direct ownership of the asset, or, as they say in crypto, “not your keys, not your coins.” Other disadvantages are higher costs associated with holding crypto since ETFs charge fees for active management. Finally, even though investing in ETFs reduces the risk of holding an asset, price swings in the underlying cryptocurrency are likely to be reflected in the investment vehicle too.

Source link

10 12, 2025

Bitcoin price BTC USD today: Bitcoin moves toward a $100000 rally: Bitcoin price forecast: Will BTC break $100,000 as Fed rate decision sparks volatility? Bitcoin price today approaches $94,253

By |2025-12-10T16:19:21+02:00December 10, 2025|Crypto News, News|0 Comments

Bitcoin price holds above $92,000 as markets brace for one of the most sensitive Federal Reserve decisions of the year, setting the stage for a potentially explosive move in the coming hours. Traders are positioning carefully. Liquidity is thin. Volatility is rising. And every signal points to a market waiting for a catalyst big enough to break Bitcoin out of its tight range. The tone has shifted, and the data shows it clearly.

Bitcoin’s weekend recovery continued into midweek, helping the coin stay comfortably above $92,000 despite choppy trading. The market has now priced in an 89% chance of a 25 bps Fed rate cut, but this is the lowest level of confidence seen before any FOMC meeting this year. That uncertainty is why every trader is on edge. A softer message from the Fed could spark a rally. A cautious tone could send Bitcoin right back into its restless, sideways pattern.

Volatility is already creeping higher. BTC’s 7-day volatility hit 3.4%, the highest since October 14, signaling growing nervousness across the market. Price swings have become sharper and more frequent, a typical sign of low liquidity and fewer active buyers and sellers. This environment often produces sudden breakouts. Not gradually—but in a single, rapid move.

Futures activity confirms the tension. Bitcoin Open Interest on CME has barely moved, stuck between 121,000 and 122,000 BTC for five straight trading days. That is one of the eight lowest OI volatility readings ever recorded. Historically, such quiet stretches appear right before major market action. The market is frozen in place because big players are waiting for Powell’s signal before deploying capital.

But some data is turning positive. Institutional appetite for Bitcoin is showing early signs of a rebound. US-listed spot Bitcoin ETFs pulled in $151.74 million in fresh inflows on Tuesday, reversing Monday’s $60.48 million outflow. It’s not a huge surge, but it shows improving sentiment at a critical moment. When ETF inflows rise during low-liquidity phases, they often act as a stabilizer—supporting the price and reducing downside pressure. Continued inflows this week would be an important signal for traders betting on a breakout.


Bitcoin’s technical picture is centered around a single decisive number: $94,253. This is the 61.8% Fibonacci retracement level, drawn from the April low of $74,508 to the October all-time high of $126,199. BTC tapped this level again on Tuesday but failed to close above it. A clean break and daily close above $94,253 would open the door toward the psychologically charged $100,000 level—a target bulls have been watching for months.

Momentum indicators are leaning slightly bullish. The RSI is above 50, showing fading bearish strength. The MACD remains in bullish crossover, holding the upside bias that first appeared at the end of November. These signals don’t guarantee a rally, but they support the case for a breakout if the Fed’s tone turns friendly.Still, the next move depends entirely on the Fed. A clear path toward more cuts could spark risk appetite across markets, giving Bitcoin the strength to finally break past resistance. A cautious or hawkish Powell could inject fresh uncertainty and keep BTC trapped below $94,000. Traders are watching every clue—from Powell’s wording to the updated economic projections—because even a subtle signal can shift the entire crypto landscape.

Why is Bitcoin steady above $92,000 as the Fed meets?

Bitcoin started the week with a modest recovery, rising enough to reclaim and hold the $92,000 level. The move comes as traders anticipate a possible 25-basis-point rate cut from the Federal Reserve, which has been battling persistent inflation and a mixed economic backdrop. Even a widely expected rate decision can move markets when uncertainty is high, and this week is no exception.

Bitcoin’s recovery started over the weekend and has carried into midweek. The price action has remained firm despite thin liquidity, which often leaves the market vulnerable to sharp swings. Still, buyers have managed to keep BTC comfortably above immediate support levels, showing that the broader uptrend hasn’t lost its footing.

The Federal Open Market Committee’s discussion on interest rates will be the week’s most important event for global markets. For Bitcoin, which often thrives in low-rate environments, the Fed’s tone on inflation and future cuts will be just as important as the decision itself. Any indication of a softer policy stance could help reinforce risk appetite.

Market positioning shows that traders have priced in an 89% probability of the Fed delivering the expected rate cut. But this is the lowest level of certainty seen before an FOMC meeting this year. The hesitation highlights how sensitive investors have become to small changes in Powell’s guidance, making Wednesday a potential inflection point for Bitcoin.

Is Bitcoin preparing for a volatility spike after the Fed announcement?

Recent trading patterns point toward rising volatility. The 7-day Bitcoin volatility touched 3.4% last week — the highest since mid-October. This rise reflects the choppy, uneven trading conditions that have developed due to lower liquidity and fewer active players in the market.

Daily price swings have also become more pronounced. Bitcoin has seen a series of wide intraday moves, suggesting that traders are positioning aggressively ahead of the Fed decision. This type of behavior is common around major macroeconomic events, but it can easily turn into a sharp upward or downward breakout once the news hits.

Open Interest in Bitcoin futures has remained unusually flat. It has stayed locked between 121,000 and 122,000 BTC for five consecutive trading days — one of the lowest volatility periods ever recorded in futures activity. Historically, such quiet conditions often precede strong market moves. This lack of futures participation suggests traders are waiting for the Fed before committing capital.

Many analysts believe that once participation on CME rises again, the direction of the next move will become clear. If futures traders return in strong numbers after the Fed announcement, it will help confirm whether Bitcoin is ready for an upside breakout or preparing to retest lower ranges.

For now, the setup points to potential volatility driven by anticipation rather than momentum. But that momentum could quickly return if new economic signals emerge.

Are institutional investors showing renewed confidence in Bitcoin?

A mild but noticeable improvement has appeared in institutional flows. US-listed spot Bitcoin ETFs recorded $151.74 million in inflows on Tuesday, reversing the previous day’s $60 million outflow. This quick swing back to inflows is a positive sign and suggests that long-term investors still view Bitcoin as a strategic asset.

ETF inflows matter because they represent steady, regulated demand. When institutions buy through ETFs, it often reflects a broader shift in confidence rather than short-term speculation. For Bitcoin to regain momentum and push higher, this inflow trend needs to continue and expand throughout the week.

The recovery in ETF demand has also supported price stability above $92,000. These inflows serve as an anchor when market liquidity is low, reducing the likelihood of sudden drops. Traders typically watch ETF data closely because it offers a reliable snapshot of larger investor sentiment.

If the Fed delivers a dovish message or hints at further easing, ETF demand could rise again as institutions seek alternative stores of value. But a more cautious Fed tone may cool inflows temporarily. The next few days will set the tone for how institutional investors respond heading into year-end.

Will Bitcoin break above its key resistance at $94,253?

Bitcoin has gained 2.82% so far this week, supported by steady buying and a rebound from weekend levels. The price has repeatedly tested a major technical barrier: the 61.8% Fibonacci retracement, located at $94,253. This level is drawn from the April low of $74,508 to the October all-time high of $126,199.

BTC briefly touched this resistance earlier but failed to close above it. The market is now approaching it again. A decisive daily close above $94,253 could unlock room for a move toward the psychological $100,000 level — a round number that carries significant emotional and technical weight.

Technical indicators offer cautious optimism. The Relative Strength Index (RSI) has moved above the neutral 50 line, signaling improving momentum. Meanwhile, the MACD continues to maintain its bullish crossover from late November, suggesting that upward pressure still exists.

However, resistance levels become even more important during periods of low liquidity. If Bitcoin fails to break through $94,253 again, it may slip back into a choppy range as traders wait for stronger catalysts. The Fed’s guidance could be the spark that decides whether the breakout succeeds this time.

Source link

10 12, 2025

Solana Price Prediction Signals a Possible Trend Reversal, While DeepSnitch AI Pumps 77%

By |2025-12-10T12:17:11+02:00December 10, 2025|Crypto News, News|0 Comments

Several news and upgrades are flooding the Solana ecosystem in December. Kalshi prediction markets are now tokenized on Solana, Revolut integrated SOL for its 65 million users, Vanguard unlocked SOL ETFs for its 50 million clients, and Base launched a bridge connecting the two blockchains. This makes Solana price prediction bullish for 2026.

DeepSnitch AI is the best presale to invest in now, with a live network, three more agents operating, and users impressed with the technology. The project also launched a bonus offer giving 50% to 100% more tokens to those who invest in the coming days. The numbers exploded, raising over $710,000, and the price pumped 77%.

Coinbase Blockchain launches a bridge to connect to Solana

Base (Coinbase’s blockchain), which functions as a Layer 2 for Ethereum, announced the first native bridge with Solana. This bridge will allow users to transfer SOL and SPL tokens between the two networks. While BASE currently has a TVL of approximately $15 billion, it now has direct access to Solana’s liquidity, which currently has a TVL of $29 billion.

This will allow users to trade any token on the SOL blockchain without having to leave the Base blockchain. Solana benefits by gaining direct access to Coinbase’s over 100 million users, as well as all the institutional liquidity of the Ethereum/Base ecosystem, without needing third-party wrappers or bridges.

This update should generate a large exchange of clients and users between the two networks, boosting TVL, DeFi, and the multichain narrative. A win-win for both sides, and bullish for Solana price prediction.

DeepSnitch AI: An undervalued project with 100x potential

DeepSnitch AI is an artificial intelligence project that aims to return investment power to traders and small investors. While for a long time only big funds and whales were able to achieve explosive gains and access insider information, now DSNT comes to democratize the entire crypto market.

This is because it offers an advanced platform with AI agents that can monitor several on-chain activities, generating reports and sending users the best information in real time. This helps traders understand each market moment, as well as having access to advanced information that can help when making important investment decisions.


But there is another important detail: reports from Bank of America and major research firms like Gartner indicate that the AI ​​sector should be the fastest-growing in 2026, with expectations of growing by 25x by 2030.

So, projects like DeepSnitch AI, which are still in presale, can offer investors a real opportunity for 100x returns.

This can be even more possible with the new bonus offer, which gives investors a chance to earn 50% to 100% more tokens and multiply their bag even more. To do so, those who invest over $2,000 need to enter the code DSNTVIP50 to earn 50% more tokens. Or those who invest over $5,000 need to enter the code DSNTVIP100 to earn 100% more tokens.

Solana price prediction: $200 it’s a key price to be reached

With so much news, Solana is laying the groundwork for 2026, full of demand and use cases. This could be excellent for the token, leaving SOL investor sentiment optimistic for the coming year, and that’s why it’s one of the best cryptos to invest in 2026.

Looking at the weekly chart, SOL shows one of its best moments in recent months. The $130 region was defended, an important move because this is a price that acts as support and has held for almost 18 months. This would be one of the best risk-reward ratios for those who want to invest in SOL.

Meanwhile, the RSI is indicating exhausted selling, forming a potential double bottom, causing the MACD to signal a possible trend reversal. This could cause the Solana price prediction to bounce and test its strongest resistance at the moment, at $200. This is a psychological price that needs to be overcome for SOL to start aiming for a new ATH.

Ethereum exchanges’ balances fell to the lowest level ever

Ethereum is quietly entering its lowest market supply level ever. ETH exchange balances have just fallen below 9% of total supply, a level we’ve apparently never seen before. For comparison, BTC is still sitting near 14.8%.

While one reason for this “disappearing” supply is ETFs, other factors include staking, restaking, L2 activity, collateral loops, and long-term custody.

As a result, the Ethereum supply is becoming more restricted each day, while the price continues to fluctuate between $2,900 and $3,200. With a potential supply shock approaching, it’s possible to see ETH above $4,000 by early 2026.

Conclusion

Solana price prediction has been performing well after defending an important region at $130. Traders are targeting $200 as the next target, but the gain here would only be 55%.

For those seeking more significant gains, presales like DeepSnitch AI are the big event in the crypto market right now. With its bonus offer, investors can earn 50% more tokens using the code DSNTVIP50 or 100% more tokens using the code DSNTVIP100. This will maximize your potential gains, making this the investment with the most upside at the moment.

Visit the official website for more information, and join X and Telegram for community updates.

FAQs

Why are investors excited about DeepSnitch AI? 

DeepSnitch AI offers advanced real-time market analytics, a fast-growing presale, and bonuses of 50% to 100% extra tokens. Its early-stage pricing and strong AI narrative make it a high-upside opportunity.

What are the main Solana adoption trends right now? 

Solana adoption is accelerating thanks to several news and upgrades, including Kalshi markets on SOL, Revolut integration, SOL ETFs via Vanguard, and a new Base and Solana bridge boosting liquidity and user flow.

What supports Solana’s bullish trajectory for the coming years? 

Solana’s bullish trajectory is reinforced by defending the key $130 support zone while momentum indicators point to a trend reversal. Many traders see a potential move toward.

Source link

10 12, 2025

XRP Price Prediction: XRP Stabilizes at Multi-Month Support With Eyes on a Possible Run to $2.50

By |2025-12-10T04:13:14+02:00December 10, 2025|Crypto News, News|0 Comments

XRP approaches a key technical junction near $1.89–$1.94, as traders and analysts watch closely to see if the cryptocurrency can rebound toward $2.50.

This multi-month support has repeatedly acted as a foundation for buyers amid broader crypto volatility. Defending this range could trigger a recovery, while a breach might signal further downward pressure. Ripple’s regulatory updates and adoption trends remain central to market sentiment, adding another layer of caution for investors.

XRP Holds Critical Multi-Month Support

On December 9, 2025, XRP traded between $2.05 and $2.16, according to CoinGecko, reflecting modest declines of roughly 1–2% for the day. Despite these fluctuations, XRP remains above the multi-month support level, though it continues to trend below September’s high near $2.85, as indicated by daily XRP price charts.

XRP must defend $1.94 support to potentially rebound toward $2.50. Source: @ali_charts via X

Crypto analyst Ali (@ali_charts) highlighted the $1.94 threshold, stating, “$1.94 is the support XRP must hold to set up a rebound toward $2.50.” His chart of XRP/USDT perpetual futures on Binance identifies this level as a structural pivot formed by previous lows. Sustained defense of this zone could open the door to retesting resistance near $2.50.

Institutional data shows similar levels acting as high-liquidity points in previous cycles. Based on historical reaction to long-term channels, these zones often attract significant buying, though confirmation typically requires follow-through in volume and price action.

Technical Outlook: Descending Channel and Long-Term Structure

XRP has been moving within a descending channel since September, indicating a series of lower highs and lower lows. TradingView analyst Mahshiddadashzadeh identified a deeper support range at $1.89–$1.77, which has historically provided resilience under market pressure.

XRP Price Prediction: XRP Stabilizes at Multi-Month Support With Eyes on a Possible Run to .50

XRP tests its long-term support between $1.77–$1.89, with a potential short-term rebound if the descending channel holds. Source: mahshiddadashzadeh on TradingView

He noted, “The long-term support range at 1.8965–1.7744 has been tested several times and remains the main line holding the structure together. As long as this zone holds, a short-term rebound toward the channel’s dynamic resistance remains possible.”

Short-Term Sentiment: Social Media and Community Signals

Short-term sentiment remains mixed. A chart shared by crypto signal provider Amonyx (@amonbuy) shows XRP testing an ascending intraday trendline near $2.08. The analyst described the setup as a “huge bull run” opportunity, but this view is highly speculative and contrasts with broader market caution.

Short-Term Sentiment: Social Media and Community Signals

XRP shows bullish momentum signals, with traders anticipating a potential upward move if key support levels hold. Source: @amonbuy via X

Notably, the trendline aligns with short-term support observed across multiple chart timeframes, reinforcing its technical relevance. Targets suggested in community discussions—such as $738—are not grounded in traditional valuation models and are considered symbolic within social sentiment analysis.

Market Context and Ripple Developments

XRP’s price action is closely tied to Ripple’s regulatory and operational milestones. Following the partial resolution of the Ripple SEC case, interest in XRP crypto remains steady, benefiting from improved legal clarity.

Ripple’s expansion into regions such as Japan, the Middle East, and Europe supports network usage and potential liquidity demand. Analysts note that adoption trends, combined with XRP’s relatively low-cost transaction model, influence expectations for the asset’s long-term trajectory.

Looking Ahead: Potential Rebound Toward $2.50

Analysts largely agree that the $1.89–$1.94 support zone will determine XRP’s short-term trend. A sustained hold of this range, supported by volume and market structure confirmation, could see XRP attempt a measured rebound toward $2.30–$2.50.

Looking Ahead: Potential Rebound Toward $2.50

XRP was trading at around 2.15, up 3.30% in the last 24 hours at press time. Source: coingecko

Risk factors remain, including macroeconomic headwinds, liquidity imbalances, or a breakdown of the descending channel. Traders often monitor dynamic resistance, volume spikes, and structural pivots to validate rebound scenarios.

Source link

10 12, 2025

Bitcoin price BTC USD forecast 2025 slashed: Bitcoin price forecast cut to $100K: Why Standard Chartered halves BTC USD 2025 target and pushes $500K goal to 2030

By |2025-12-10T02:12:06+02:00December 10, 2025|Crypto News, News|0 Comments

Bitcoin price forecast 2025: Bitcoin’s strong multi-month uptrend has lost momentum, and the slowdown is already reshaping expectations for the year ahead. British multinational bank and wealth management firm Standard Chartered has sharply cut its multi-year Bitcoin price forecasts following the crypto market’s worsening fourth-quarter performance, as per a report.

Standard Chartered Cuts Bitcoin Price 2025 Forecast And BTC USD Long-Term Outlook

In a report published Tuesday, the bank lowered its 2025 year-end target for Bitcoin to $100,000, down from its earlier projection of $200,000 and its long-term outlook of $500,000 remains unchanged, but the timeline has now been pushed back from 2028 to 2030, as per a Decrypt report.

Bitcoin Corporate Buying Slows, Leaving ETFs as the Main Driver

The bank’s downgrade is tied to a reassessment of Bitcoin demand trends. Analyst Geoffrey Kendrick said the market has lost one of its strongest demand drivers: aggressive corporate accumulation by digital-asset treasuries such as MicroStrategy. According to Kendrick, that phase has “run its course,” leaving future gains dependent almost entirely on ETF buying, as per Decrypt.

ALSO READ: Moore Threads surges 425% in market debut – is China’s ‘Nvidia rival’ the next big AI threat?

ETF Inflows Hit Lowest Level Since Launch

But ETF demand has cooled. Quarterly inflows have dropped to 50,000 BTC, the lowest level seen since US spot Bitcoin ETFs launched, and a steep decline from the 450,000 BTC accumulated per quarter in late 2024 from ETFs and digital asset treasuries combined.


ETF buying has helped prevent deeper pullbacks. Data shows that US spot Bitcoin ETFs have consistently purchased Bitcoin even as prices have hovered just above $90,000. That demand has repeatedly supported prices around the ETFs’ aggregate cost basis since February 2024. During two major corrections, March to August 2024 and January to April 2025, Bitcoin bottomed and reversed near that level, even as weekly ETF inflows turned negative.

ALSO READ: Sunspot the size of a giant: Scientists say it could rival history’s most powerful solar storm

Kevin Hassett’s Potential Fed Chair Appointment Could Impact Markets

The report also notes growing political pressure on the Federal Reserve, affecting broader risk-on assets like Bitcoin. Investors are optimistic about a possible quarter-point rate cut in tomorrow’s interest-rate decision, but much will depend on the Fed Chair’s guidance for 2026.

The potential appointment of Kevin Hassett to the FOMC could tilt policy in a looser direction, encouraging some investors to lean toward “hard” assets such as Bitcoin. On prediction market Myriad, owned by Decrypt’s parent company Dastan, most users expect Hassett to be nominated as Fed chair before March 2026.

Analysts Say Halving-Cycle Models No Longer Apply

Kendrick argued that the old halving-cycle playbook no longer applies, writing that “this time really is different” and suggesting “crypto winters are a thing of the past,” as quoted by Decrypt. Myriad users appear to agree, assigning just a 6% chance that the crypto sector falls into a new crypto winter by the end of February 2026.

BTC USD Near-Term Outlook Hinges on Today’s FOMC Meeting

BTC USD has revisited the $90,000 level multiple times in recent weeks, and analysts say the near-term direction now hinges almost entirely on the outcome of Wednesday’s FOMC meeting.

FAQs

What is Standard Chartered’s new Bitcoin 2025 target?
The bank now expects Bitcoin to reach $100,000 by the end of 2025.

Did the bank change its long-term Bitcoin forecast?
No, the $500,000 target remains, but the timeline has been pushed from 2028 to 2030.

Source link

10 12, 2025

Why Elon Musk’s DOGE is Falling Behind Remittix Price Predictions of 2026

By |2025-12-10T00:11:03+02:00December 10, 2025|Crypto News, News|0 Comments

Dogecoin is pushing through another volatile stretch, but analysts say the narrative has shifted. The Dogecoin price prediction now shows slower momentum, even with rising activity on-chain.

Meanwhile, Remittix is gaining attention as a utility-first project attracting long-term capital and stronger 2026 projections. As Elon Musk’s favourite meme coin loses pace, investors are comparing DOGE’s limited catalysts with Remittix’s growing real-world demand.

Dogecoin Price Prediction Weakens As Strong Resistance Blocks A Breakout

Dogecoin price is hovering around $0.144, but the momentum behind the market’s favorite meme coin is not matching the strength seen in previous cycles. Analysts tracking on-chain activity say the structure looks healthier than in past bear phases, yet the recovery remains slow compared to tokens gaining real-world traction.

While DOGE news continues to highlight whale accumulation and rising activity, many traders now believe the pace of growth is overshadowed by more utility-focused projects like Remittix.

Why Elon Musk’s DOGE is Falling Behind Remittix Price Predictions of 2026

Recent charts show signs of resilience. A long-term indicator similar to the Mayer Multiple remains far below levels seen during major peaks, suggesting neutrality instead of overheating. On-chain data also shows a reset in long-held losses, a pattern historically seen before stronger rallies.


DOGE price prediction models note a surge in active addresses, jumping to over 71,000, the largest spike since September, showing improved engagement. Whale wallets also added over 480 million DOGE in 48 hours, a notable shift after months of distribution.

However, the biggest obstacle remains a thick resistance block near $0.20, where over 11.7 billion DOGE were accumulated. This zone has become a psychological wall that prevents a breakout. Until the market can absorb that supply, the Dogecoin price is likely to stay range-bound, even with the rise in participation.

For now, Dogecoin price prediction updates acknowledge the positive signals but warn that the lack of utility-driven catalysts keeps DOGE trailing behind more ambitious 2026 forecasts, especially for tokens like Remittix that are solving real payment problems rather than depending on sentiment-driven hype.

Metric Dogecoin (DOGE) Remittix (RTX)
Core Purpose Meme-driven asset with speculative demand Payments-focused project solving real crypto-to-fiat settlement issues
Current Narrative Strength Slowing momentum despite active addresses rising Growing traction due to real-world utility and structured ecosystem roadmap
Key Use Case Tipping, culture, and community run Instant crypto-to-fiat transfers, PayFi infrastructure, merchant payout rails
Whale Activity Mixed flows; resistance at $0.20 triggers selling Strategic accumulation from investors seeking utility-driven growth
2026 Growth Catalyst Social sentiment, Elon Musk effect Exchange listings, PayFi network expansion, global payment adoption
Ecosystem Development Slow-moving, limited technical evolution Multiple CEX listings secured (BitMart, LBank), wallet already live
Security & Trust No formal audit-driven narrative Fully audited by CertiK, verified team, ranked #1 for pre-launch tokens
Revenue or Real-World Impact No direct real-world financial use case Helps users convert 40+ cryptos into fiat within hours for global remittances
Why It’s Outperforming Reliant on hype cycles with declining retail strength Utility-first model attracting users frustrated with traditional transfers

Remittix Gains Strength As Dogecoin Momentum Fades

Remittix is quickly becoming a serious challenger in the payments-focused crypto space, and the gap between its trajectory and Dogecoin’s outlook is widening. While DOGE price continues to struggle below major resistance levels, Remittix is attracting strategic buyers who want utility, speed, and long-term relevance rather than social-media-driven spikes. At $0.1190, many investors now call RTX the best crypto to buy now, thanks to its direct real-world application and strong technical foundation.

Remittix is building infrastructure that solves an actual global pain point: slow, expensive cross-border payments. The ability to exchange more than 40 cryptocurrencies into local fiat in a few hours is useful to freelancers, merchants, and foreign workers.

It is that real-time availability, supported by low fees and on-chain visibility, that is making whales turn their backs on DOGE hype and move on to practical projects.

Remittix’s momentum is supported by key pillars inside the ecosystem:

  • A full PayFi system that connects crypto and traditional finance
  • Instant crypto-to-fiat settlement for global users
  • Verified security through top-tier CertiK auditing
  • Exchange listings such as BitMart and LBank secured

On top of this, the 15% USDT referral reward has become a powerful incentive, drawing in new users daily. Unlike Dogecoin, which depends on sentiment swings and influencer chatter, Remittix is growing through measurable adoption and clear utility.

As attention shifts toward projects preparing for real-world scaling in 2026, RTX is shaping up to be one of the few tokens positioned for sustained demand.

Discover the future of PayFi with Remittix by checking out their project here:

Website: https://remittix.io/

Socials: https://linktr.ee/remittix

$250K Giveaway: https://gleam.io/competitions/nz84L-250000-remittix-giveaway

FAQs

1. How risky are new crypto tokens?

New crypto tokens carry higher risk because they often lack proven track records, long-term liquidity, and validated product development. Many projects are still building core features, which leaves investors exposed to delays or changes in roadmap execution.

Security concerns also play a role, since early-stage tokens may not have completed audits or team verification. Investors should check audits, transparency, utility, and real user traction before committing funds.

2. What do analysts say about Dogecoin right now?

Analysts describe the current Dogecoin news as mixed. The DOGE price today shows improvement in active addresses and renewed whale accumulation, but the Dogecoin price prediction still highlights resistance around the $0.20 zone.

Many believe the DOGE price lacks strong catalysts outside social sentiment. While long-term holders see healthier on-chain levels, analysts agree that momentum is weaker compared to utility-driven projects gaining market share.

Source link

Go to Top