The main tag of Crypto News Articles.
You can use the search box below to find what you need.
[wd_asp id=1]

29 11, 2025

Why Ethereum could outperform Bitcoin next year: Ethereum price prediction: Tom Lee targets $7,000–$9,000 and explains why ETH could outperform Bitcoin (BTC USD) by next year

By |2025-11-29T16:08:14+02:00November 29, 2025|Crypto News, News|0 Comments

Ethereum price prediction 2026: Crypto investors are showing strong support for Fundstrat co-founder Tom Lee’s bullish view that Ethereum could outperform major rivals, including Bitcoin, as per a report. Lee predicts that Ethereum might dip toward $2,500 in the near term before surging to between $7,000 and $9,000 early next year, as per a CCN report.

Ethereum (ETH) Could Dip to $2,500 Before Surging to $7,000–$9,000

In a recent conversation with Wealthion’s Chris Perkins, Lee highlighted Ethereum’s global developer base and technical resilience as key advantages,” adding, “I think it’s a true robust community with actual known values, and it’s a neutral blockchain with 100% uptime,” as quoted by CCN.

Why Ethereum Could Outperform Other Cryptos in 2026

Another factor Lee highlighted is the potential for institutional tokenization. Even if major banks like JPMorgan or Goldman Sachs don’t directly run tokenized products on Ethereum, third parties could launch them, attracting significant market liquidity.

ALSO READ: US mass layoff alert: WARN notices hit highest level since 2016 – why economists warn of a weakening labour market

Ethereum Price Outlook: Short-Term Dip Before Major Gain

Lee acknowledged a possible near-term pullback, saying, “Yeah, there is a downside, maybe, to $2,500, but that’s minor compared to the upside of trying to discount a super cycle,” but forecasting a rally to $7,000–$9,000 by the end of January, as per the CCN report.s


He explained that Ethereum’s drop from around $4,800 to below $3,000 followed the October 10 crypto market breakdown and described it as part of a “systematic liquidation cycle,” referencing technical strategist Tom DeMark.

Analysts Highlight Growing Institutional Interest in Ethereum

Crypto analyst Christopher Perkins publicly agreed with Lee’s view, pointing to rising on-chain activity and growing institutional interest.Perkins said, “As institutions consider their crypto infrastructure choices, security and operational risk will be at the forefront of their decision,” adding, “As value comes onchain, every institution will need a settlement layer (aka blockchain),” as quoted by CCN.

ALSO READ: Retirees beware: Why delaying Social Security to age 70 could backfire on you

Perkins further noted that stablecoin settlement volumes are booming, with annual transfers surpassing $50 trillion, according to Token Terminal, signaling Ethereum’s importance as a settlement layer.

He also highlighted the booming stablecoin settlement volumes, and cited the Token Terminal’s report showing annual stablecoin transfer volume surpassing $50 trillion for the year and also emphasized Ethereum’s history, noting that regulated institutions often see ten years of operational track record as the “sweet spot,” as reported by CCN.

Perkins said, “10 years of history, neutrality and no downtime will remain a big differentiator for Ethereum in the institutional space,” as quoted in the report.

FAQs

Why is Tom Lee bullish on Ethereum?
He believes Ethereum’s strong developer base, technical resilience, and neutral blockchain make it a leader in crypto.

Could Ethereum drop in the near term?
Yes, Lee predicts a possible dip to around $2,500 before a major rebound.
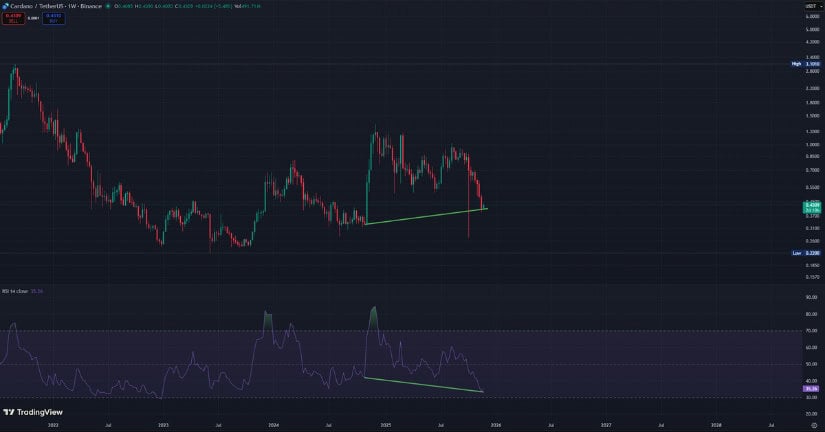
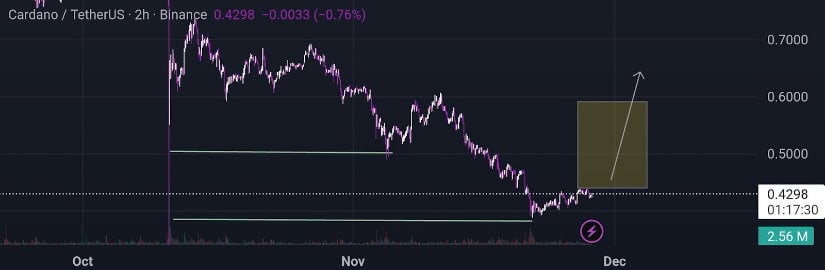
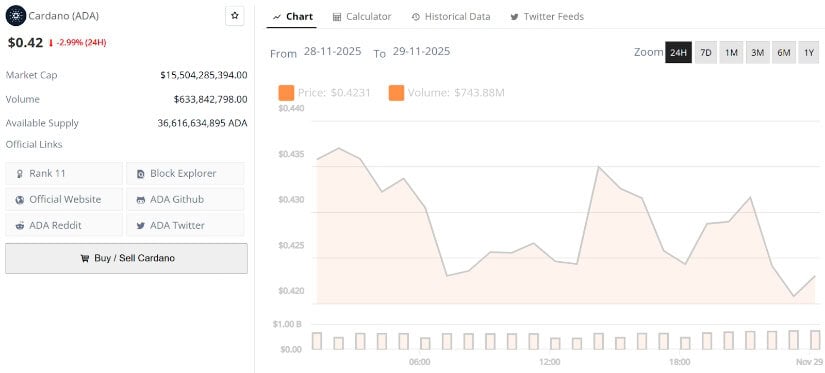
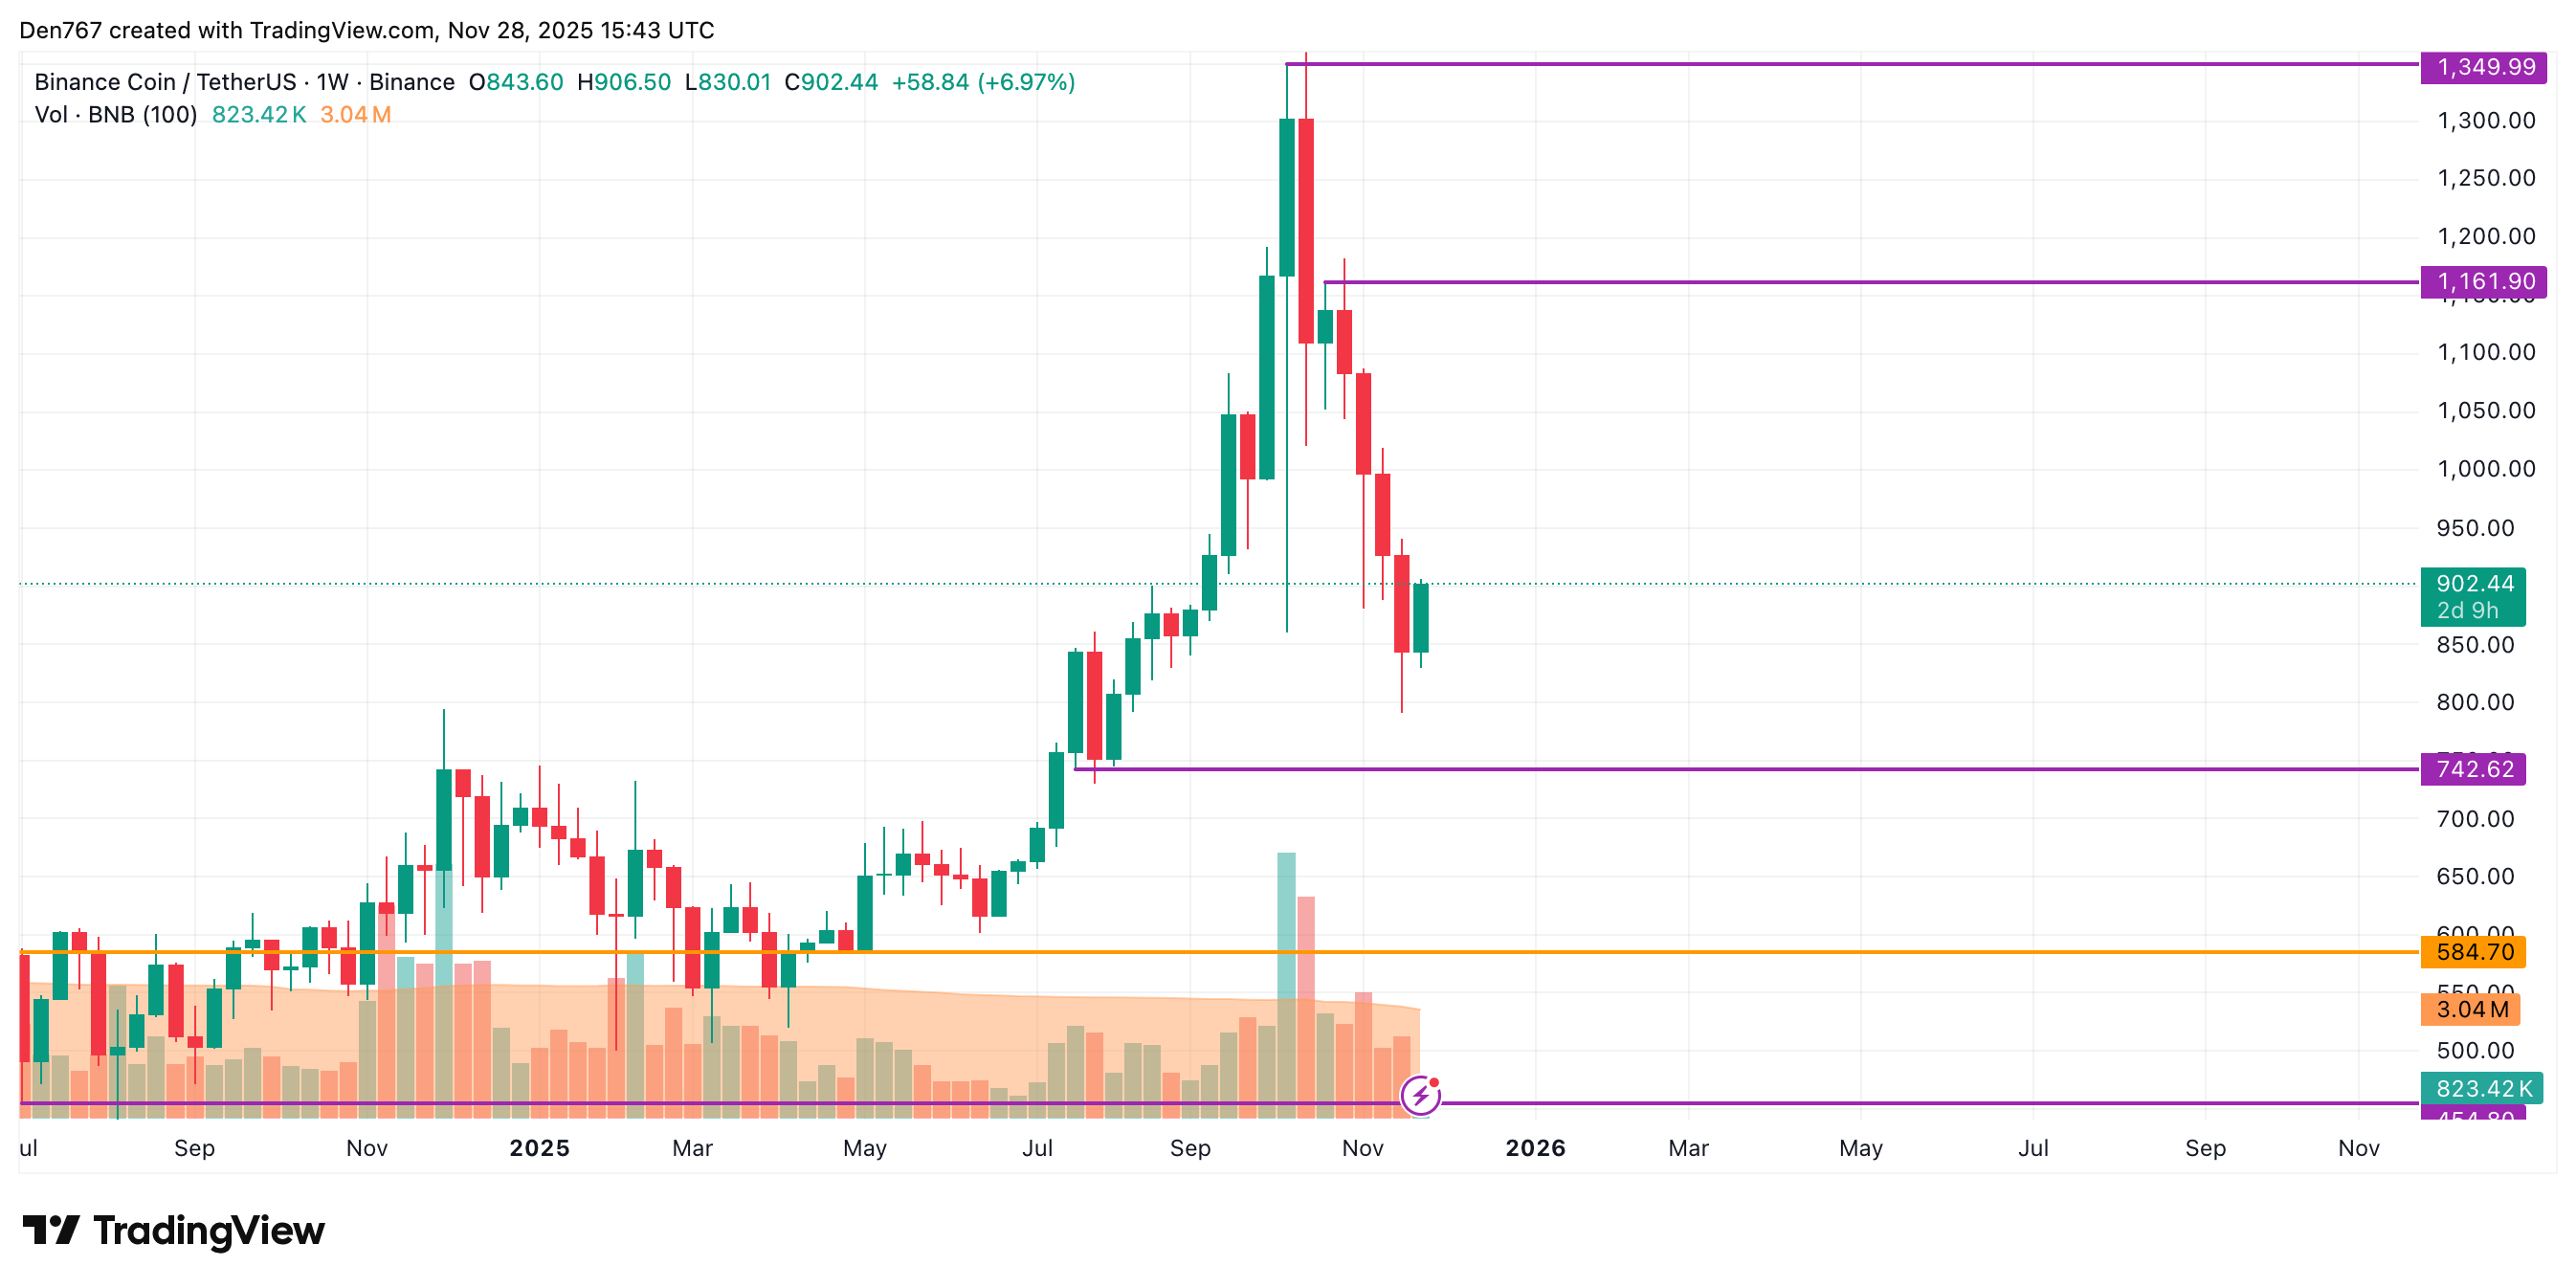
Source link

29 11, 2025

BTCUSD Price Prediction: Heading Towards $100,000 After RSI Hits 38.29

By |2025-11-29T14:07:22+02:00November 29, 2025|Crypto News, News|0 Comments

Bitcoin’s price recently experienced a slight dip, trading at $90,468.84, down by 0.92%. This downturn comes amid a backdrop of significant volatility with a day low of $86,266.95 and a high of $90,628.53. Join us as we explore the latest BTCUSD price prediction and what it could mean for Bitcoin’s journey toward the coveted $100,000 mark.

Bitcoin’s market capitalization stands robust at approximately $1.8 trillion, despite the recent price decrease of $836.72. The trading volume has hit $66.5 billion, surpassing its average of $64.1 billion, suggesting heightened trading interest. Recent news highlights a potential shift in Federal Reserve leadership, fueling expectations of a more dovish monetary policy. Such changes often influence investor sentiment, impacting Bitcoin’s price volatility.

Technical Indicators Insights

The RSI for Bitcoin is at 38.29, indicating an approaching oversold condition. This has integrated well with the MACD histogram, which shows a slight positive divergence at 35.26. Furthermore, the ADX at 44.21 signals a strong trend, while the Average True Range (ATR) stands at 4,422.02, reflecting significant volatility. The Bollinger Bands add to this narrative with the price nearing the lower band at $82,132.67, often a precursor of potential upward momentum.

BTCUSD Price Forecasts

Looking at the forecasts, Bitcoin is predicted to reach $100,096.72 monthly and $138,747.08 quarterly. This optimistic outlook stems from the upcoming holiday season and potential regulatory easements. The yearly forecast, however, predicts a slight dip to $89,991.83, highlighting inherent market risks. Over the next three to five years, experts forecast substantial gains, projecting Bitcoin to hit $147,793.95 to $187,776.60.

Impact of Recent News

The recent rise in Bitcoin’s price above $91,000 was short-lived, influenced by speculation that President Trump might select a more dovish Federal Reserve chair before Christmas. Such political shifts often spark market movements, offering traders short-term opportunities. Additionally, the correction due to partnership expansions within the crypto ecosystem shows externalities still play a crucial role in shaping Bitcoin’s outlook.

Final Thoughts

As Bitcoin hovers on the edge of a new milestone with the potential to reach $100,000, the blend of market optimism and technical indicators suggests positive future movement. However, forecasts can change due to macroeconomic shifts, regulations, or unexpected events affecting the crypto market. Stay tuned to platforms like Meyka AI for the latest real-time insights and data analysis on BTCUSD.

FAQs

Why did Bitcoin’s price recently dip?

Bitcoin’s price dropped due to market corrections after a recent rise spurred by expected changes in Federal Reserve leadership, along with profit-taking activities.

What is the current RSI for Bitcoin?

The RSI for Bitcoin is currently 38.29, indicating that the asset is nearing an oversold condition, which could potentially lead to an upward price movement.

What are the key resistance and support levels for BTCUSD?

Key resistance is around $100,096.72, with support seen at the lower Bollinger Band around $82,132.67. These levels help traders anticipate potential price reversals.

How do recent political changes impact Bitcoin prices?

Political shifts, such as changes in Federal Reserve policy, can impact investor sentiment, leading to increased market volatility and impacting Bitcoin prices.

What are the longer-term forecasts for Bitcoin?

Long-term forecasts suggest Bitcoin could rise to $147,793.95 in five years, driven by broader adoption and favorable market conditions. However, these forecasts can vary with market dynamics.

Disclaimer:


Cryptocurrency markets are highly volatile. This content is for informational purposes only.
The Forecast Prediction Model is provided for informational purposes only and should not be considered financial advice.
Meyka AI PTY LTD provides market data and sentiment analysis, not financial advice.
Always do your own research and consider consulting a licensed financial advisor before making investment decisions.

Source link

29 11, 2025

Dogecoin Price Prediction: DOGE ETF Demand Drops as Token Slips Lower

By |2025-11-29T12:06:09+02:00November 29, 2025|Crypto News, News|0 Comments

The Dogecoin price slipped to around $0.149 today, extending a soft 24-hour decline amid fading demand for the DOGE ETF and a weak rebound attempt.

Despite a brief recovery earlier in the week, DOGE price couldn’t hold momentum, and the market’s reaction to the new spot ETF is turning into the main story.

DOGE ETF Inflows Collapse

Grayscale’s spot Dogecoin ETF (GDOG) posted just $365,000 in net inflows on its second day (Nov 28), an 80% collapse from its $1.8 million debut.

For context, spot XRP ETFs saw $243M on day one, and spot SOL ETFs drew $117M on day one.

This sharp drop shows that institutions aren’t buying the Dogecoin value story yet. Without sustained inflows, the ETF cannot serve as a reliable price catalyst, leaving retail traders to carry the market alone. That reduces conviction and makes every rally fragile.

READ MORE: Quant Crypto Analysis: Extremely Bullish After Xero Partnership

Dogecoin Price Stuck in a Tight Range, But Analysts Flag a Larger Pattern

Dogecoin price is trading near $0.1493, unable to break back above the $0.151–$0.155 band where sellers have repeatedly stepped in. The short-term trend remains soft, despite rising volume and earlier attempts to rebound. RSI sits in a neutral-to-weak zone, confirming cooling momentum.

Two widely followed traders highlighted the broader structure around the Dogecoin price and what it could mean if the larger cycle holds.

From the Bitcoinsensus view, DOGE has been moving in repeating “accumulation → breakout” phases across multiple years. Their chart marks three major accumulation zones, each followed by a sharp wave higher.

They argue that the current consolidation resembles earlier setups, and if the pattern continues, DOGE could be positioning for its next major expansion phase. It’s a long-term framework, not a short-term trigger, but it reinforces how well-defined Dogecoin’s cyclical behavior has been.

In Javon Marks’ analysis, the focus is on the shorter term: he identifies a sustained break above a multi-month descending trendline. He maintains an upside target at $0.6533, which is more than 300% above current prices.

His view is that Dogecoin price has already completed the breakdown-and-recovery structure needed to confirm a bullish reversal, with room for a 100%–170% recovery move before attempting the larger target. For now, his chart signals DOGE still holds its breakout structure despite the recent pullback.

That said, without renewed demand, especially from ETF flows, the technical setups will need stronger confirmation to play out.

READ MORE: Ethereum Price Prediction as Top ETH Whale OG Dumps


Source link

29 11, 2025

Cardano Price Prediction: ADA Tests Critical $0.40 Zone as Bullish Divergence Hints at a Macro Turning Point

By |2025-11-29T10:05:05+02:00November 29, 2025|Crypto News, News|0 Comments

Cardano price is hovering near $0.42 with rare bullish signals emerging on higher timeframes, even as short-term weakness persists and participants watch closely for a decisive move.

Cardano is currently trading near $0.42, extending its broader downtrend while trying to stabilize after a sharp multi-week decline. Volume remains elevated, signaling active participation even as traders debate whether ADA is nearing a cyclical bottom or preparing for further weakness. With sentiment mixed across the market, ADA is sitting at levels where previous reversals have occasionally formed, but confirmation is still needed.

Market Sentiment Sees Deep Undervaluation

A portion of ADA community believes that Cardano price is trading well below its fair value. Analyst Hardy expressed this view recently, noting that Cardano remains “massively underestimated”. This angle reflects growing interest from contrarian participants who see opportunity when a token drifts into long-term accumulation regions.

Cardano’s deep-discount zone is drawing renewed interest from value-focused traders who see ADA trading well below fair value. Source: Hardy via X

While sentiment alone cannot drive a reversal, ADA’s current pricing aligns with historical areas where value-driven buyers have previously shown interest. If broader confidence returns, this deep-discount narrative could support early inflows.

Wyckoff Spring Signal Reappears on Monthly Chart

Cardano has now printed what looks like its second-ever monthly Wyckoff spring, a rare structure previously highlighted by Eilert. The last time this same event occurred, ADA rallied from roughly $0.017 to $3.10, a staggering move that still defines Cardano’s breakout history.

The new spring is forming at a major multi-year support zone, signaling that long-term sellers may be exhausted. A structure like this typically marks the transition from distribution to accumulation, setting foundations for a much broader move if demand returns over the coming days.

Cardano Price Prediction: ADA Tests Critical alt=

Cardano’s monthly chart shows a rare Wyckoff spring forming at major multi-year support, hinting at potential long-term accumulation. Source: Eilert via X

Bullish RSI Divergence Strengthens the Recovery Case

Weekly RSI continues to print multiple bullish divergences, another factor emphasized by Eilert. ADA has not seen this type of momentum shift in several years, and divergence clusters of this scale often develop near macro bottoms.

Bullish RSI Divergence Strengthens the Recovery Case

Cardano’s weekly chart shows multiple bullish RSI divergences forming near historical bottom zones, signaling a potential momentum shift. Source: Eilert via X

With ETFs, stablecoins, and infrastructure updates progressing across the ecosystem, the fundamental backdrop strengthens the argument that Cardano price might be one of the more undervalued assets heading into the next phase of the cycle. If RSI continues climbing while price stabilizes, early trend reversal conditions could form.

Cardano Price Could Recover Towards $0.60

Recent intraday action shows Cardano price reacting precisely from a fresh imbalance zone, a structure highlighted in Miya’s chart. Price is currently hovering near $0.42–$0.40, an area where sell-side liquidity remains dense. If bulls manage to defend this region, a short-term relief move towards $0.55–$0.60 becomes possible.

Cardano Price Could Recover Towards $0.60

Cardano is reacting cleanly from a fresh imbalance zone near $0.42–$0.40, creating a pivotal intraday decision area. Source: Miya via X

However, failure to hold the imbalance floor exposes Cardano price to another sweep lower, targeting the next liquidity pocket near $0.38. Traders will be watching whether volume increases as ADA approaches these zones.

Cardano Price Prediction: What Comes Next?

Cardano’s market structure sits at a key turning point. On higher timeframes, Cardano price is showing rare bullish signals (Wyckoff spring + momentum divergence), but short-term charts still reflect weakness and heavy overhead supply.

Cardano Price Prediction: What Comes Next?

Cardano price is trading around $0.42, down 2.99% in the last 24 hours. Source: Brave New Coin

If buyers reclaim $0.46 to $0.48, a broader trend shift towards $0.55, and eventually $0.62, becomes realistic. Conversely, continued breakdowns below $0.40 open the path back towards deeper supports around $0.36 to $0.33, where long-term accumulation may expand.


Source link

29 11, 2025

Ripple Eyes $6 Target, but Remittix’s Viral Momentum Is Turning Heads

By |2025-11-29T08:04:34+02:00November 29, 2025|Crypto News, News|0 Comments

is stealing the spotlight as traders search beyond the latest XRP price prediction hype and look for a project showing real momentum. While XRP news focuses on whether Ripple can hit the $6 target, Remittix is pulling a different kind of attention with viral growth, live product releases, and a PayFi model built for everyday users. The is already active on the App Store, giving the project a head start that even major altcoins rarely achieve this early.

Investors are noticing how Remittix blends crypto and traditional finance inside one simple system. The platform lets users move digital assets into global bank accounts without friction, delays, or confusing fees. This is where Remittix sets itself apart, and whales are reacting fast.

Why Remittix Is Gaining Traction

  • Global transfers across 30+ countries

  • Real-time FX conversion built into the wallet

  • with #1 pre-launch ranking

  • Multiple CEX listings confirmed, including BitMart and LBank

This mix of trust, utility, and accessibility is driving viral interest. The Black Friday 200% bonus and the new referral program—offering 15% USDT rewards paid out every 24 hours—are accelerating adoption even more. With each wallet upgrade, Remittix strengthens its case as the PayFi leader to watch.

As Ripple chases a $6 breakout, Remittix is shaping a different narrative. Its fast-growing ecosystem, audited infrastructure, and expanding global reach are turning it into the unexpected name dominating investor conversations right now.

Source link

29 11, 2025

Solana Price Prediction: SOL Approaches Make-or-Break Resistance After Strong Bounce From $121

By |2025-11-29T06:04:03+02:00November 29, 2025|Crypto News, News|0 Comments

Solana price is edging into a decisive zone, holding key support while testing major resistance levels as ETF inflows and improving market structure hint at a potential upside continuation.

Solana price is slowly regaining momentum after a volatile week, with market structure stabilizing above short-term supports and institutional flows offering some early signs of relief. While sentiment across the broader crypto market remains mixed, SOL continues to show pockets of strength backed by ETF inflows, improving treasury activity, and gradual technical improvement on higher timeframes.

Even so, upside remains far from guaranteed. Solana now approaches a cluster of critical resistance levels that will determine whether this recovery attempt matures into a broader trend reversal or fades into another lower-high formation. With price hovering near the $140–$142 band, volatility is expected to increase.

Institutional Flows Create a Supportive Backdrop

One of the more notable developments comes from renewed demand on the institutional side. Ted Pillows highlighted how Solana-linked treasury companies are beginning to stabilize and show early recovery signs, a shift that aligns with steadily rising inflows into Solana ETFs. Bitwise’s SOL fund alone has absorbed more than $527 million in inflows since November 10.

Solana ETF inflows have surged past $527 million since November 10, highlighting steady institutional demand despite recent volatility. Source: Ted Pillows via X

This consistency of inflows doesn’t guarantee upside, but it does act as a buffer during pullbacks. If these inflows persist, Solana price prediction models tilt more favorably, especially heading into December, where historically liquidity improves across risk assets.

Technical Structure Approaches a Critical Test

From a charting perspective, Solana price is entering a decisive zone. Price has rebounded sharply from the $121–$122 demand region, an area where buyers stepped in aggressively, according to CryptoGemsCom. This bounce pushed SOL back towards the immediate resistance band at $144, which now becomes the level traders are watching for confirmation.

Solana Price Prediction: SOL Approaches Make-or-Break Resistance After Strong Bounce From 1

Solana has bounced strongly from the $121–$122 demand zone and is now retesting the critical $144 resistance area. Source: CryptoGemsCom via X

Meanwhile, ChiefraT’s chart places emphasis on the two recovery markers at $146.85 and $152.80, both aligning with key Fibonacci retracement levels. These zones previously triggered strong rejections, and a clean breakout through them would signal a meaningful shift in trend strength.

Technical Structure Approaches a Critical Test

Solana is now eyeing the $146.85 and $152.80 Fib resistance levels, key zones where previous rallies were rejected. Source: ChiefraT via X

Key Support and Resistance Levels to Watch

Support remains firmly established around $121–$126, where the most recent reversal originated. Losing this level would place SOL back into a vulnerable position, likely sending the price towards deeper liquidity pockets near $110.

Key Support and Resistance Levels to Watch

Solana current price is $139.50, down 2.05% in the last 24 hours. Source: Brave New Coin

On the upside, the first reaction zone rests at $144, followed by the more significant resistance confluence at $147–$153. This cluster aligns with both historical supply and Fibonacci retracements. Clearing this zone would open the path towards $165, the next major liquidity block from earlier this year.

If momentum accelerates, Solana price prediction scenarios extend towards the broader mid-range level at $180, a region that previously capped bullish expansions during Q2.

Macro Structure Suggests SOL Is Not Done Yet

Higher-timeframe structure presents an interesting case. Gordon’s long-range chart, rooted in a Wyckoff-style multi-phase progression, argues that Solana may still be sitting in the later stages of a large reaccumulation pattern. His model outlines a potential move back towards 320–$380 over the next market cycle, provided price maintains its structural supports and ETF inflows continue stabilizing demand.

Macro Structure Suggests SOL Is Not Done Yet

Solana may still be in a late-stage Wyckoff reaccumulation, with potential upside toward $320–$380 if structure holds. Source: Gordon via X

The broader takeaway is that while short-term volatility remains significant, SOL’s long-term narrative remains technically intact. Institutional flows, on-chain activity, and cyclical positioning all form part of the argument that SOL Solana price could still be building for a larger expansion phase in 2025.

Final Thoughts

Solana price is attempting an early recovery, backed by improving ETF inflows, stabilization across treasury-linked companies, and a constructive bounce from major demand levels. However, the next phase hinges entirely on whether SOL can reclaim the heavy resistance cluster between $144 and $153, a zone that has rejected the price multiple times.

Clearing this area would place Solana in a stronger position to retest mid-range targets around $165–$180, and potentially reopen discussions for higher-timeframe expansion later in the cycle. But until confirmation arrives, participants should remain cautious of lower-high formations and the possibility of another dip towards $121 if demand weakens.


Source link

29 11, 2025

BTCUSD News Today, Nov 28: Will Bitcoin Hit $100K Amid Bull-Bear Impasse?

By |2025-11-29T04:02:06+02:00November 29, 2025|Crypto News, News|0 Comments

Bitcoin, a staple in the crypto market, is currently navigating through a period of mixed sentiments with its price hovering just above $91K. With the recent gains and impressive 11.39% year-to-date growth, Bitcoin’s potential to reach the $100K mark is captivating investors worldwide. Current dynamics reflect a complex interplay between bullish optimism and caution amid macroeconomic influences and holiday trading patterns. Much of the market’s next move hinges on a possible supply cluster breakout that could propel the BTC price rally significantly upward.

Current Dynamics in Bitcoin Pricing

As of today, Bitcoin is priced at $90,468.84, showing minimal change from the previous close. This price stability reflects a broader market pause, with Bitcoin exhibiting a 1.22% increase over the past five days. However, monthly performance depicts a 5.09% decrease, pointing to a fluctuating pattern that is typical for the world’s leading cryptocurrency. The question on every investor’s mind is whether Bitcoin can overcome these hurdles to hit the $100K milestone.

For Bitcoin to achieve further momentum, a supply cluster breakout is essential. Currently, Bitcoin’s relative strength index (RSI) stands at 38.70, indicative of a potential price reversal, while volatility remains marked by an ATR of 4558.31. Investors are closely watching these indicators to discern future movements. Latest discussions suggest varied opinions on how Bitcoin’s journey to $100K will unfold.

Influence of Macro Policy and Thanksgiving Patterns

Inflation concerns and recent policy statements from major central banks are adding layers of complexity to Bitcoin’s price prediction landscape. As the holiday season progresses, trading patterns often shift due to thinner volumes and holiday-related market closures. For Bitcoin, Thanksgiving has historically contributed to increased volatility, as investors reassess portfolios before year-end.

Bitcoin’s current volatility indicators, such as the Bollinger Bands indicating a range between $82,032.20 and $111,601.95, reflect potential price movements. This variability creates both opportunities and risks as traders speculate on Bitcoin’s path forward. The crypto market trends during this holiday period could be pivotal in pushing Bitcoin past psychological barriers.

Investor Sentiment and Market Outlook

Investors remain divided on Bitcoin’s immediate future. With a market cap of approximately $1.8 trillion, Bitcoin’s dominance continues to shape crypto market trends, yet its path to $100K is not assured. The strong trend indicated by an ADX of 44.62 suggests a persistent directional movement, though whether this is upwards to $100K or downwards remains an open question.

The oversold position indicated by an MFI of 14.04 could prompt buying activity, adding upward pressure to Bitcoin’s price. Market sentiment is also influenced by forecasts predicting Bitcoin reaching $100,096.72 monthly. However, the long-term forecast varies, indicating potential setbacks or slower gains.

Final Thoughts

The investment landscape for Bitcoin is teetering between optimism for a rally and caution due to current macroeconomic challenges. The short-term focus for investors lies in observing breakouts from supply clusters and watching volatility indices closely. Longer-term projections offer a promising glimpse into Bitcoin’s potential, buoyed by forecasts of substantial growth in the coming years.

With the volatility and price movement patterns surrounding Bitcoin, investors should remain vigilant. Staying informed of macroeconomic policies and significant market events is crucial for making strategic decisions. Platforms like Meyka, offering real-time insights and predictive analytics, can be instrumental in navigating this complex crypto market.

Ultimately, whether Bitcoin reaches $100K will depend on the broader economic environment, investor behavior, and technological advancements in the crypto sector.

FAQs

What factors are influencing Bitcoin’s potential to reach $100K?

Bitcoin’s journey towards the $100K mark is affected by supply cluster breakouts, macroeconomic policies, and seasonal trading patterns like Thanksgiving. Current stability at $91K and an 11.39% year-to-date increase highlight mixed market sentiments.

How does Bitcoin’s current technical analysis inform investors?

Technical indicators like an RSI of 38.70 and an ATR of 4558.31 highlight possible price reversals and volatility. These metrics are crucial for predicting Bitcoin’s price trajectory and potential breakout points.

Why is market sentiment divided on Bitcoin’s future?

While some investors anticipate a BTC price rally, challenges like economic uncertainties and policy impacts create hesitation. BTC’s oversold status suggests potential buying, yet risks remain significant, leading to mixed outlooks.

Disclaimer:

The content shared by Meyka AI PTY LTD is solely for research and informational purposes. 
Meyka is not a financial advisory service, and the information provided should not be considered investment or trading advice.

Source link

29 11, 2025

Bitcoin Whale Sell-Off Jolts Market as DeepSnitch AI Presale Price Soars 65%

By |2025-11-29T02:01:08+02:00November 29, 2025|Crypto News, News|0 Comments

Bitcoin whales are back in the spotlight after dumping over 9,000 BTC onto exchanges in a single day. The move sent shockwaves through the market, with CryptoQuant analysts saying it was the reason Bitcoin fell to $80,600 on Nov. 21, its lowest price in seven months. Analysts are warning of more downside as whale inflows remain high and stablecoin reserves swell on major exchanges like Binance.

With fear rising and majors losing steam, the attention is shifting to high-upside altcoins. Traders are scanning for assets with room to move, which is why in this article, we’ll take a look at the 3 altcoins that could go the furthest: DeepSnitch AI, NEAR, and the Dogecoin price prediction.

Of the 3, DeepSnitch AI looks to have the most upside. Its price of $0.02527 is up 65% since its initial offering, and it’s already raised more than $600k in stage 2 fundraising, showing very strong early demand. That’s why some believe it could become the next 100x coin when price discovery hits in January 2026.

Dogecoin price prediction in 2026 dampens as BTC turns bearish

Bitcoin took a major hit on Nov. 21 after over 9,000 BTC was deposited into exchanges in a single day, one of the largest whale moves of the year. Analysts at CryptoQuant linked the action to Bitcoin’s steep drop to $80,600, marking its lowest price in seven months. With stablecoin reserves hitting an all-time high of $51 billion on Binance, traders appear to be exiting volatile positions and rotating into safer assets.

Bitcoin Whale Sell-Off Jolts Market as DeepSnitch AI Presale Price Soars 65%For investors, this signals a shift in strategy. Risk appetite is fading, and many are pulling back from large caps like BTC in favor of assets with asymmetric upside. As majors bleed, the opportunity window is opening for select altcoins and presales with strong fundamentals, working products, and low entry points. Here are the 3 that could go far in 2026 as Dogecoin price prediction remains weak.

DeepSnitch AI price prediction: Could this AI-powered tool have saved your portfolio?

When whales dumped 9,000 BTC on Nov. 21, the price of Bitcoin collapsed fast. But for retail traders, the warning signs weren’t obvious until it was too late.


Which is exactly the problem that DeepSnitch AI is trying to solve. This presale project is already live with a suite of AI-powered tools to help traders spot whale moves, liquidity shifts, and early rug-pull signals, before the rest of the market catches on.

In short, had you been using DeepSnitch AI before November 21, you might have been able to pull out before the market crashed.

What’s more, DeepSnitch AI is one of the few projects releasing products in a market defined by high volatility. While Bitcoin and the rest of the markets bleed, DeepSnitch AI provides real-world value, a key selling point sure to make early investors happy when the token goes to market in January 2026.

Over $600,000 has already been raised in Stage 2, and the token is priced at just $0.02527, up 64% from the initial offering, making this the best 100x potential token for 2026.


NEAR Protocol price prediction: Sharp pullback of 18%

NEAR Protocol has seen a sharp pullback, dropping over 18% in the past 7 days to around $1.92 as of November 27th, underperforming the broader market. The dip comes despite recent bullish coverage naming NEAR among the top AI crypto picks for 2025, partly fueled by Foxconn’s $3 billion commitment to AI infrastructure.

Still, the long-term NEAR forecast remains optimistic thanks to its focus on user-owned AI and chain abstraction technology. If sentiment stabilizes, some traders expect NEAR could recover toward the $2.50 – $3.00 range, with stronger moves possible if broader AI narratives return to the spotlight.

However, one concern among traders is that most of NEAR’s upside is already gone, unlike DeepSnitch AI, which is still in its early-stage pricing phase.

Dogecoin price prediction shows mild weakness

Dogecoin’s price prediction is showing mild weakness this week, down 1.4% over the past 7 days to around $0.154. Despite the dip, sentiment around DOGE remains active following the debut of two spot Dogecoin ETFs, one from Bitwise and another from Grayscale. While volume came in lower than expected, the listings are seen as a step toward further institutional access.

Still, meme momentum remains the key driver. Without a fresh Elon Musk Dogecoin update or other catalyst, upside may be limited in the short term. Current resistance sits near $0.16, with analysts watching for a breakout to signal renewed strength in the Dogecoin price prediction. Those looking for greater upside, however, are turning to smaller projects like DeepSnitch AI that have the potential to go 100x or more in 2026.

What’s the verdict?

With whales dumping and the markets looking jittery, most tokens are drifting sideways or worse. That’s certainly true for Hyperliquid and our Dogecoin price prediction, but not for DeepSnitch AI, whose price of $0.02527 is up 65%.

And with over $600k in early fundraising, it’s clear that investor demand is rapidly surging. When DeepSnitch AI hits the markets in January 2026, it could easily go 300x or more.

Visit the official website for more information, and join X and Telegram for community updates.

FAQs

How high will Doge go in 2025?

Most Dogecoin price predictions put it between $0.18 – $0.30, depending on social hype and broader market trends. However, many believe DeepSnitch AI offers a stronger upside and real-world use.

Will Doge reach $10?

Without a major surge in adoption or a renewed Elon Musk Dogecoin update, reaching $10 is highly unlikely.

How high can Doge go realistically?

Many see upside capped unless new catalysts like an Elon Musk Dogecoin update emerge. The current Dogecoin price prediction is not optimal, given the broader crypto sentiment.

Source link

29 11, 2025

XRP Price Prediction: Can XRP Convert Long-Term Demand Into a Full Trend Reversal Toward $7?

By |2025-11-29T00:00:05+02:00November 29, 2025|Crypto News, News|0 Comments

XRP price is once again testing investor conviction as long-term demand, institutional ETF momentum, and unresolved regulatory questions converge at a pivotal technical inflection point for the digital asset.

XRP price today is stabilizing near historically significant support after months of structural consolidation, prompting market analysts to reassess whether the current setup can transition from range-bound trading into a sustained long-term uptrend.

Long-Term XRP Chart Reveals Macro Market Structure

The current market assessment is based on the XRP/USD 2-week chart spanning 2014 to 2025, a timeframe commonly used by professional analysts to smooth short-term volatility and identify primary market cycles. On this macro chart, XRP previously formed a rounded top distribution pattern after multiple failed attempts to break above declining resistance.

The XRP/USD 2-week chart shows a pre-2017–style fractal structure, leading to a speculative long-term $7+ target that remains probabilistic, not guaranteed. Source: Cryptollica on TradingView

A rounded top typically reflects gradual distribution by long-term holders, often followed by a prolonged accumulation phase before any major trend reversal develops. XRP’s current price structure shows the asset now trading inside a long-term demand zone that previously supported multiple historical rebounds.

“This is the same price region where macro buyers stepped in during prior corrections,” one technical analyst noted in a recent market briefing, adding that sustained price acceptance within this zone is critical for any high-timeframe reversal.

ETF Activity and Institutional Interest Shape XRP Market Dynamics

Beyond technical signals, XRP’s latest news continues to be shaped by fast-moving institutional developments. According to publicly available filings tracked by the U.S. Securities and Exchange Commission, nearly 20 XRP-related ETF applications are currently under regulatory review, placing XRP behind only Bitcoin and Solana in total filings.

Bloomberg Intelligence ETF analyst Eric Balchunas recently stated that XRP ETFs are “moving through the regulatory pipeline at an unusually fast pace,” reflecting accelerating issuer interest.

Meanwhile, Matt Hougan, Chief Investment Officer at Bitwise, has estimated that a spot XRP ETF could attract more than $1 billion in assets within months of approval, driven by sustained global retail demand and active trading participation.

Early institutional products launched by Grayscale, Franklin Templeton, Bitwise, and Canary have already seen tens of millions of XRP absorbed in single trading sessions.

At the same time, on-chain data from major tracking platforms shows that over 430 million XRP have moved off centralized exchanges in recent days, tightening liquid supply and increasing the potential for price volatility during high-volume trading periods.

Key Technical Levels Defining XRP Price Outlook

From a structural standpoint, analysts identify $1.80 as XRP’s most significant long-term support, a zone where price previously rebounded sharply amid heavy accumulation. This level also aligns with historical demand visible on high-timeframe charts.

On the upside, resistance currently concentrates between $2.30 and $2.40, making this range the most important near-term breakout threshold. A confirmed high-volume close above this zone could expose the next major technical objective between $2.95 and $3.10, referred to as a macro rejection zone, where sellers previously overwhelmed buyers.

XRP Price Prediction: Can XRP Convert Long-Term Demand Into a Full Trend Reversal Toward ?

XRP is at a macro inflection point, having completed a rounded top distribution and retested long-term demand, setting up potential bullish or bearish pathways based on higher-timeframe confirmation. Source: Scaling mastery on TradingView

For less-experienced readers, a “macro rejection zone” simply refers to a historical price area where rallies repeatedly stalled. Reclaiming such a zone often signals a shift in long-term market control.

Failure to hold current demand, however, could push XRP back toward its rising long-term trendline for further accumulation before any breakout attempt resumes.

Can XRP Realistically Reach $7?

The widely discussed $7 XRP price target is derived from proportional comparisons to XRP’s last full bull-market cycle. From a statistical perspective, a move from $2 to $7 would require a 5× expansion, which is modest relative to XRP’s prior multi-hundred-fold cycle growth.

Can XRP Realistically Reach $7?

A recent bullish XRP/USDT chart projects a potential breakout from ~$2.20 to $7, suggesting a new all-time high by Q1 2026, while analyst forecasts range from $2.29 to $18 amid SEC case developments and XRP Ledger adoption. Source: TOP GAINER TODAY via X

However, professional analysts emphasize that several verifiable conditions would likely need to align:

  • A final regulatory resolution of the ongoing XRP SEC lawsuit

  • Sustained growth in global crypto market liquidity

  • Continued capital rotation from Bitcoin into large-cap altcoins

  • Expansion of real-world asset (RWA) tokenization on the XRP Ledger

  • Regulatory clarity across U.S., EU, and Asian markets

Without these systemic drivers, price models suggest that $7 remains a long-term probabilistic scenario, not a near-term expectation.

XRP at a Structural Turning Point

From a macro-technical perspective, XRP is currently positioned at what analysts describe as a long-term inflection zone. The asset has completed a multi-month distribution cycle, fully retested historical demand, and is now attempting to establish a base for directional expansion.

Two primary scenarios remain in focus:

  • Bullish case: Reclaim of the $3 region followed by a gradual multi-quarter trend expansion.

  • Bearish case: Demand failure leading to deeper accumulation before any major bullish phase.

As one institutional technical strategist summarized, “This structure does not generate a trade signal by itself, but it defines where both opportunity and risk are clearly visible.”

Final Thoughts

XRP price today reflects a market in transition rather than one in confirmed breakout mode. ETF developments, tightening exchange supply, and gradual legal clarity all act as meaningful structural drivers. At the same time, overhead resistance, global liquidity conditions, and regulatory timelines continue to shape XRP’s recovery path.

Final Thoughts

XRP was trading at around 2.19, up 0.66% in the last 24 hours at press time. Source: XRP price via Brave New Coin

While the question of whether XRP can reach $7 remains open, current market evidence suggests that the outcome will depend less on short-term volatility and more on sustained institutional adoption, regulatory resolution, and long-term utility growth.

For now, XRP remains positioned at a critical crossroads—where structure, regulation, and capital deployment converge to define its next major phase.

Source link

28 11, 2025

Binance Coin (BNB) Price Analysis for November 28

By |2025-11-28T21:59:08+02:00November 28, 2025|Crypto News, News|0 Comments

The crypto market is almost green today, according to CoinStats.

Top coins by CoinStats

BNB/USD

The price of Binance Coin (BNB) has gone up by 0.89% over the last day.

Article image
Image by TradingView

On the hourly chart, the rate of BNB is trying to fix above the local resistance of $899.80. If it happens, the accumulated energy might be enough for a further upward move to the $910 mark.

Article image
Image by TradingView

On the longer time frame, one should focus on the daily candle’s closure in terms of the $904.86 level. 

You Might Also Like

Title news

If its breakout happens, traders may witness a test of the $920-$940 range soon.

Article image
Image by TradingView

A less clear picture can be seen on the weekly time frame. The price of BNB is within the previous bar, which means none of the sides has enough strength to seize the initiative. All in all, sideways trading in the range of $850-$950 is the most likely scenario.

BNB is trading at $902.44 at press time.

Source link

Go to Top