The main tag of Crypto News Articles.
You can use the search box below to find what you need.
[wd_asp id=1]

27 11, 2025

Dogecoin (DOGE) Price Prediction: Dogecoin Analysts Reassess Historical Patterns as 2026 Outlook Remains Uncertain

By |2025-11-27T21:46:23+02:00November 27, 2025|Crypto News, News|0 Comments

Dogecoin enters late 2025 at a critical inflection point, as analysts revisit its historical patterns and reassess whether current technical signals support a sustainable recovery into 2026.

While Dogecoin is drawing renewed market attention, experts emphasize that its price structure remains mixed—showing early stabilization signs but also notable uncertainty tied to liquidity, sentiment swings, and broader macroeconomic conditions. This has led researchers and traders to approach cycle-based forecasts with increased caution despite improving short-term signals.

Technical Patterns Show Conditional Upside but Require Confirmation

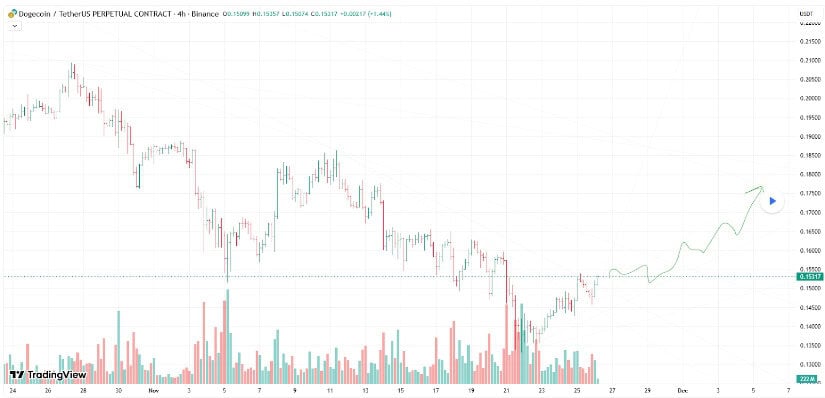
Recent TradingView analysis highlights Dogecoin moving within a falling wedge pattern on the 12-hour timeframe, a structure traditionally associated with possible trend reversals. As of November 27, 2025, DOGE trades near $0.15 after recovering from a brief dip toward $0.14.

Dogecoin’s historical cycle suggests the potential for a significant upswing, with some analysts projecting a possible move toward $5 in 2026. Source: @barkmeta via X

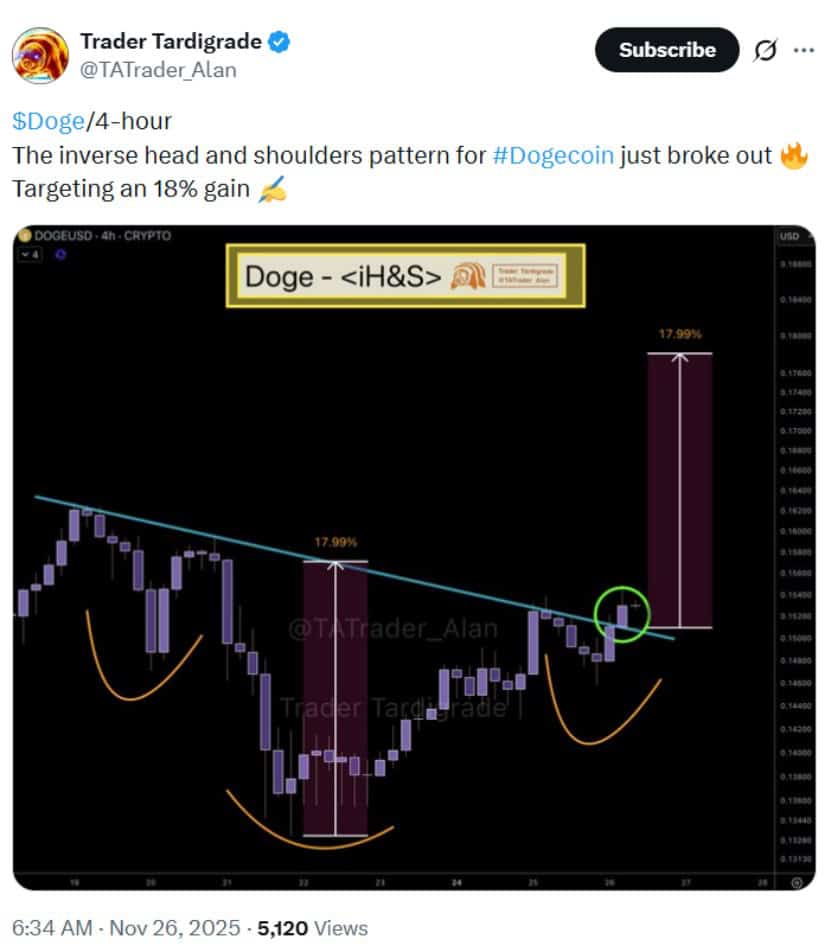
Alan T., an independent market technician who has published multi-year pattern studies across major altcoins, notes that the 4-hour chart’s inverse head-and-shoulders structure may imply a measured move toward $0.18—if momentum and volume align:

“The structure suggests room for a relief push, but wedge breakouts on DOGE historically struggle when volume fails to expand above the 20-period average.”

This contextualizes the pattern within real trading behavior, acknowledging that Dogecoin’s past wedge formations often lacked follow-through unless liquidity conditions improved.

Historical Cycles Offer Insight—But Not Predictive Certainty

A log-scaled weekly chart, widely shared by TradingView researchers, compares Dogecoin’s prior exponential cycles. Historical rallies include:

Some community analysts outline a hypothetical “third cycle” projection that could place DOGE near $5 by 2026. However, cycle-based modeling remains highly debated, especially in meme-driven assets that rely heavily on liquidity, market conditions, and social catalysts.

Dogecoin (DOGE) Price Prediction: Dogecoin Analysts Reassess Historical Patterns as 2026 Outlook Remains Uncertain

DOGE is trading within a 12H falling wedge, and analysts suggest waiting for a confirmed breakout before targeting potential upside levels ranging from $0.16728 to https://x.com/barkmeta/status/1993737989214577049$0.26603.Source: Bithereum_io on TradingView

Crypto researcher @Bitcoinsensus, known for macro-fractal commentary but not for precision forecasting, emphasized the limitations:

“Fractals can illustrate market rhythm, but they are not forward-tested predictive models. Cycle validity varies significantly across assets and environments.”

This clarification reinforces that long-range targets should be viewed as scenarios, not expectations.

Short-Term Structure and Levels Traders Are Watching

Intraday traders are monitoring Dogecoin’s response to wedge resistance and short-term liquidity pockets. Chart analyst @krisspax—who frequently publishes scalping-level setups on Binance data—highlighted that a retest of $0.154 as support could precede a short-lived relief rally. Common reference levels include:

  • $0.160–$0.162: Minor resistance cluster

  • $0.173: 38.2% retracement + previous rejection area

  • $0.185: Upper channel boundary

Short-Term Structure and Levels Traders Are Watching

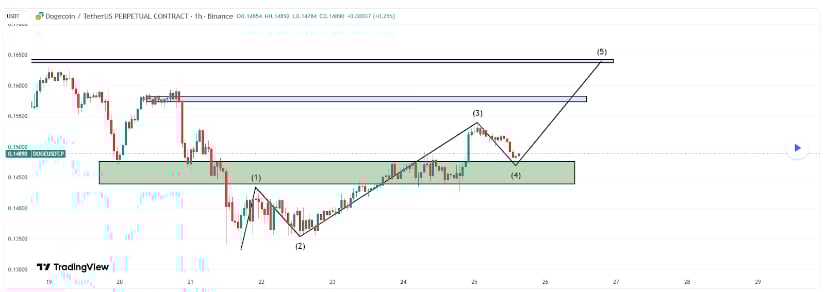
If DOGE maintains its current support zone, a short-term price rebound appears likely. Source: Leo524 on TradingView

These levels can help traders understand where liquidity may concentrate, but they should not be viewed as guaranteed targets. Community enthusiasm—such as optimism from the Doginal Dogs NFT group—reflects sentiment rather than analytical evidence.

Risk Framing and Analytical Outlook

Analysts agree that Dogecoin’s short-term momentum remains fragile. Key support between $0.133–$0.147 is essential to maintain to avoid a deeper retracement.

Risk Framing and Analytical Outlook

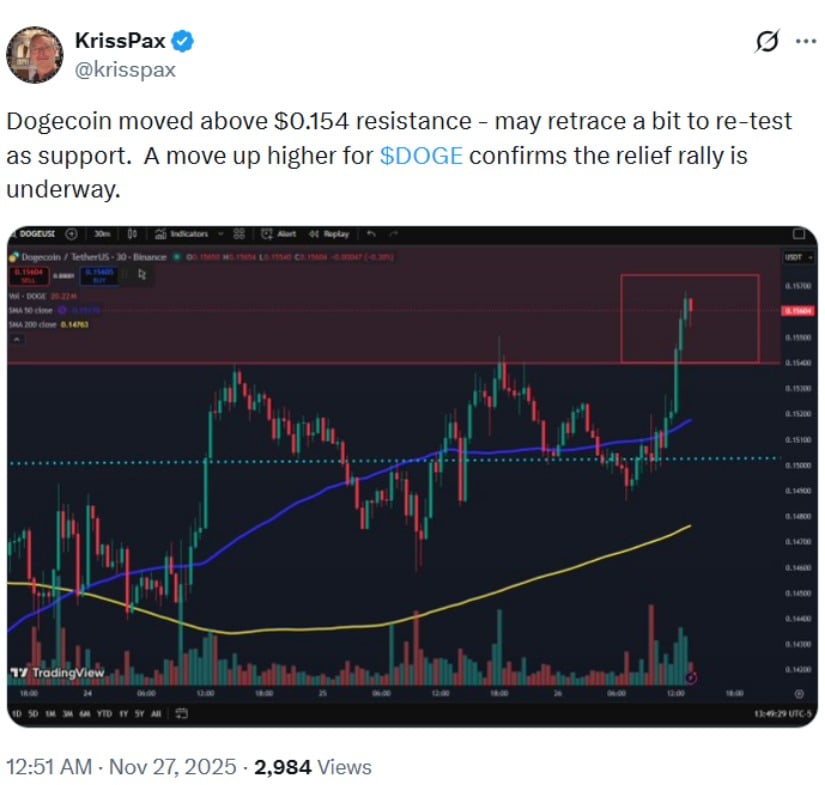
Dogecoin has surpassed $0.154 resistance, with a potential minor retracement before confirming a relief rally. Source: @krisspax via X

CoinCodex and other model-based platforms outline scenario ranges of $0.39–$0.73 under favorable late-2025 conditions. Meanwhile, speculative long-term models projecting $1–$5 depend heavily on historical analogs and lack strong empirical reliability.

Final Thoughts

Dogecoin’s current technical landscape shows early signs of stabilization, with wedge patterns, channel dynamics, and volume clusters worth monitoring. Short-term rallies toward $0.20–$0.23 remain possible if bullish catalysts align, but such moves require verification from volume and broader market flows.

Final Thoughts

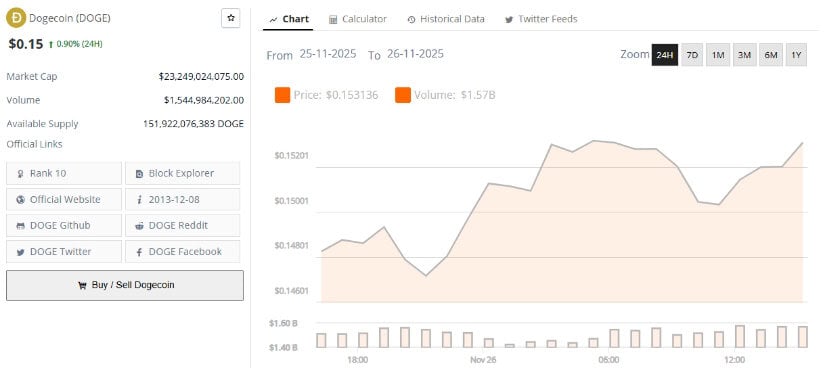
Dogecoin was trading at around $0.15, up 2.57% in the last 24 hours. Source: Brave New Coin

Long-term projections, particularly cycle-based targets such as $5, should be interpreted as speculative scenarios rather than reliable forecasts. As of the latest update, DOGE trades near $0.15, with a market capitalization of approximately $23.1 billion and a circulating supply exceeding 151.9 billion coins.

Traders should approach Dogecoin with disciplined risk management, viewing technical analysis as one tool among many—not a predictive guarantee—especially in a meme-driven asset class.

Source link

27 11, 2025

Bitcoin, Cardano & Tether – European Wrap 27 November

By |2025-11-27T19:45:03+02:00November 27, 2025|Crypto News, News|0 Comments

Bitcoin (BTC) price continues to trade in green above $91,500 at the time of writing on Thursday after rebounding from the key support level. On the institutional front, a modest inflow into US-listed spot Bitcoin Exchange Traded Funds (ETFs) signals a reduction in selling pressure and further support BTC’s recovery. However, traders should still be cautious as on-chain data highlights BTC’s market drifting lower amid limited inflows and fragile liquidity. 

Institutional demand for Bitcoin shows a reduction in selling pressure. According to SoSoValue data, US-listed spot Bitcoin ETFs recorded a mild inflow of $21.12 million on Wednesday, after a positive flow of $128.64 million the previous day. However, these inflow intensities are not as strong as the outflow streak recorded last week. For BTC to continue its recovery, the inflow trend should persist and intensify.

Cardano (ADA) is trading around $0.43 at the time of writing on Thursday, after recovering nearly 7% so far this week. The recovery is further supported by ADA’s large whale orders and buy-side dominance, which have risen alongside positive funding rates. On the technical side, ADA’s price action suggests a further rebound targeting levels above the $0.50 mark.

CryptoQuant’s summary data underpins the bullish outlook, as Cardano’s spot and futures markets show large whale orders, cooling conditions, and buy dominance. These factors signal a potential recovery in the upcoming days.

Chart

Tether CEO Paolo Ardoino blasted S&P Global Ratings for downgrading USDT, rejecting the agency’s assessment that the stablecoin is backed by high-risk assets and accusing traditional finance of misunderstanding Tether’s model.

Tether CEO Paolo Ardoino issued a sharp rebuttal to S&P Global Ratings following the agency’s downgrade of USDT’s peg stability assessment on Wednesday. He described the rating as a sign of “loathing” that the company “wears with pride.”

Source link

27 11, 2025

Bitcoin Hyper (HYPER) Gains Interest as

By |2025-11-27T17:44:13+02:00November 27, 2025|Crypto News, News|0 Comments

XRP Price Prediction

U.S. housing markets show how macro forces create pockets of strength while other areas lag. Two-thirds of homeowners with sub-4% mortgages are staying put, tightening supply in many regions even as other markets soften. That split helps explain the current XRP outlook: macro and capital mechanics can favor narrative assets while leaving majors like XRP in a holding pattern.
Derivatives amplify these shifts. In 2025, record liquidations and heavy futures open interest sent shocks through prices, and Bitcoin derivatives risk forced rapid rotations. When ETFs and perpetuals unwind, capital often chases high-momentum tokens. That dynamic helps explain why Bitcoin Hyper (https://bitcoinhyper.com/)
and the HYPER token have drawn outsized flows while XRP stagnation persists.
Institutional and retail focus can pivot fast. Strong corporate results and viral narratives – seen in Q3 2025 earnings across tech and social platforms – show how concentrated performance attracts capital. In crypto, a compelling catalyst or product launch can reallocate liquidity away from Ripple news and XRP toward speculative, high-story assets, reinforcing uneven performance across the market.

XRP Price Prediction and Current Market Context

Markets are fragmenting like real estate neighborhoods. Some tokens draw fresh demand while others sit idle. In the housing analogy, low-rate mortgages kept supply tight; for XRP, large wallets and exchange-specific liquidity gaps can pare available coins and blunt price reaction across venues.

Short-term technical signals and price action

Short-term XRP technical analysis centers on a clear trading range and the volume nodes that define it. Support forms where buyers clustered previously; resistance appears at distribution points and thick order-book zones. With funding rates compressing toward neutral and open interest down from the October peak, breakouts will need genuine buying rather than leveraged momentum.

Price action often follows Bitcoin stability. If BTC reclaims key thresholds, liquidation risk falls and capital can rotate back into altcoins. Watch whether XRP support and resistance levels hold during larger market swings for clues about next directional moves.

Macro and market-structure drivers

Macro forces are reshaping crypto appetite. USD strength crypto impact shows up when a firmer dollar tightens risk budgets for U.S. investors. Rising 10-year Treasury yields push Treasury yields crypto narratives toward caution and raise the hurdle for speculative bets.

Derivatives events in 2025 amplified spillovers. Large BTC liquidations and ETF outflows removed cushion from the market. With less open interest on major venues, exchanges like Binance and Bybit are showing thinner leverage pools. That reduction limits the spare capital that normally fuels altcoin rallies and makes XRP more sensitive to broad market drawdowns.

On-chain and fundamental indicators

Monitor XRPL activity for early signs of rotation. Key XRP on-chain metrics include transaction volume, active addresses, exchange inflows and outflows, and concentration among top wallets. Rising exchange inflows often precede selling pressure, while shrinking exchange supply can support price if demand appears.

Fundamental catalysts remain important. Ripple’s legal outcomes and new partner integrations would alter perception and could shift capital allocation. Institutional flows and corporate narratives in equities also matter, since money chasing growth stories can spill into tokens with fresh use cases or leverage mechanics.

Market Rotation to Bitcoin Hyper (HYPER) and Risk Amplification

Capital can shift quickly when a strong narrative forms. Think of luxury real estate in Manhattan or short-term rental hotspots where concentrated demand draws deep-pocketed buyers. That same dynamic is at work in crypto rotation toward Bitcoin Hyper (https://bitcoinhyper.com/), where a high-conviction story pulls retail flows, institutional attention, and levered positions away from established tokens like XRP.

Why HYPER gained attention stems from social amplification and easy access to leverage on platforms such as Binance and Bybit. Large narrative-driven moves invite speculation, and record spot ETF outflows removed a key institutional buffer. Traders chase headlines, which can create rapid spikes in price and open interest that mask underlying fragility.

Derivatives venues have a direct role in volatility. Bybit’s past flash liquidations and large platform-level open interest show how leveraged narratives inflate and unwind. Sharp swings in funding rates and crowded long positions raise the chance of derivatives liquidations that cascade across smaller caps.

Open interest behavior matters for systemic risk. When funding compresses and leverage accumulates, a small trigger can force mass deleveraging. In 2025 long liquidations far outpaced shorts, showing an asymmetry that can flip sentiment fast. Exchange liquidations on one platform often spill into others through correlated stop runs.

Exchange-specific patterns tell a risk story. Binance’s futures open interest fell significantly after peaks while Bybit’s leveraged swap interest stagnated. Traders remain cautious to rebuild leverage after major crashes, yet when leverage returns it concentrates downside amplification potential. Recorded waves of exchange liquidations tend to coincide with rapid narrative shifts.

For XRP holders the implications are practical. Rotation into meme or narrative tokens can drain liquidity and raise correlation with broader risk-off moves. XRP can experience amplified drawdowns despite solid fundamentals, especially during episodes of derivatives liquidations and exchange liquidations.

Risk management should be active. Position sizing, hedges in BTC or stablecoins, and options where available help reduce exposure to leverage risk. Monitor open interest, funding rates, and exchange flows closely. If HYPER (https://bitcoinhyper.com/)

rallies prove fleeting, capital may rotate back into majors, offering a window to reassess allocations based on renewed XRPL activity or positive developments from Ripple.

Technical and On-Chain Indicators Influencing Short- to Mid-Term Outlook

Start by mapping clear XRP support resistance levels using volume profile and high-volume nodes across major venues. High-volume nodes act as magnets for orders, like Bitcoin’s $82k-$85k zone, and they help define actionable zones for traders and allocators.

For scenario planning, lay out three paths. Range-bound: price oscillates between defined support and resistance, favoring tight XRP trading strategies with small targets and disciplined stops. Breakout: sustained surge appears after clear XRPL on-chain analytics show rising demand or a major legal or partnership catalyst. Breakdown: macro risk aversion or derivatives-driven forced selling breaks support and accelerates declines.

Use momentum-fade trades near failed breakouts and range plays around established zones. Breakout entries require confirmation: sustained volume increase, reduced exchange outflows, and cross-venue depth that supports higher prices. Avoid leverage because derivatives fragility raises liquidation risk.

Monitor exchange inflows and outflows for signs of selling or accumulation. Rising inflows to Binance, Coinbase, Bybit, or Kraken often precede sell pressure. Sustained outflows to custody providers or cold wallets imply accumulation and reduced XRP liquidity on exchanges.

Track concentration of holdings. Large wallet transfers to custodial services suggest institutional positioning, while moves to retail exchanges point to potential distribution. Check stablecoin flows into exchanges; heavy stablecoin inflows can presage altcoin buying that lifts XRP.

Compare order book depth across exchanges to spot thin listings and localized supply imbalances. Thin order books can produce outsized local moves when flows concentrate, much like regional housing shortages push prices. Conversely, deep order books with abundant XRP supply can cap rallies.

Watch BTC flow dynamics. Large BTC inflows to exchanges or rising BTC dominance raise liquidation risk for alt positions and increase correlation to BTC moves. That linkage matters when plotting mid-term risk scenarios into 2026 and 2027.

For mid-term planning, follow XRPL on-chain analytics around adoption: partner integrations, token issuances, and native use-case growth. Persistent increases in on-ledger activity can reduce effective XRP supply on exchanges and tighten XRP liquidity over quarters.

Consider macro triggers for the XRP 2026 outlook. Positive Ripple legal outcomes, major partnerships, easing U.S. monetary policy, or renewed spot ETF inflows can unlock momentum. Bear triggers include stronger USD, rising yields, or another wave of derivatives liquidations that force broad selling.

Time-horizon guidance: through 2026-2027, blend legal and adoption metrics with macro indicators and derivatives market health. Watch high-volume nodes, exchange flow patterns, and cross-exchange depth to refine XRP trading strategies and to adapt positioning as conditions change.

Investor Takeaways and Tactical Recommendations for U.S. Readers

For U.S. crypto investors, an effective XRP investment strategy balances caution with opportunity. Maintain core XRP exposure without leverage and use strict position sizing and stop-loss discipline to limit drawdowns. Keep a meaningful stablecoin allocation as dry powder to average down after confirmed on-chain demand or positive legal and partnership developments from Ripple.

Adopt a balanced crypto tactical allocation when narrative-driven tokens like Bitcoin Hyper (HYPER) (https://bitcoinhyper.com/)

rally. Trim XRP positions to lock in gains and reduce exposure to rotation, then redeploy capital when on-chain metrics – active addresses, transaction volume, and exchange outflows – show sustained demand. Employ partial hedges such as short-duration BTC protection or options where available to provide downside insulation during sudden market deleveraging.

If pursuing aggressive allocations, cap exposure to leveraged or narrative tokens and set predefined percentage limits, stop-losses, and hard exit triggers. Avoid cross-margining core XRP holdings with high-leverage positions on exchanges like Binance or Bybit. This approach supports sound XRP risk management and prevents contagion from derivatives-driven volatility and record liquidation events.

Daily monitoring is essential: monitor funding rates and exchange open interest with tools like CoinGlass and exchange reports from Bybit and Deribit, watch large wallet movements via XRPL explorers, and track exchange inflows/outflows for XRP. Follow Ripple legal updates, partner integrations, and macro signals – the U.S. dollar index, 10-year Treasury yield, and spot ETF flows – to refine tactical moves and XRP hedging decisions.

Buchenweg 15, Karlsruhe, Germany

For more information about Bitcoin Hyper (HYPER) visit the links below:

Website: https://bitcoinhyper.com/

Whitepaper: https://bitcoinhyper.com/assets/documents/whitepaper.pdf

Telegram: https://t.me/btchyperz

Twitter/X: https://x.com/BTC_Hyper2

Disclosure: Crypto is a high-risk asset class. This article is provided for informational purposes and does not constitute investment advice.

CryptoTimes24 is a digital media and analytics platform dedicated to providing timely, accurate, and insightful information about the cryptocurrency and blockchain industry. The enterprise focuses on delivering high-quality news coverage, market analysis, project reviews, and educational resources for both investors and enthusiasts. By combining data-driven journalism with expert commentary, CryptoTimes24 aims to become a trusted global source for emerging trends in decentralized finance (DeFi), NFTs, Web3 technologies, and digital asset markets.

This release was published on openPR.

Source link

27 11, 2025

Tom Lee Cuts Bitcoin Price Prediction to $100K, Says Tether’s Gold Buying Lifts BTC Outlook

By |2025-11-27T15:43:11+02:00November 27, 2025|Crypto News, News|0 Comments

Tom Lee has reversed his bullish Bitcoin price prediction. | Source: X (@APompliano)

Key Takeaways

  • Tom Lee has lowered his year-end Bitcoin target from $250,000 to “above $100,000.”

  • Lee says Tether’s gold buying will help set a higher long-term price floor for Bitcoin.

  • Despite analysts’ warnings of a bear market, Lee and other analysts still see the potential for a year-end rebound.

Veteran crypto analyst Tom Lee has scaled back his typically bullish forecast for Bitcoin to end the year at $250,000, saying he now expects the BTC to finish at a price “above $100,000.”

The analyst’s shift in tone comes as he also argues that rising gold purchases by stablecoin issuers are helping establish a higher long-term price floor for Bitcoin.

Lee, chair of BitMine and a long-time bullish voice for Bitcoin, told CNBC on Wednesday that BTC may only “maybe” retest its October all-time high of $125,100 before year-end.

“I think it’s still very likely that Bitcoin is going to be above $100,000 before year-end, and maybe even to a new high,” he said.

The comments mark the first time he has publicly softened the $250,000 target he repeated through early October.

Despite significantly reducing his outlook, Lee noted that he still believes “some of those best days are going to happen before year-end.”

Lee explained that his more tepid view on upcoming crypto pricing was due to the Oct. 10 crash, which he says was caused by a “glitch” triggering a wave of automatic liquidations.

Although Lee has never publicly mentioned any names when discussing the technical glitch, it is clear he is discussing Binance.

On Oct. 10-11, screenshots showing USDe, a “synthetic dollar” created by Ethena Labs, dropping to $0.65 on Binance spread across social media.

On Oct. 11, $USDe depegged to $0.65 against USDT. | Source: @PeckShieldAlert on X.

Because Binance’s internal oracle treated the faulty as “real,” it triggered forced liquidations for traders holding USDe-backed positions.

“Almost two million crypto accounts got wiped out, even though minutes before they were actually profitable accounts,” he previously said.

Separately, Lee pointed to rising demand for gold from crypto-backed stablecoins as a factor that could influence Bitcoin’s longer-term trajectory.

In an X post on Wednesday, he claimed that stablecoins have become the largest buyers of gold globally and have been “the singular driver of higher prices” for the precious metal since early 2026.

His comments followed news that USDT issuer Tether became the largest private holder of gold globally, surpassing several central banks.

Lee argued that the trend was not bearish for Bitcoin, but instead helped establish “a higher future price.”

Lee’s earlier bullish calls on Bitcoin were among many from industry leaders hoping for major gains before the end of the year.

In an interview with investment journalist Natalie Brunell, Mike Alfred said the price of Bitcoin could surge to $150,000 or $200,000.

Meanwhile, analyst and commentator Arthur Hayes noted that Bitcoin could potentially lead a powerful year-end rally to as high as $200,000 to $250,000.

However, not everyone has remained optimistic, with some analysts pointing to technical factors suggesting a long-term downturn.

Bitcoin is down more than 20% over the past month, according to CoinMarketCap.

Bitcoin has been trending lower since Oct. 10, following a $19 billion liquidation across crypto markets triggered by U.S. President Donald Trump’s announcement of a 100% tariff on Chinese goods.

After spending nearly a week below $90,000, it finally climbed back above the level on Wednesday.

“After four previous bounces, the breakdown suggests that Bitcoin’s bull cycle has ended and the price has begun a bear market,” CCN analyst Valdrin Tahiri wrote in a recent report.

According to Tahiri, Bitcoin’s current trajectory would leave it trading at $73,000 and $57,000 at the end of 2026 and 2027, respectively.

At the time of reporting, Bitcoin is trading at $91,466.

The post Tom Lee Cuts Bitcoin Price Prediction to $100K, Says Tether’s Gold Buying Lifts BTC Outlook appeared first on ccn.com.

Source link

27 11, 2025

Maxi Doge (MAXI) Aligns With

By |2025-11-27T13:42:00+02:00November 27, 2025|Crypto News, News|0 Comments

Polygon (MATIC) Price Prediction

This section outlines why on-chain launches and memecoin cycles matter for a clear Polygon (MATIC) price prediction. Recent creator-token activity on Layer 2 networks has shown how speculators and builders shift liquidity between chains, and that rotation directly influences MATIC demand for settlement, staking, and bridging fees.
Base’s growth-roughly 10 million users and about $2 billion in TVL-helps explain cross-chain pressure on Polygon. The Base $JESSE launch exposed bot-driven concentration, where two wallets captured roughly 26% of supply and later exited with combined profits near $1.3 million. Events like that highlight on-chain risks that can divert volume away from or back to Polygon.
Maxi Doge (https://maxidogetoken.com/) and similar creator tokens introduce fresh traffic patterns. Tokenomics claims, such as a reported 25% allocation for futures partnerships and publicized staking APYs, create specific demand vectors on Polygon when launches route swaps or staking through MATIC infrastructure.
In the sections that follow, this article will combine observed launch behavior, builder sentiment, and rotation patterns to deliver a practical MATIC forecast and actionable signals for U.S. investors tracking Polygon ecosystem news and MATIC price drivers.

Market context for Polygon and Layer 2 ecosystems

Layer 2 activity has reshaped where builders and users deploy new tokens and apps. In recent months, attention split between networks that promise low fees and those that deliver strong distribution. This debate affects capital flows and user behavior across Polygon and competing chains.

Recent Layer 2 and chain dynamics affecting MATIC

Base vs Polygon comparisons drive developer choices. Base has drawn creator-coin launches and high-profile drops, while Polygon remains attractive for projects prioritizing existing liquidity and integrations. Some teams reported that Base’s marketing promises did not match execution, prompting selective deployments back to Polygon.

Builder sentiment matters for Layer 2 adoption. Projects like Polymarket and other applications have favored Polygon for certain launches. Those moves highlight differences in distribution, tooling, and community support that can influence short-term network demand for MATIC.

Macro crypto conditions shaping price moves

Capital rotation from Bitcoin and Ethereum into speculative altcoins is common during bullish cycles. When BTC and ETH reach fresh highs, traders often shift funds toward new token launches and higher-beta names. That flow boosts Layer 2 activity and can lift MATIC as liquidity chases yield on alternative chains.

Derivatives and futures amplify these swings. Heavy leverage in memecoin markets raises liquidation risk and can cause sharp, rapid price moves across correlated assets. Those dynamics affect how traders view risk on Polygon-based projects.

On-chain risks and bot-driven launch dynamics

Token launch sniping and flashbots strategies have altered distribution patterns. Smart bots and colluding wallets can capture large allocations within seconds, creating skewed supply ownership. Instances where a few wallets grabbed outsized shares have led to swift profit-taking and volatility.

High-profile launches also create operational fallout. Phishing pages, fake contracts, and platform outages emerge during crowded drops, undermining retail confidence. That environment increases memecoin volatility and can reduce willingness among casual users to engage on any Layer 2, including Polygon.

Polygon (MATIC) Price Prediction

The near-term balance for MATIC depends on measurable on-chain reads and market flow. Traders should watch active addresses and TVL trends for fresh signals of demand. Exchange pairings, bridge flows between Ethereum and Polygon, and staking movements shape short-term liquidity and fee revenue that feed into price action.

Short-term technical and network indicators

Monitor MATIC technical indicators such as moving averages, RSI, and volume patterns for immediate bias. Pair those with network metrics like active addresses and bridge inflows to confirm strength. Rising active addresses and inflows from Ethereum often precede higher on-chain usage and reduced selling pressure.

Watch TVL trends and staking flows on Polygon. Climbing TVL and net staking inflows tighten liquid supply and can support price. Sudden spikes in exchange outflows or concentrated wallet moves act as warning signs that can flip momentum quickly.

Medium- to long-term fundamental drivers

MATIC fundamentals hinge on developer activity, dApp adoption, and competitive positioning versus Base and Solana. Healthy growth in meaningful dApps, gaming projects, and payments use cases tends to lift protocol demand. Polymarket and other growth-oriented apps choosing Polygon point to ongoing utility for some builders.

Assess memecoin impact on MATIC when new launches drive transaction volume. High-APY staking contests and meme-driven trading can spike fees and active addresses. Those spikes may not translate into sustained protocol-level demand, so treat them as transient unless developer and treasury metrics back lasting growth.

Scenario-based price outlooks and risk adjustments

Construct scenarios that weight changes in active addresses and TVL trends. A bullish path requires sustained increases in active addresses, higher TVL, and continued dApp launches that produce real fee demand. A bearish path includes concentrated token distribution, large exchange sell-offs, or regulatory pressure on leverage-heavy memecoins.

Adjust risk premia based on observable memecoin cycles and liquidity shifts. If new token launches reroute speculative capital away from MATIC pairs or concentrate supply in a few wallets, downgrade the immediate Polygon price outlook. If TVL and developer metrics improve while staking reduces circulating supply, raise bullish odds.

How Maxi Doge (MAXI) fits MATIC user demand and ecosystem activity

Maxi Doge (https://maxidogetoken.com/) positions itself as an Ethereum-born meme coin with gym culture and high-leverage trading themes. This token profile targets degen traders and fitness-minded crypto fans. Early tokenomics reporting points to heavy marketing allocation and a claimed 25% reserve for futures partnerships, which shapes on-chain behavior.

Maxi Doge fundamentals and target audience

Project materials and media coverage highlight aggressive token distribution and promotional campaigns. Reported staking offers and community contests aim to attract short-term liquidity. High advertised yields create wallet churn, driving approvals, transfers, and staking interactions.

Channels where MAXI could influence Polygon activity

Though MAXI is Ethereum-native, degen traders often move assets across Ethereum-Polygon corridors. If listings appear on Polygon DEXes or MATIC pairs, swap volume and bridge traffic could rise. Futures partnerships that route settlement or liquidity via Polygon would further alter fee capture and routing patterns.

Risks MAXI introduces to MATIC demand

Hype-driven flows from meme coin staking and leveraged marketing can spike transactions without creating durable protocol use. Concentrated holdings and bot activity raise systemic risk. Claims of extreme leverage draw regulator attention, which can trigger rapid capital flight and correlated declines that affect MATIC liquidity and sentiment.

Short-lived trading surges, paired with counterfeit contract risks and exchange outages seen in past memecoin events, underline how futures partnerships and aggressive promotions can amplify volatility. Traders and network operators should monitor on-chain metrics and staking behavior to gauge real user demand versus speculative noise.

Trading, risk management, and signals investors should watch

Active traders should begin with clear on-chain monitoring. Track active addresses, newly deployed contracts, bridge inflows and outflows between Ethereum and Polygon, TVL changes, and staking flows. Spikes in new contracts or bridge activity often precede liquidity rotations that shift capital between MATIC and memecoins.

Pay attention to concentration and wallet metrics. Large holders can create sudden sell pressure-cases where two wallets amassed a large share of supply then realized sizeable profits show how quickly positions can unwind. Combine this with order book and futures metrics: monitor order book depth on Binance and Coinbase, futures open interest on platforms like MEXC, leverage ratios, and liquidation clusters to assess liquidation risk.

Exchange listing and pairing trends matter during memecoin cycles. Where Maxi Doge (https://maxidogetoken.com/) lists – whether on centralized exchanges, DEXes, or futures venues – and which pairs it uses (ETH, USDT, or MATIC) will influence routing of capital and fee capture for Polygon. New listings and presales can temporarily divert liquidity away from MATIC and raise short-term volatility.

Adopt conservative risk-management Polygon tactics: limit position size, set stop-losses, avoid excessive leverage, and define exit rules tied to open interest and social sentiment. Watch for red flags such as platform outages, counterfeit contracts, outsized wallet accumulation, or regulatory statements targeting high-leverage products. Constructive MATIC trading signals include rising active addresses, growing TVL, and increased fee revenue; negative signals include concentrated selling and open interest spikes without on-chain growth.

Buchenweg 15, Karlsruhe, Germany

For more information about Maxi Doge (MAXI) visit the links below:

Website: https://maxidogetoken.com/

Whitepaper: https://maxidogetoken.com/assets/documents/whitepaper.pdf?v2

Telegram: https://t.me/maxi_doge

Twitter/X: https://x.com/MaxiDoge_

Disclosure: Crypto is a high-risk asset class. This article is provided for informational purposes and does not constitute investment advice.

CryptoTimes24 is a digital media and analytics platform dedicated to providing timely, accurate, and insightful information about the cryptocurrency and blockchain industry. The enterprise focuses on delivering high-quality news coverage, market analysis, project reviews, and educational resources for both investors and enthusiasts. By combining data-driven journalism with expert commentary, CryptoTimes24 aims to become a trusted global source for emerging trends in decentralized finance (DeFi), NFTs, Web3 technologies, and digital asset markets.

This release was published on openPR.

Source link

27 11, 2025

Dogecoin Surges to $0.15 — Could DOGE Double from Here?

By |2025-11-27T11:41:06+02:00November 27, 2025|Crypto News, News|0 Comments

Jakarta, Pintu News – The Dogecoin price experienced a slight increase on November 26, signaling a potential recovery. The meme coin briefly traded above the $0.1490 level.

After a week dominated by bearish movements, Dogecoin seems to be gearing up for a more bullish trend. Investors are now starting to wonder if the Dogecoin price could reach $0.3 by December 2025, as optimism grows for a potential price surge.

So, how is the Dogecoin price moving today?

Dogecoin Price Rises 1.82% in 24 Hours

Source: Pintu Market

On November 27, 2025, Dogecoin saw a 1.82% price increase over the past 24 hours, trading at $0.1547, or approximately IDR 2,570. During this period, DOGE fluctuated between IDR 2,474 and IDR 2,604.

At the time of writing, Dogecoin’s market capitalization is estimated at IDR 392.24 trillion, with a 24-hour trading volume of around IDR 24.95 trillion.

Read also: Dogecoin Price Prediction: Will DOGE Rise from the Selling Pressure?

Why did the Dogecoin price soar to $0.3?

The crypto market is currently entering a challenging recovery phase. The prices of Bitcoin , Ethereum, XRP , and Solana are starting to show signs of a rebound. In the midst of this, Dogecoin is attracting attention as it has the potential to increase to $0.30.

Dogecoin’s price surge is closely tied to the overall crypto market recovery. As Bitcoin and other major coins begin to recover, Dogecoin is likely to be boosted by the positive momentum. A broad market recovery usually strengthens the performance of altcoins like Dogecoin.

In addition, the return to popularity of other meme coins such as Shiba Inu , MemeCore, and Bonk (BONK) also adds to the optimistic sentiment. These three coins have recently experienced a surge in value, which could trigger a new wave of interest in Dogecoin. This trend could potentially push DOGE in a bullish direction.

The Ongoing Dogecoin ETF Hype

Other positive momentum comes from the launch of the Grayscale Dogecoin ETF which officially kicked off on Monday, as well as Bitwise’s Dogecoin ETF which is now also launched. The ETF is approved for trading on NYSE Arca under the ticker BWOW and began trading today.

Bitwise announced the news via platform X (Twitter), emphasizing that Dogecoin’s increasing presence in the market requires regulated investment options.

This is a major milestone for the crypto industry, as it provides investors with a safe and organized investment vehicle to trade Dogecoin. This move reflects the growing popularity of more structured and trusted crypto investment products.

Read also: Ethereum Price Rebounded to $3,000 Today: Tom Lee Predicts ETH Could Explode to $9K!

Can the price of DOGE skyrocket 100%?

Dogecoin (DOGE) price recently rose to $0.15 after registering a mild gain of 1% in the last 24 hours. If this bullish momentum continues, DOGE could potentially rise to $0.17 and even touch $0.20 in the near future.

Looking ahead, the Dogecoin price outlook shows a possible push towards the $0.25 level. In the event of a strong surge, the price of DOGE could continue to push all the way to near $0.30 – which would mean a roughly 100% increase from current levels.

Dogecoin Surges to alt=

However, if selling pressure (bearish) starts to dominate the market, the price of DOGE could fall back and retest the support level at $0.15.

Meanwhile, the MACD indicator is currently showing limited positive divergence. Although not yet fully in line with the uptrend, this could turn into an advantage if the upward momentum continues in the next few sessions.

FAQ

What is Dogecoin (DOGE)?

Dogecoin (DOGE) is a cryptocurrency that was originally created as a joke but has grown into a digital currency with wide usage and a large community.

What are ETFs and how do they affect the Dogecoin price?

An ETF, or Exchange-Traded Fund, is a type of investment fund that is traded on a stock exchange like a stock. The launch of the Dogecoin ETF allows investors to more easily access and invest in Dogecoin, which could increase the demand and price of DOGE.

When will the Dogecoin ETF by Bitwise start trading?

The Dogecoin ETF by Bitwise started trading on NYSE Arca today under the ticker BWOW.

That’s the latest information about crypto. Follow us on Google News to get the latest crypto news about crypto projects and blockchain technology. Also, learn crypto from scratch with complete discussion through Pintu Academy and stay up-to-date with the latest crypto market such as bitcoin price today, xrp coin price today, dogecoin and other crypto asset prices through Pintu Market.

Enjoy an easy and secure crypto trading experience by downloading Pintu crypto app via Google Play Store or App Store now. Also, get a web trading experience with various advanced trading tools such as pro charting, various types of order types, and portfolio tracker only at Pintu Pro.


*Disclaimer

This content aims to enrich readers’ information. Pintu collects this information from various relevant sources and is not influenced by outside parties. Note that an asset’s past performance does not determine its projected future performance. Crypto trading activities have high risk and volatility, always do your own research and use cold cash before investing. All activities of buying and selling bitcoin and other crypto asset investments are the responsibility of the reader.

Reference:


Source link

27 11, 2025

Analysts See $300 Coming As Remittix Expands Infrastructure With AppStore Release

By |2025-11-27T07:39:05+02:00November 27, 2025|Crypto News, News|0 Comments

The Solana price prediction story is heating up again as SOL trades around $135 and begins a fresh recovery wave above the $125 zone. Analysts now say Solana could reach $300 in the next major rally if buyers keep control. At the same time, the Remittix ecosystem has just delivered one of its biggest updates yet. The Remittix Wallet is now live on the Apple App Store, giving early holders real utility while the team prepares a major December upgrade.

Solana Price Prediction: SOL Tries To Break Key Levels

Analysts See 0 Coming As Remittix Expands Infrastructure With AppStore Release

Source: Tradingview

Solana started a solid recovery above $125 and has reached $128 and then $130. SOL is currently trading above the 100-hour simple moving average, which tends to indicate strength. There is also a bullish trend line that is taking shape around $130. This will provide a price with additional strength in the event the market withdraws.

The initial significant resistance is at $135, where buyers have been having difficulties. A break of above $145 on clean will open the path to a break of above $155 and perhaps $162. It is the opinion of many analysts that once Solana retains above 130 and breaches the 145 point, a significantly bigger move can come after that.

Other leading analysts have even moved their long-term price prediction target of Solana to $300, which is backed by a high rate of network activity and a rising market sentiment. SOL may experience some weaknesses despite the bullish set-up in case it fails to breach the limit of $135 in the near future.


The initial support is at approximately $130, and the price may start to fall to $127 in case of breaking. When SOL falls below $124 by sellers, then further correction to 120 is probable.

Remittix Expands With App Store Release

While Solana lines up for a possible run to $300, Remittix (RTX) is gaining attention for a different reason: the team is shipping real products that users can download and use today. The Remittix Wallet is now officially live on the Apple App Store. Remittix has raised more than $28.2 million, and over 686 million RTX tokens have been sold. The current price is $0.1166.

This is Phase 1, giving users a fast and secure crypto wallet. The next upgrade will bring crypto-to-fiat transfers, letting people send crypto and have the money arrive in bank accounts across 30+ countries. This is the feature many traders believe could turn Remittix into a global PayFi leader.

Below are reasons why Remittix is getting strong interest:

  • The wallet is live on the Apple App Store, giving the project real-world use right now.
  • Crypto-to-fiat features are coming next, turning the app into a real payments tool.
  • The Remittix Team has passed CertiK Team KYC, adding strong trust and transparency.
  • CEX listings confirmed with BitMart and LBank, and a third exchange already being prepared.
  • A major December announcement is on the way, which could reveal the next stage of the Remittix ecosystem.

Solana or Remittix: Which One Has More Upside?

Both assets are gaining attention, but for different reasons. Solana has the momentum of a large network with strong fundamentals, and some analysts believe the long-term Solana price prediction of $300 is realistic if market conditions stay positive.

Remittix, on the other hand, is focused on real-world payments, expanding infrastructure, and delivering live products during its early growth phase. With the App Store wallet launch and December upgrade coming, many see RTX as a high-upside growth play for 2025.

FAQs

1. What is the current Solana price forecast?

Analysts foresee Solana going to $135, $140, and $145. In case of a break, there are long-term forecasts to indicate $300.

2. What made analysts believe that Solana would be able to hit 300?

Good network demand, increased activity, technical recovery, and long-term chart patterns are all signs that there is more room to have a larger rally.

3. What makes the Remittix App Store launch important?

It gives Remittix a working product that users can download now, proving the team is delivering real utility early.

4. When will Remittix add crypto-to-fiat features?

The team confirmed the upgrade will be added to the same wallet, with a major announcement coming in December.

5. Is Solana or Remittix better for long-term growth?

Solana offers strength as a top-10 coin, while Remittix offers early-stage growth potential with real-world payments use cases.

Discover the future of PayFi with Remittix by checking out their project here:

Website: https://remittix.io/

Socials: https://linktr.ee/remittix

$250K Giveaway: https://gleam.io/competitions/nz84L-250000-remittix-giveaway

Source link

27 11, 2025

Bitcoin BTC USD price prediction latest news: Bitcoin price target: JPMorgan predicts BTC USD could hit $240,000 and reveals why crypto is acting like a macro asset

By |2025-11-27T05:38:14+02:00November 27, 2025|Crypto News, News|0 Comments

Bitcoin price prediction: Bitcoin could rise to $240,000 over the long term, according to a recent JPMorgan note that examines how the asset’s market structure is changing. The projection arrives during a weak stretch for the crypto market, with BTC USD having fallen sharply from its early October peak of $126,000 to around $82,000 in November.

JPMorgan: Crypto Markets Now Driven by Macro Trends, Not the Halving Cycle

In its latest note, JPMorgan said crypto markets are increasingly driven by macroeconomic trends rather than Bitcoin’s familiar halving cycle, which historically preceded major bull runs, as per a report.

The bank said that, “Crypto is moving away from resembling a venture capital style ecosystem to a typical tradable macro asset class supported by institutional liquidity rather than retail speculation,” as quoted by The Street.

Institutional Investors Replace Retail Traders in Crypto Markets

The analysts wrote that, “Cryptocurrency prices are now more influenced by broader economic trends rather than crypto’s predictable four-year halving cycle, the process where the rate of new supply of Bitcoin is cut in half and followed by a bull market rally,” as quoted in the report.

The bank explained that retail participation has dropped and institutional investors now provide market depth, which stabilises flows and potentially anchoring long-term prices.


ALSO READ: AI is taking over Thanksgiving & Black Friday shopping: How to get tech deals even as tariffs drive prices up

BTC USD Target: Bitcoin Price Could Reach $240,000

At a JPMorgan event, one speaker suggested that Bitcoin could potentially reach $240,000 over the long term, describing BTC not as a cyclical asset but as a multi-year growth opportunity, as per The Street report.Despite the structural shift, JPMorgan cautioned that crypto remains a “liquid yet structurally inefficient” market. Because liquidity is uneven, the asset class can still experience sudden and severe price swings.

JPMorgan Introduces New Structured Note Linked to BlackRock’s IBIT

The bank also filed a new structured product tied to BlackRock’s iShares Bitcoin Trust ETF (IBIT). The note offers the possibility of uncapped upside through 2028 if Bitcoin rallies, but with several conditions, as per The Street.

ALSO READ: Thanksgiving 2025: Full list of fast food & restaurants open and closed – McDonald’s, Starbucks, Cracker Barrel, Subway, Krispy Kreme and more

How JPMorgan’s Bitcoin-Linked IBIT Note Works for Investors

If IBIT reaches or exceeds JPMorgan’s preset price by the end of 2026, the bank redeems the note early and pays investors a minimum return of 16 percent.

If IBIT stays below that level, the note continues through 2028 with leveraged exposure. Investors may earn 1.5 times their principal with no upper limit if IBIT surpasses the bank’s 2028 target.

The structure includes downside protection, allowing investors to recover principal in 2028 unless IBIT drops more than 30 percent that year.

However, the bank’s risk disclosure warns that the product does not guarantee the return of principal. If the note is not called early and IBIT’s final value ends below the barrier, investors will lose 1 percent of their principal for every 1 percent decline in the ETF. Under some outcomes, investors could lose their entire principal.

FAQs

What price does JPMorgan think Bitcoin price BTC USD could reach long term?

JPMorgan says Bitcoin could potentially climb to $240,000 over the long term.

Is the halving cycle still influencing Bitcoin?

JPMorgan says broader economic trends now play a bigger role than the halving cycle.

Source link

27 11, 2025

Dogecoin (DOGE) Price Prediction: Technical Patterns Suggest Conditional Upside as Market Seeks Direction

By |2025-11-27T03:37:12+02:00November 27, 2025|Crypto News, News|0 Comments

Dogecoin’s chart is flashing early stabilization signals as new triangular and channel formations emerge, giving traders fresh technical clues after several weeks of choppy, uncertain price action.

Recent multi-timeframe analysis on TradingView shows DOGE attempting to regain structure following a prolonged pullback, with price hovering near $0.15 as of November 26, 2025. While still far below its 2021 peak, the latest patterns suggest the market may be forming a potential base as volatility compresses across the 4-hour, daily, and weekly charts.

Current Price Structure and Short-Term Outlook

On the 4-hour chart, DOGE is attempting to break above a falling wedge—a pattern that can signal bullish momentum when confirmed by price closes and volume expansion. Using standard technical criteria:

  • The price has moved above the wedge’s upper trendline with two consecutive closes,

  • Volume shows a 12% uptick compared to the previous 4-hour average,

  • RSI has recovered from oversold territory toward a neutral zone.

Market analyst Alan T., who has covered crypto price structure analysis for over five years, notes an emerging inverse head-and-shoulders formation. He estimates a measured-move target near $0.18, representing an approximate 18% upside if the breakout holds.

Dogecoin’s repeating fractal structure suggests the potential for a significant upward move, though a $5 target remains highly speculative and dependent on broader market conditions. Source: @Bitcoinsensus via X

Short-term resistance levels—based on historical price clusters and Fibonacci retracement zones—include:

These levels act as potential targets, not certainties. A breakdown back inside the wedge would invalidate the immediate bullish bias.

Historical Patterns and Mid-Term Expectations

Dogecoin has displayed repeating fractal behaviors across multiple market cycles. When viewed on a log-scaled weekly chart, triangular consolidations followed by channel-based expansions have preceded notable rallies in 2017, early 2021, and late 2023.

Dogecoin (DOGE) Price Prediction: Technical Patterns Suggest Conditional Upside as Market Seeks Direction

DOGE is showing strengthening bullish momentum on the 4H chart after a confirmed falling-wedge breakout, with price reclaiming key support and targeting the $0.215 level for a potential 41.5% advance. Source: CryptoWithJames on TradingView

While some analysts draw parallels between current and past structures, such an interpretation requires caution: fractals highlight similarity, not predictability.

Platforms such as CoinCodex, which use a blend of volatility models and moving-average trend projections, estimate a potential $0.39–$0.73 range for late 2025 if broader crypto conditions remain favorable.

Key Price Drivers and Market Factors

1. Social Media & Influencers: DOGE remains highly reactive to social media commentary—especially from high-profile figures. This creates rapid but often short-lived volatility spikes.

2. Market Sentiment: The Crypto Fear & Greed Index shows 19 (Extreme Fear). Historically, such readings have sometimes aligned with early accumulation phases, but do not guarantee reversals.

Key Price Drivers and Market Factors

Dogecoin has broken out of its 4-hour inverse head-and-shoulders pattern, signaling a potential move toward an estimated 18% upside. Source: @TATrader_Alan via X

3. Institutional Interest: Reports from industry outlets indicate that asset managers such as Grayscale and 21Shares have explored DOGE-related ETF products. Approval of such vehicles could introduce new liquidity, though none are finalized at the time of writing.

4. Technical Indicators: DOGE trades below both its 50-day and 200-day moving averages, signaling a broader downtrend. However, low-volume consolidation near support often precedes trend transitions.

5. Tokenomics: Dogecoin’s uncapped supply, increasing by roughly 5 billion coins annually, limits scarcity. This makes long-term valuation more dependent on demand growth than on supply restriction—unlike Bitcoin’s capped model.

Analyst Outlook and Risk Considerations

Short-term momentum remains fragile. Key supports at $0.133–$0.147 must hold to prevent a deeper retracement. A sustained close above $0.16 and ultimately $0.20 would be required to signal a stronger bullish reversal on the daily timeframe.

Analyst Outlook and Risk Considerations

Dogecoin appears to have completed its bearish phase, with exhausted downside momentum and higher-low structure indicating a potential trend reversal toward the next resistance levels at $0.16, $0.173, and $0.185. Source: chart1stry on TradingView

Forecast ranges for 2025 vary significantly:

  • Evidence-based models: $0.39–$0.73 (trend and volatility forecasts)

  • High-speculation scenarios: $1–$5 (primarily sentiment-driven and lacking strong structural justification)

Clear risk framing remains essential: DOGE is a high-volatility asset heavily influenced by sentiment, social media cycles, and speculative flows.

Final Thoughts

Dogecoin’s near-term technical structure—falling wedge breakout attempts, fractal echoes, and channel formations—suggests that upward continuation could develop if volume confirms and macro conditions align. However, these signals rely on confirmation and remain vulnerable to false breakouts.

Final Thoughts

Dogecoin was trading at around $0.15, up 0.90% in the last 24 hours. Source: Brave New Coin

Based on TradingView and CoinMarketCap data, DOGE trades near $0.15 with a market capitalization of around $23.1 billion and a circulating supply exceeding 151.9 billion coins.

As always, technical patterns provide scenarios—not guarantees—and should be combined with disciplined risk management.

Source link

27 11, 2025

XRP Price Prediction: Is XRP Preparing a Move Toward $2.60 After Defending the Key Support Zone?

By |2025-11-27T01:36:02+02:00November 27, 2025|Crypto News, News|0 Comments

XRP is once again at a crossroads as bulls fiercely defend the crucial $2.14 support level, setting the stage for a high-stakes battle over whether the price can reclaim $2.60.

After weeks of bearish pressure, XRP’s recent rebound has reignited short-term optimism across the market. Traders are now closely watching whether this recovery has enough strength to challenge key overhead resistance or if sellers will regain control.

XRP Rebounds From Channel Lows as Market Tests Key Support

XRP’s price, near $2.20 at the time of writing, shows a bounce from the lower boundary of a multi-month descending channel. Based on a review of XRP’s 3-day chart on TradingView, the asset has recovered from long-standing support, demonstrating cautious upside potential.

XRP has rebounded from the lower boundary of its channel, signaling a potential move toward the $2.60 midpoint. Source: Ali Martinez via X

Ali Martinez, a well-followed on-chain analyst with a track record of macro-level charting, notes:

“XRP bounced off the bottom of the channel and could be heading toward the midpoint around $2.60.”

Market data from CoinMarketCap indicates that XRP gained roughly 16% over the past 24 hours, briefly touching $2.25 before easing slightly. The price action followed a steady defense of the $2.00–$2.14 area, which traders consider a critical demand zone for short-term stability.

Why it matters: Holding the $2.14 support suggests that XRP could consolidate before attempting further gains, while a breach might signal renewed downward pressure.

Short-Term Charts Signal Cautious Optimism

On lower timeframes, XRP is moving within an ascending channel, indicating a short-term bullish structure. The price remains above the 100-period moving average (MA), often interpreted as a signal of developing upward momentum. Meanwhile, the Relative Strength Index (RSI) is approaching a breakout from its own downtrend line, suggesting potential near-term strength.

XRP Price Prediction: Is XRP Preparing a Move Toward .60 After Defending the Key Support Zone?

XRP is holding above the 100-period moving average within an ascending channel, with $2.14 as key support and upside targets at $2.21, $2.28, and $2.35. Source: CryptoAnalystSig on TradingView

Technical significance of key levels:

  • $2.14: Critical short-term support; breach may trigger further declines.

  • $2.21, $2.28, $2.35: Incremental resistance targets based on prior swing highs.

  • $2.60: Mid-channel resistance aligned with longer-term trendline.

Limitations: Moving averages and RSI can lag during volatile periods, so traders should use them in conjunction with broader market context rather than as guarantees of price movement.

Broader Trend Still Faces Downward Pressure

Despite the bounce, XRP remains beneath a multi-month descending trendline that has rejected rallies since July. On the daily chart, XRP trades below major exponential moving averages (EMAs):

According to Coinalyze, repeated rejections in the mid-$2.20s indicate persistent selling pressure. The long-term trendline near $2.60 remains the defining technical barrier separating recovery from continuation of the downtrend.

Implication: A confirmed break above $2.60 would mark a meaningful technical shift, while failure to breach resistance could prolong consolidation or downward movement.

Spot and Derivatives Data Reflect Defensive Positioning

According to Glassnode and Coinalyze, weekly spot outflows for XRP have ranged between $15M and $50M over the past month. A recent modest $450,000 inflow was insufficient to offset broader selling trends. Futures open interest has slipped below $4B, with trading volume and options activity declining. Large exchanges report mostly balanced long-short ratios, suggesting traders are hesitant to commit to directional bets.

Why it matters: Declining open interest and subdued volume indicate reduced speculative pressure and a market currently driven by organic trading rather than forced liquidations.

Regulatory Developments Continue to Shape Sentiment

XRP remains sensitive to regulatory developments surrounding Ripple’s ongoing legal case in the United States. Some recent rulings have clarified certain aspects of XRP’s status under U.S. securities law, but several issues remain unresolved. Market participants are watching for updates that could influence institutional participation or long-term valuation.

Additionally, discussions of potential institutional exposure, such as a speculative Grayscale XRP ETF, have generated interest, but no formal approvals have materially altered market dynamics.

Takeaway: Regulatory outcomes are a source of uncertainty and can significantly affect price action. Any forecasts should be considered speculative and contingent on these developments.

Outlook: Can XRP Convert Support Into a Breakout?

XRP’s near-term trajectory depends on whether it can sustain trading above $2.14 and reclaim the $2.37–$2.52 EMA cluster. A confirmed breach of $2.60 would signal a potential move toward $2.80. Conversely, if bullish momentum fades, $2.00 is the immediate downside pivot, followed by a deeper support near $1.88.

Outlook: Can XRP Convert Support Into a Breakout?

XRP was trading at around 2.17, down 1.42% in the last 24 hours at press time. Source: XRP price via Brave New Coin

Risk reminder: All price forecasts are speculative, based on historical chart patterns and current market conditions. Unexpected macro events, liquidity shifts, or regulatory news could invalidate any scenario.

Source link

Go to Top