The main tag of Crypto News Articles.
You can use the search box below to find what you need.
[wd_asp id=1]

24 11, 2025

Will New Spot ETFs Rescue SOL Price?

By |2025-11-24T05:02:10+02:00November 24, 2025|Crypto News, News|0 Comments

The price of the Solana SOL cryptocurrency is down over 12% this week. With the US government shutdown finally over, investors are hoping for an improved crypto and stock market to come soon, after almost a month of top assets trading in the red. SOL, being one of these assets, needs a spark to rescue it from 6-month lows. Could the next wave of approved Spot Solana ETFs be that catalyst?

At press time, Solana (SOL) seems to be facing some resistance at the $140 price level. However, the asset started 2025 with a bang, hitting an all-time high of $293.31 on Jan. 19. While the asset has remained above the $110 price level and seen sporadic success in 2025, 2024 still proved to be the better-performing year. Fortunately, something that 2024 lacks that 2025 and 2026 will have is the presence of SOL ETFs.

Six new spot Solana ETFs have gone live, each offering unique exposure models. 21Shares’ new spot ETF is live, following its Cboe approval and a competitive 0.21% management fee. Fidelity also entered the market with FSOL on NYSE Arca, including a staking component. The ETF quickly positioned Fidelity as the largest traditional manager offering a SOL product. Further, VanEck, Canary Capital, Bitwise, and Grayscale now round out the ETF lineup.

Also Read: How Long Until Shiba Inu (SHIB) Recovers?

This sharp split between price action and capital flow has turned SOL into one of the most-watched tokens in late 2025. There have been points this year where SOL has been the best-performing cryptocurrency on the market, not by value, but by daily chart growth. Its consistency has made SOL one of the best bets on the crypto market, and it is one of the hopeful factors that can help it pick back up in price.

Furthermore, the $130 price point is a crucial level for Solana (SOL). Dipping below $130 could pull the asset to around $100-$105, a level last traded at in April of this year. Dipping below $100 would spell serious trouble for Solana (SOL). The asset has not traded below $100 since January 2024.

Source link

24 11, 2025

ADA Recovery Incoming, Remittix Holders Positioned For December Announcement

By |2025-11-24T03:01:09+02:00November 24, 2025|Crypto News, News|0 Comments

The Cardano price prediction story is getting interesting again, as ADA trades near $0.4032 after a sharp 30% drop over the past month.

The coin has slid into a key support zone around $0.40–$0.44, where past pullbacks have often slowed or reversed. At the same time, PayFi project Remittix (RTX) is quietly lining up a December announcement that many holders hope will be a fresh catalyst as money starts to rotate toward real-world payment tokens.

Cardano Price Prediction: Bulls Defend A Key Support Zone

Right now, the primary focus of Cardano price predictions is the $0.45–$0.44 range. ADA is currently about $0.41 USD, with a market capitalization of around $14.8 billion USD, and it is up roughly 3.3% in the past 24 hours. Over the past week, the price has fallen by approximately 18%, dropping from about $0.50 USD a week ago to the current level.

On the charts, a clear bullish case starts if ADA can close back above $0.45 and then build toward $0.50–$0.52. Many short-term Cardano price prediction models say that a daily close above $0.60 would strongly confirm a trend change. From there, a push toward $0.69 would mean a gain of about 35 per cent from support. If price falls $0.44 on substantial volume, the following clear levels sit around $0.40, or even lower if the whole crypto market turns weaker.

Remittix: Payfi Holders Watch For A December Reveal

Remittix: Payfi Holders Watch For A December Reveal

While ADA fights to turn support into a base, Remittix (RTX) is working on a different story. Remittix is a PayFi project that aims to move crypto directly into real bank accounts in more than 30 countries, with live FX conversion on the way.

The project has already raised over $28.1 million, sold more than 686 million RTX tokens, and is priced at $0.1166. It secured a BitMart listing after crossing $20 million in raised capital and added an LBank listing after surpassing $22 million, with a third centralized exchange said to be in the works.

Why Remittix Is Gaining Attention:

  • Remittix allows users to send crypto to bank accounts in over 30 countries, solving the $19T global payments problem.

  • The upcoming announcement in December might mark the beginning of a new phase for Remittix, adding fuel to its growing momentum.

  • Remittix is fully verified by CertiK, which guarantees that all smart contracts and the entire platform are secure, making it a trusted project in the space.

  • The project’s team has completed full KYC verification, adding a layer of transparency and trust for investors.

How ADA And RTX Can Fit In One Recovery Plan

The big question for Cardano is whether ADA is going to be able to move through $0.44 and jump back to $0.50, $0.60 or even $0.69, or whether it will drop below its $0.40 support. With no major announcements to provide an additional boost, upward price movement will lilley depend on on-chain data and the overall crypto market move.

Meanwhile, Remittix holders are waiting for the December announcement, which could drive the next phase of its PayFi story. Some traders are pairing ADA with Remittix, treating ADA as a safe recovery play while using Remittix as a riskier, actively updated payment token.

FAQs

1. What is the Cardano price prediction for December 2025?

It is based on ADA maintaining a support zone above $0.40. If ADA can remains above this, it may rise to $0.50-$0.52, and even to $0.60. A drop to below $0.40 will expose it to the lower support zones of $0.30 and $0.35.

2. In what way does Remittix differ from other crypto projects?

Remittix is different because it is one of the few crypto companies focused on actual, real-world applications, especially for cross-border crypto-to-bank payments in more than 30 countries. In the space, Remittix combines scalable, secure PayFi technology with a live wallet beta.

3. Why is Remittix considered one of the best altcoins to buy now?

Remittix is included on the list of the best altcoins to buy now because it focuses on real-world use cases, has sound security verified by CertiK, and already has a working product in beta. Its innovative PayFi network allows for cross-border crypto-to-bank payments, making it highly relevant in today’s market.

Discover the future of PayFi with Remittix by checking out their project here:

Website: https://remittix.io/
Socials: https://linktr.ee/remittix
$250K Giveaway: https://gleam.io/competitions/nz84L-250000-remittix-giveaway


This is a sponsored article. Opinions expressed are solely those of the sponsor and readers should conduct their own due diligence before taking any action based on information presented in this article.

Source link

24 11, 2025

XRP Price Prediction: XRP Reclaims $2 as ETF Inflows and Regulatory Clarity Signal Potential Upside

By |2025-11-24T01:00:10+02:00November 24, 2025|Crypto News, News|0 Comments

XRP has climbed back above the $2 mark, supported by improving ETF inflows, regulatory clarity, and technical support, fueling renewed bullish sentiment across the crypto market.

Analysts caution that while optimism is building, historical performance and past cycles do not guarantee future returns.

XRP Rebounds Above $2 Amid Shifting Market Sentiment

XRP price (XRPUSD pair) regained the $2.00 level on the daily chart after a volatile week that briefly pushed it near $1.83. According to on-chain analyst AbsGMCrypto, known for cycle-based models, institutional participation and U.S. regulatory clarity contributed to a modest rebound to $2.04 intraday.

XRP has reclaimed the $2.00 level, signaling renewed bullish momentum in the market. Source:Good Evening Crypto via X

Community sentiment reflects cautious optimism. Posts on social platforms labeled the rally a “boom,” although analysts stress that weekend price swings are common and short-term volatility should not be overinterpreted.

Historical Comparisons: Contextualizing 2016–2017 Cycles

Some analysts have compared the recent corrective structure to XRP’s 2016–2017 cycle, when the asset fell to $0.0054 before rising dramatically. Macro-trader LunaMetrics, specializing in crypto market cycles, notes that while past events illustrate XRP’s resilience during downturns, the current macroeconomic environment, liquidity, and regulatory backdrop differ significantly.

XRP Price Prediction: XRP Reclaims  as ETF Inflows and Regulatory Clarity Signal Potential Upside

XRP volatility persists, but ETFs, Ripple adoption, and U.S. crypto policy are fueling renewed bullish interest. Source: X Finance Bull via X

Disclaimer: Historical performance is not predictive. Current market conditions involve higher institutional participation and post-SEC legal clarity, unlike the 2016–2017 period.

ETF Inflows Strengthen Institutional Footing

XRP’s recent momentum has coincided with the launch of U.S.-listed XRP ETFs. According to preliminary filings and ETF flow trackers:

ETF Inflows Strengthen Institutional Footing

XRP has attracted $422M in two live spot ETFs this week, signaling a quiet liquidity shift from speculation to real utility-driven capital. Source: X Finance Bull Academy via X

These inflows mark growing institutional adoption, particularly for investors previously constrained by regulatory uncertainty. Analysts at Farside Investors, who track ETF performance metrics, note that these products provide new avenues for exposure while reinforcing confidence in XRP following legal developments.

However, on-chain dashboards like Santiment show that ~200 million XRP exited major exchanges within 48 hours of ETF launches, suggesting that short-term liquidity dynamics remain complex. Roughly 42% of circulating XRP is still held at a loss, influencing positioning for both retail and institutional holders.

Regulatory Clarity: Ripple’s Legal Milestones

The SEC vs. Ripple case concluded in 2025 with Judge Analisa Torres’s ruling clarifying that secondary-market sales of XRP are not securities. While banks and payment providers may now feel more comfortable exploring Ripple’s On-Demand Liquidity (ODL) solutions, analysts caution that adoption depends on internal compliance and risk policies.

Macro-trader EconCrypto Insights attributes XRP’s price moderation below $2.30 to broader risk-off sentiment, rising Treasury yields, and a cooling crypto market.

ISO 20022 Integration: Utility Framework

RippleNet’s messaging format is compatible with ISO 20022, enabling smoother integration with institutions using the global payment standard. Payments analyst ClaraFinTech notes this does not imply automatic adoption of XRP, but it strengthens the case for Ripple’s utility in cross-border transfers.

Technical Landscape: Channel Support and Indicators

On the daily XRPUSD chart, the token remains within a descending channel established in August 2025. Indicators suggest short-term oversold conditions:

  • Daily RSI recently touched the lowest level since 2024, historically preceding minor rebounds.

  • MACD histogram (daily) has flattened, hinting at potential momentum shifts if buying pressure increases near $1.80.


Technical Landscape: Channel Support and Indicators

XRP is testing the lower boundary of a descending channel, with a potential reversal or breakout signaling a bullish move toward $4. Source: MMBTtrader on TradingView

Immediate resistance lies between $2.06 and $2.15, with a stronger barrier at $2.20–$2.30. A decisive breakout above this zone could enable a medium-term rally toward $4, according to technical strategist ChartProX, who specializes in altcoin momentum analysis.

Institutional Dynamics: Whale Behavior and ETF Exposure

ETF-driven inflows are complemented by in-kind creations for certain XRP products, which make net exposure less transparent. Analysts estimate ~$44M of long exposure on Canary Capital’s first day of trading.

Institutional Dynamics: Whale Behavior and ETF Exposure

XRP was trading at around 2.06, up 7.17% in the last 24 hours at press time. Source: XRP price via Brave New Coin

Large holders continue to influence price dynamics. On-chain dashboards (CoinMetrics, Santiment) indicate that the top 100 XRP wallets control above ~68% of the circulating supply—a factor that can accelerate price swings but also heighten volatility.

Disclaimer: Wallet holdings and exchange flows fluctuate frequently; numbers are approximations.

Outlook by Time Horizon

Short-Term (Days–Weeks):

  • Traders note potential rejections at $2.00 psychological resistance and short-term bearish setups from $1.90 to $1.62 (per XRP Technical Alerts, a crypto trading group).

  • Daily indicators suggest a possible rebound if support at $1.80 holds.

Medium-Term (Weeks–Months):

  • Institutional ETF adoption and legal clarity may gradually underpin price stability and moderate growth.

  • Resistance around $2.20–$2.30 remains a key test zone.

Long-Term (Months–Years):

  • RippleNet adoption across Asia and Africa, combined with compatibility with ISO 20022, could increase XRP’s utility in cross-border settlements.

  • Even partial penetration (~5%) of the $685B global remittance market could influence valuation and liquidity over time, per payments research firm FinFlow Analytics.

Source link

23 11, 2025

Dogecoin Price Prediction: DOGE Price Chart Flashes TD9 Signal as Bulls Eye a Potential Trend Reversal

By |2025-11-23T22:59:07+02:00November 23, 2025|Crypto News, News|0 Comments

Early readings from widely used market tools—combined with Dogecoin’s multi-month correction—have prompted analysts to re-examine current conditions with a more measured lens. While broader crypto sentiment remains cautious, the appearance of a TD Sequential “9” signal on DOGE’s 3-day chart has refocused attention on whether oversold conditions may be stabilizing. This analysis relies on publicly available price data, standard technical frameworks, and historical performance patterns to help readers assess the developing setup without implying certainty or predictive guarantees.

TD Sequential Flashes a New Buy Signal

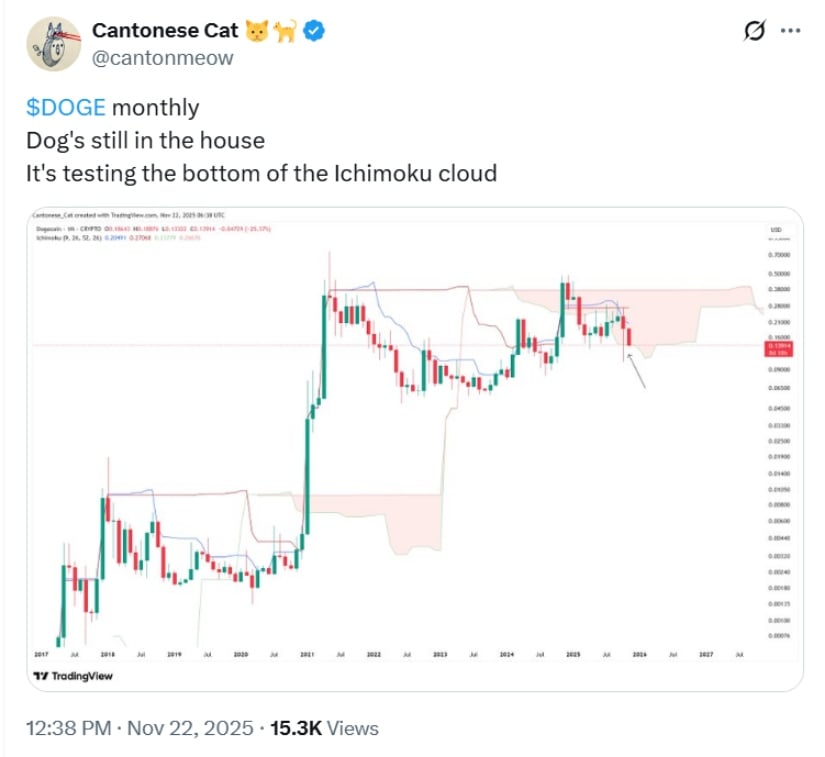
According to traders familiar with the TD Sequential system—a tool designed by technical analyst Tom DeMark to identify trend exhaustion—a “9” signal on DOGE’s 3-day chart often marks areas where a prevailing trend may be losing strength. On Dogecoin’s latest chart, this pattern appeared after an extended decline from the August high near $0.34 to low levels around $0.115, based on price data from major market aggregators such as CoinMarketCap and TradingView.

The TD Sequential has issued a fresh buy signal for Dogecoin, following a previous instance that preceded a 101.5% rebound. Source: @ali_charts via X

A similar TD9 signal occurred in September 2025, which was followed by a short-term recovery of roughly 101% toward $0.149. While useful for spotting areas of potential reversal, traders acknowledge that the TD Sequential system can produce false signals when market momentum is broadly negative. As one technical analyst noted in a public market forum, the indicator “is valuable for context but should not be used in isolation, especially during strong macro downtrends.”

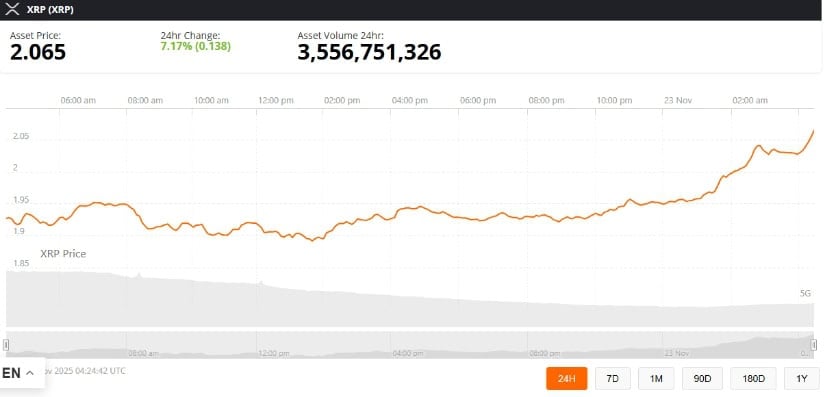
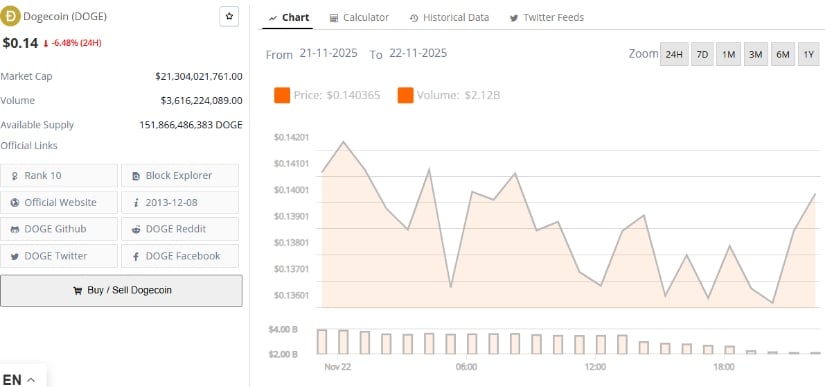
With the Dogecoin price today fluctuating between $0.138 and $0.14, chart watchers are monitoring whether this latest reading will act as a stopping point for the current correction or simply highlight temporary exhaustion.

Market Conditions Show Bearish Pressure but Rising Oversold Signals

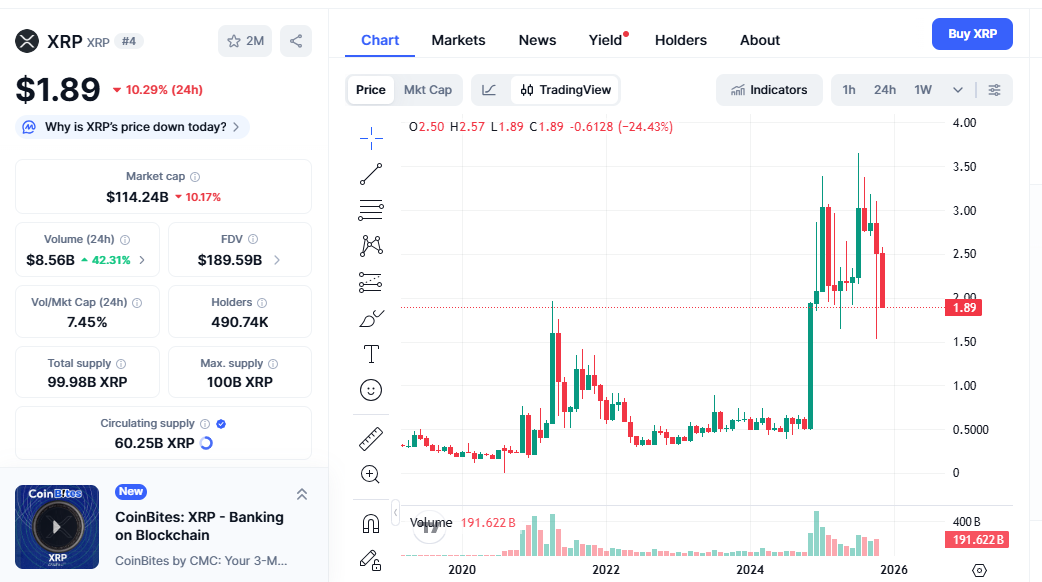
Despite the appearance of the TD9 pattern, Dogecoin continues to operate under a bearish market structure. As of November 23, 2025, DOGE trades around $0.14, according to CoinMarketCap—slightly higher on the day yet still more than 27% lower over the past month. This aligns with a broader pullback across cryptocurrencies, driven by cooling market sentiment and reduced speculative appetite.

Dogecoin Price Prediction: DOGE Price Chart Flashes TD9 Signal as Bulls Eye a Potential Trend Reversal

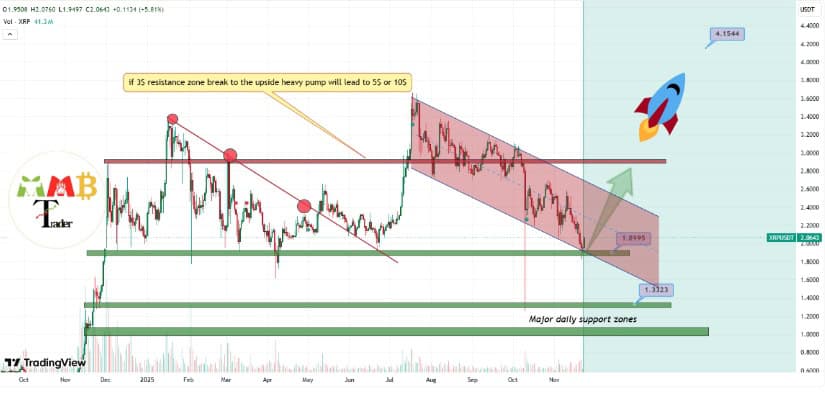
The market’s 70% decline signals a confirmed bear cycle, where any potential rebound should be seen as a corrective move unless key resistance levels are reclaimed with strong, sustained momentum. Source: MMBTtrader on TradingView

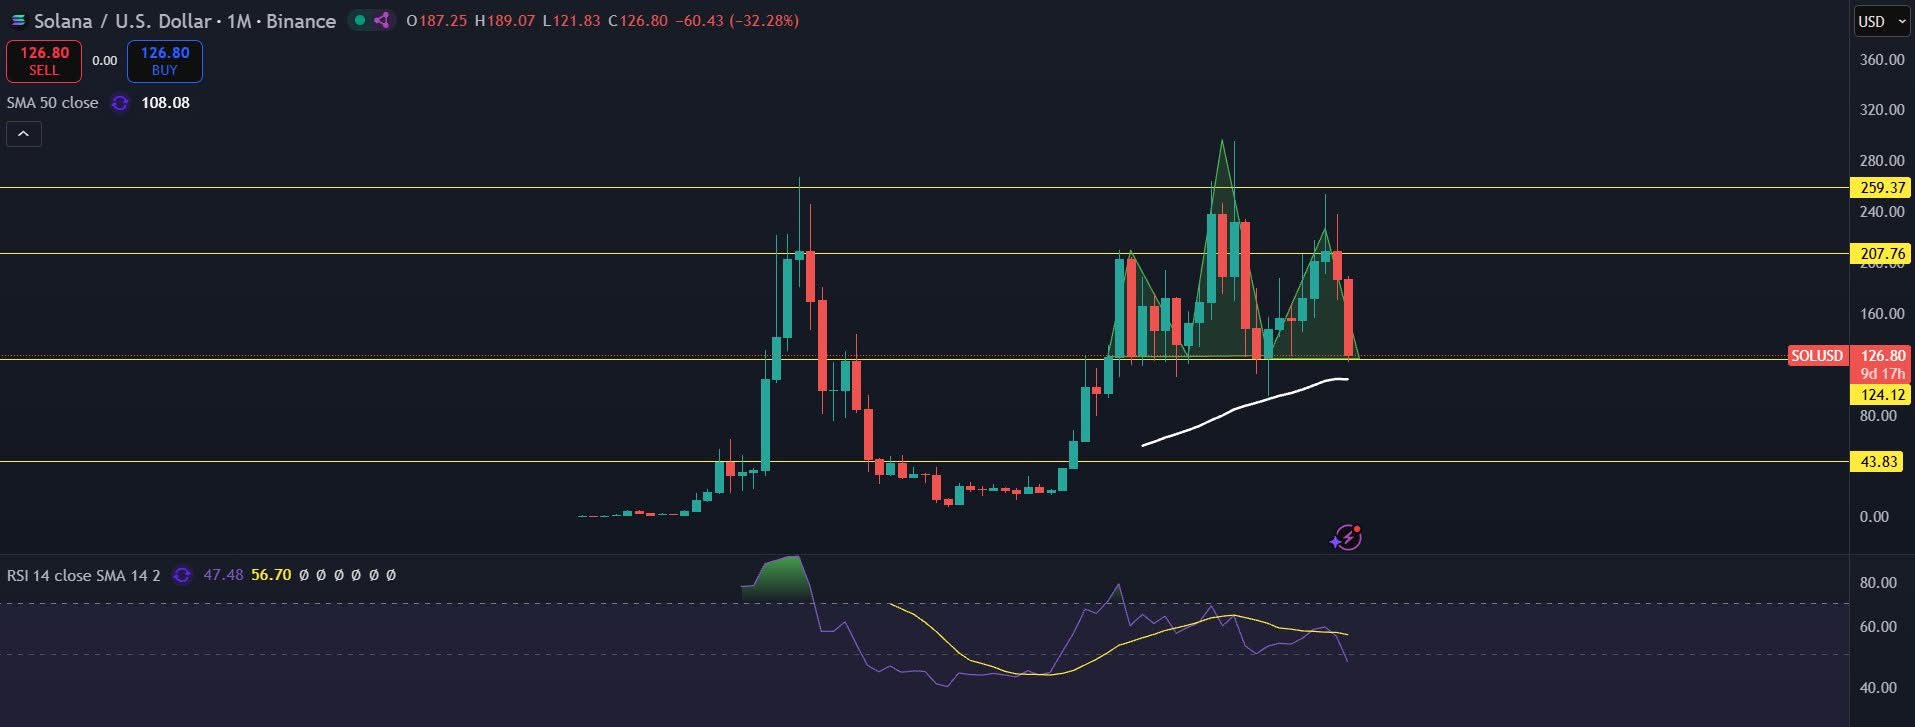
Technical indicators such as the Relative Strength Index (RSI), drawn from TradingView’s standard metrics, are currently reading between 32 and 37 on higher timeframes. These levels suggest oversold conditions but do not guarantee immediate reversal. Data from LunarCrush and similar analytics platforms also show an uptick in social volume, a factor that has historically influenced short-term volatility in highly sentiment-driven assets like Dogecoin.

Market researchers emphasize that any movement toward the $0.18 resistance zone should initially be viewed within the context of a corrective bounce unless DOGE begins reclaiming major levels with meaningful volume and sustained follow-through.

Weekly Structure Points to Long-Term Consolidation

A widely circulated weekly Dogecoin chart indicates that DOGE is nearing the lower boundary of a long-standing consolidation band. Weekly RSI values around 37.66 suggest Dogecoin is approaching levels where previous accumulation phases have occurred. Similar structural patterns appeared in 2021 before significant rallies; however, those past moves were amplified by exceptional social enthusiasm and unusually strong market liquidity—conditions not currently present.

Weekly Structure Points to Long-Term Consolidation

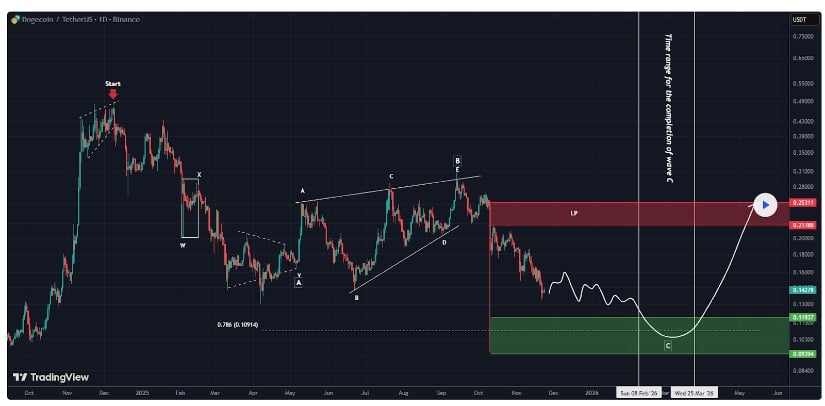
Dogecoin appears to be progressing through a confirmed ABC corrective pattern, with wave C still developing and an upside retracement expected once it completes within the projected timeframe. Source: behdark on TradingView

Independent market commentators note that while the chart setup resembles historical basing patterns, participation levels remain relatively low and the broader macro backdrop remains neutral. As one analyst summarized, the structure “may reflect early accumulation, but without robust participation, timing remains unclear.”

This mixed environment highlights both the potential and the limitations of current Dogecoin predictions, reminding readers that technical setups can evolve slowly during broader risk-off phases.

Dogecoin’s Market Overview and Key Technical Levels

Dogecoin remains one of the top cryptocurrencies by market capitalization, valued near $22 billion with more than 151 billion coins in circulation, according to CoinMarketCap’s latest figures. While the asset trades far below its May 2021 all-time high of $0.74, it continues to maintain strong community visibility and recurring market interest.

Current metrics show:

  • Dogecoin Price Today: ~$0.14

  • 24-Hour Change: +4.28%

  • Market Rank: #9

  • Sentiment Index: “Extreme Fear” (11) based on Alternative.me’s Fear & Greed Index

  • Key Resistance Zones: $0.1495 and $0.1586

  • Key Support Levels: $0.138 and $0.135

Price action currently sits below the 50-day and 200-day simple moving averages, reinforcing the prevailing downward trend and signaling caution for short-term traders monitoring the Dogecoin price.

Wave Structure Suggests Ongoing Correction Before Reversal Attempts

Wave-based analysts who study market cycle structures—often using Elliott Wave principles—observe that Dogecoin remains within a broader corrective sequence. Based on these interpretations, an ABC corrective pattern appears to be unfolding, with wave C still progressing. The projected completion zone is marked between two timing intervals identified on the chart.

Wave Structure Suggests Ongoing Correction Before Reversal Attempts

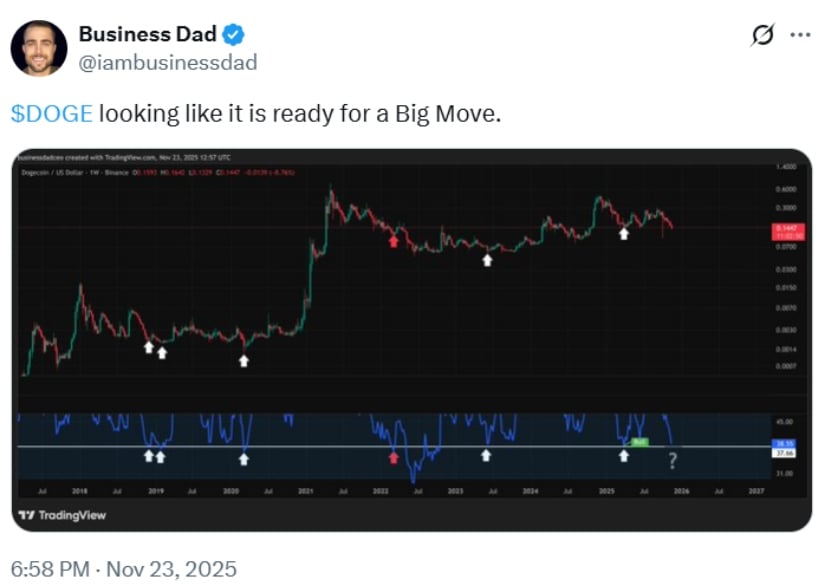
Dogecoin appears poised for a significant move as tightening technical structure and accumulating support hint at a potential breakout. Source: @iambusinessdad via X

Once wave C concludes, some technicians anticipate that retracement movements may form, though these would be considered corrective unless confirmed by stronger structural changes. Analysts caution that the accuracy of wave interpretations can vary significantly and depend heavily on assumptions about trend length, volume, and market psychology.

Moreover, DOGE’s 70%+ decline from its highs aligns with conventional definitions of a bear-market cycle—further reinforcing the need for risk-aware interpretation of any temporary recoveries.

Broader Factors Influencing Dogecoin’s Price Outlook

Dogecoin’s performance continues to be shaped by several external and structural variables:

1. Social & Media Momentum

Data from platforms such as LunarCrush show that mentions, trending hashtags, and influencer posts can significantly impact short-term Dogecoin movements. High-profile figures—most notably Elon Musk—have historically triggered notable price reactions, though these effects tend to be short-lived and unpredictable.

2. Unlimited Supply Dynamics

Unlike Bitcoin, Dogecoin has no maximum supply cap. Around 5 billion new DOGE are minted each year, which can influence long-term valuation models and is often referenced in discussions around dogecoin price forecast outlooks.
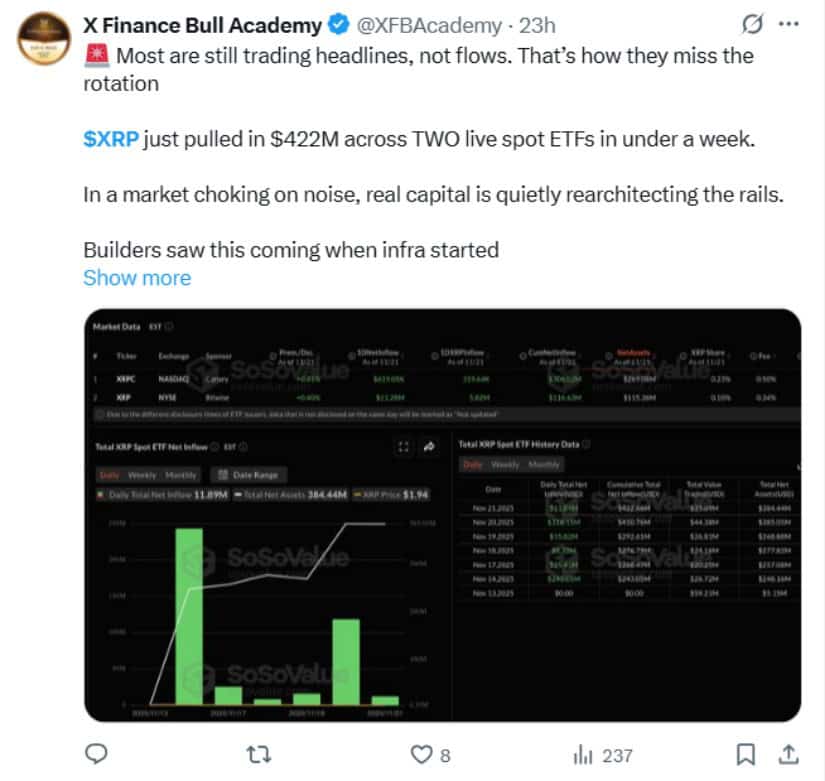
3. ETF Speculation

Conversation regarding a possible Dogecoin-based ETF has circulated in community forums and social media threads. At this stage, no official filings or regulatory signals confirm such a development. Analysts stress that ETF rumors should be treated cautiously unless supported by verifiable announcements.

4. Real-World Utility

Dogecoin maintains cultural significance and sees occasional use for tipping and merchandise payments, but its utility remains limited compared to more infrastructure-focused cryptocurrencies. This is an ongoing consideration for those evaluating whether Dogecoin is worth it as a multi-year asset.

Dogecoin Price Prediction: Outlook Remains Mixed

Short-term models, based on current trends and support/resistance analysis, suggest that Dogecoin may continue to consolidate. Some chart-based forecasts point toward possible retests of the $0.133 area if selling pressure persists. Conversely, a sustained improvement in sentiment, combined with confirmation of the TD9 signal, could support attempts toward the $0.18 range.

Dogecoin Price Prediction: Outlook Remains Mixed

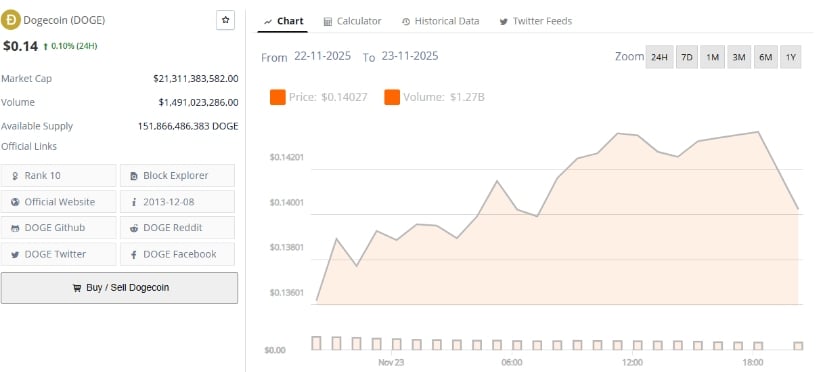
Dogecoin was trading at around $0.14, up 0.10% in the last 24 hours. Source: Brave New Coin

Long-term projections—including Dogecoin price prediction 2025—vary widely due to shifting macro conditions, supply dynamics, and sentiment cycles. For common questions such as “will Dogecoin reach $1?” market researchers emphasize that such scenarios depend heavily on broader crypto-market phases and the return of high engagement, both of which are currently subdued.

Final Thoughts

Dogecoin’s latest TD9 reading adds an important technical note to the current market backdrop, but it does not, on its own, confirm a trend reversal. The asset remains in a broader corrective pattern, with oversold conditions and long-term consolidation structures forming but not yet signaling a clear shift. Across the market, traders and analysts continue to track chart developments, on-chain data, and sentiment measures for early signs of stability.

Source link

23 11, 2025

XRP Forecast After Coinbase Launches ETH Loans

By |2025-11-23T18:57:03+02:00November 23, 2025|Crypto News, News|0 Comments

On November 20th, Coinbase launched Ether-backed loans for US users, letting customers borrow up to $1 million in USDC against their ETH without selling. Built on Base and powered by Morpho, this product signals something bigger: DeFi infrastructure is going mainstream fast.

Markets moved quickly and everyone started hunting for the best altcoins to scoop up. XRP price prediction searches picked up again as payment tokens usually benefit when the market cools down.

But the real hype right now is DeepSnitch AI. It is blowing up because it mixes real AI utility with meme energy, so traders feel like they’re getting in early on something fun and actually useful to provide .

Coinbase ETH loans go live: What this means for crypto lending

Coinbase just opened the floodgates for institutional-grade DeFi. The new product lets users across most US states (except New York) borrow USDC stablecoins against their Ethereum holdings without triggering taxable events from selling.

When major exchanges start integrating DeFi protocols like Morpho directly into their platforms, it validates the entire space. Coinbase’s onchain lending already processed over $1.25 billion in loan originations with roughly $810 million still outstanding.

This infrastructure expansion benefits payment-focused networks like XRP. When traditional finance sees crypto lending, staking, and payment rails all functioning smoothly, they start allocating beyond Bitcoin. They start exploring networks built specifically for cross-border settlements and institutional liquidity. That’s XRP’s wheelhouse.

DeepSnitch AI: Intelligence infrastructure for trader edge

All this fresh momentum from Coinbase, institutional lending and clearer regulations points to one thing. The next cycle is going to reward projects that provide real intelligence, not just hype. When exchanges start running onchain lending at scale, every move becomes data. Every loan, every liquidation, every collateral shift creates signals that smart traders can use long before the crowd notices.


This is where DeepSnitch AI fits right into the narrative. While Coinbase is unlocking institutional DeFi infrastructure, DeepSnitch is building the intelligence layer that helps everyday traders keep up. The platform runs five AI agents that monitor everything from whale rotations to fresh contract deployments. Instead of chasing pumps after they show up on Twitter, traders get alerts the moment the chain starts moving.

Two agents are already live and the rest roll out as development milestones hit. The project has passed security audits through Coinsult and SolidProof, something most presales never bother with. It started at $0.0151 and now sits around $0.02429 with more than $564,000 raised, giving early buyers over 60% gains before the token even lists.

In a market where institutions are getting better tools every week, DeepSnitch gives retail the chance to level the playing field.

XRP Forecast After Coinbase Launches ETH Loans


XRP price prediction for 2026

XRP trades around $1.89 as of November 21st after the Bitwise XRP ETF debuted on the NYSE.

The XRP price prediction for 2026 actually looks solid when you notice what’s happening. The Canary Capital XRP ETF launched November 13th and pulled $58.5 million first-day turnover with roughly $128 million volume over four trading days. That’s serious institutional interest.

If XRP reclaims and holds above $2.50, the XRP price prediction models suggest momentum shifts bullish toward $2.90-$3.05.

November historically has been XRP’s strongest month, averaging +88% gains. While that exact performance seems unlikely given current holder selling pressure, the setup isn’t terrible.

For a realistic XRP price prediction for 2026, consider the catalysts. Multiple spot XRP ETFs are now approved or pending. Regulatory clarity finally exists after years of SEC battles. RippleNet continues expanding payment partnerships. The Trump administration actively supports crypto infrastructure.

If Bitcoin enters a sustained bull phase and institutional capital flows into payment infrastructure plays, XRP price prediction models suggest 3x to 5x gains from current levels is achievable.

Aster coin update: Can Aster maintain its DeFi momentum?

Every DeFi trader wants to know: can Aster coin sustain its recent rally and deliver transformational returns?

Aster currently trades around $1.17 as of November 21st. The DeFi perpetuals token surged 26% recently after CZ (Changpeng Zhao) purchased 2 million tokens, sparking speculative demand.

With roughly 2.4 billion tokens circulating, Aster holds a $2.7 billion market cap. Analysts like MoEthWhale project Aster could hit a $10 billion market cap, which would put the price around $5.

Conclusion

Crypto markets are responding positively as Coinbase’s ETH-backed loans validate DeFi infrastructure and traditional finance integration accelerates. The XRP price prediction for 2026 suggests strong gains are achievable if institutional adoption continues, though the path depends on ETF flows and payment network expansion.

What’s clear is that this cycle rewards utility and infrastructure. DeepSnitch AI represents exactly this shift, combining AI capabilities with practical trading solutions.

The platform’s AI agents tackle information asymmetry head-on. With the presale accessible at $0.02429, early participants already holding 60%+ gains, and 100x potential realistic after exchange listings, the setup deserves attention.

Join the DeepSnitch AI presale and follow updates on X and Telegram.

Frequently asked questions

What is the realistic XRP price prediction for 2026?

Most realistic XRP price prediction models place XRP between $6.00 and $10.00 depending on institutional adoption. These estimates factor in ETF flows, payment network expansion, and cross-border settlement adoption rates.

Can XRP reach $50 or deliver returns?

Reaching $50 would require a market cap around $3 trillion, which seems unlikely in the near term. From current levels around $2, a gain faces mathematical constraints unless global payment adoption accelerates dramatically beyond current projections.

How does XRP institutional adoption impact its value?

XRP institutional adoption usually boosts confidence because banks and payment providers bring real volume. More usage means more demand for liquidity, which can support higher prices over time.

Source link

23 11, 2025

What Is the Next Target?

By |2025-11-23T16:55:52+02:00November 23, 2025|Crypto News, News|0 Comments

Bitcoin and virtually all cryptocurrencies have been experiencing consecutive days of price correction and decline. This is also reflected in the Solana monthly chart, which showed a “head and shoulders” structure, leading the Solana price prediction to indicate a return to Fibonacci levels at $207 or a drop below $100.

While the entire market falls, the presale sector is doing well, with DeepSnitch AI leading as the most promising one at the moment. Because it’s a project that mixes crypto with artificial intelligence, investors are investing heavily. The token price has already risen 60%, and the presale has already raised over $560,000, with investors talking about potential.

Solana ETF altseason? SOL ETFs only register inflows

It’s not just the crypto market that’s experiencing red days. The ETF market has also been showing declines, with BTC and ETH ETFs registering strong outflows. But amidst this chaos, SOL ETF seems to shine as one of the only cryptos bucking the trend.

Since its launch, SOL ETF has not yet registered a single day with outflows exceeding inflows, remaining positive with $500 million accumulated. This is interesting because even with the token’s price falling over 30% in November, institutional investors continue to buy Solana ETFs.

Some are calling this a “small SOL ETF altseason,” showing that investors see the strength of Solana’s fundamentals. This makes SOL forecast bullish in the long term, and even though Solana price prediction is uncertain at the moment, with the institutional market buying strongly, it signals a higher probability of further increases.

DeepSnitch AI: The most promising presale with 100x potential

DeepSnitch AI has just launched its network, and users have already been able to test and see that the product is real. The project has also been audited, validating that it is safe for investment. All of this has led investors to invest heavily because they already see the long-term potential.


Offering a complete platform, it will bring five AI agents that will monitor several on-chain activities to help traders make better investment decisions and protect their portfolio. The agents will track whale moves, insider transactions, new token launches, trending coins, rug pull alerts, and more. All of this will be processed and sent directly to users in real time.

With the artificial intelligence sector expected to grow by 2030, DeepSnitch AI has the product and technology to grow alongside it. And because it’s still a presale, from that perspective, it offers investors much more upside today.

Currently, you can invest in the presale paying just $0.02429, a cheap entry price considering its long-term potential. If the AI ​​sector grows 25x, investors estimate that DSNT could grow at least 100x, making this presale the best crypto to buy now.


Solana price prediction: $207 or below $100?

The Solana monthly chart presents a complicated pattern. The SOL price fell 30% in November and about 55% since its all-time high, and at this moment it has just formed a bearish Head and Shoulders pattern. After breaking the support at $165 and having a rejected pullback, the price fell to $125 on November 21st.

This Head and Shoulders pattern is usually followed by further declines, and this would lead Solana price prediction point to targets below $100 in 2026. For the momentum to return to bullish, the SOL price would need to recover $165 and close the monthly chart above that to form new support.

Institutional investors continue to buy, Solana ETFs are trending, and the fundamentals are still there. With this view, traders believe that the Solana price prediction 2026 is to recover and rise, with traders targeting the next target at $207.

ETH price prediction: BlackRock to launch new Ethereum ETF with staking

It seems that 2026 could be a year where investors will prefer investment options with staking and passive rewards. This new movement comes after the US created regulatory flexibility for the crypto sector. With this perspective, BlackRock is already positioning itself by launching a new Ethereum ETF that will offer staking to clients.

The strategy is to offer a kind of “institutional staking” without investors needing to operate ETH validators to access network rewards. With VanEck, Grayscale, and now BlackRock, the trend is clear, and the next institutional cycle of Ethereum should be guided by regulated yield products.

Meanwhile, the price of ETH has already fallen 28% in November, but the institutional market is preparing the fundamentals that should guide the next upward leg towards $3,000 and beyond.

Conclusion

Solana price prediction does not look good, with the monthly chart showing signs of bearish times. So, until it recovers lost ground and $165 turns into support, investing in SOL could be risky.

Presales are doing well in a market where almost everything is falling, with DeepSnitch AI leading as the most promising. Being a project that mixes crypto with AI, this enhances its upside potential, positioning it as a potential next crypto to 100x.

Visit the official website for more information, and join X and Telegram for community updates.

FAQs

What is the current Solana price prediction for 2026?

Analysts point to two key scenarios: a bullish target at $207 based on Fibonacci levels or a drop below $100 due to the recent head-and-shoulders pattern. Recovery above $165 is needed to confirm a bullish reversal.

Why is DeepSnitch AI considered one of the most promising presales right now?

DeepSnitch AI has launched its network, which is fully audited, and offers five AI agents that track on-chain data in real time. With the AI sector expected to grow 25x, investors see strong 100x upside potential.

Why are institutional investors still buying SOL despite recent price drops?

Solana ETFs continue to show positive inflows, signaling strong institutional confidence. Even with short-term volatility, long-term fundamentals keep interest high.

Source link

23 11, 2025

Hoskinson Says ‘Attack Failed’ As ADA Breaks Key Support Zone

By |2025-11-23T14:54:03+02:00November 23, 2025|Crypto News, News|0 Comments

  • Cardano trades near $0.398 after losing the multi-month $0.52 support zone that anchored the structure.
  • Spot outflows continue, with $2.5M leaving exchanges as sellers dominate while ADA tests its long-term trendline.
  • Hoskinson says the “attack failed” after network turbulence, but the chart shows momentum still favoring a deeper downside toward $0.38–$0.32.

Cardano price today trades near $0.398 after breaking below a multi-month support zone. The drop pushes ADA into a critical test along the ascending long-term trendline as sellers continue to pressure the market following a spike in negative spot flows and broader risk weakness.

Buyers Lose Key Weekly Support

On the weekly chart, ADA has decisively lost the horizontal support near $0.52, a level that acted as a floor multiple times during the past year. The current candle has expanded through that rang…

Read The Full Article Cardano Price Prediction: Hoskinson Says ‘Attack Failed’ As ADA Breaks Key Support Zone On Coin Edition.

Source link

23 11, 2025

XRP Price Prediction: $2.04 Rebound Sparks a $2.97 Breakout Scenario

By |2025-11-23T12:53:27+02:00November 23, 2025|Crypto News, News|0 Comments

XRP price prediction turns bullish as XRP reclaims $2.04 and buyers defend $1.81 support, raising the odds of a breakout toward $2.50.


Register now to be able to add articles to your reading list.

” aria-hidden=”true”>

Quick overview

  • XRP is stabilizing after a decline, currently trading at $2.04, up 5.18% in the last 24 hours.
  • The asset’s market cap is $123.1 billion, maintaining its position as the #4 cryptocurrency.
  • Technical indicators show bullish signs, including a bullish engulfing pattern and a rising RSI from oversold levels.
  • Traders should watch for a confirmed close above $2.06 to potentially target $2.30 and $2.50.

XRP is stabilizing after a sharp multi-week decline pushed the token into the $1.81–$1.90 support band, an area that has repeatedly triggered rebounds since early autumn. At $2.04 today, XRP is up 5.18% over the past 24 hours, supported by stronger buying interest and growing signs that sellers may be losing momentum.

The asset’s market cap now stands at $123.1 billion, keeping it firmly ranked #4 in the crypto market.

The latest 4-hour candle structure shows XRP breaking back above $2.00 with conviction. This recovery followed a deep rejection wick near the recent low — a classic signal that bears are exhausting and liquidity is shifting toward buyers.

Trendlines, Momentum, and Early Reversal Clues

XRP’s broader structure is still defined by a descending triangle, with each rally capped by a persistent downward trendline stretching back to September. Yet the tone is changing. The RSI has bounced sharply from oversold territory and is now forming the early stages of a bullish divergence, a pattern that often precedes meaningful trend reversals.


XRP/USD

Candlestick behavior supports this shift. A bullish engulfing pattern formed at the base, coming after several long-wick candles that showed absorption of sell pressure.

XRP has also reclaimed the 20-EMA on the 4-hour chart for the first time in nearly two weeks. The next major technical barrier is the 200-EMA near $2.30, which aligns with the descending trendline.

Key short-term observations include:

• Bullish engulfing confirmation near support
• RSI turning higher from oversold levels
• Price reclaiming the 20-EMA for the first time in weeks

If buyers can hold XRP/USD above $2.06, the recovery could extend toward $2.30 and later $2.50. A daily close above the descending trendline would mark the first genuine shift in structure and open the door to a broader breakout toward $2.70–$2.97.

XRP Price Prediction: .04 Rebound Sparks a .97 Breakout Scenario
XRP/USD Price Chart

A simple trade framework for newer traders is to wait for a confirmed close above $2.06, with a stop below $1.90. If momentum continues to build, XRP may revisit the $2.50 and $2.97 zones — levels that acted as major pivot points earlier in the cycle.

Despite recent volatility, the price action now reflects early signs of stabilization. If liquidity rotates back into altcoins, XRP could be among the first to regain upside traction.

Maham Arslan

Crypto News Writer | Blockchain & Web3 Reporter

Maham is a crypto news writer and market analyst specializing in breaking down the latest developments across blockchain, digital assets, and decentralized finance (DeFi). With hands-on experience covering high-impact stories—from regulatory shifts and token launches to macro-driven price movements—she delivers timely, accurate, and SEO-optimized content for fast-growing crypto media platforms.

Her expertise lies in producing daily news reports, price predictions, technical summaries, and coverage of market-moving events. Maham tracks real-time updates across global newswires, X (Twitter), and on-chain data to provide actionable insights tailored for retail traders, crypto enthusiasts, and institutional readers.

With a strong grasp of crypto fundamentals and Web3 trends, she delivers content that’s informed, accessible, and always on time.

Related Articles


Source link

23 11, 2025

Dogecoin (DOGE) Price Prediction: Consolidation Below $0.15 Highlights Key Support, Bulls Eye $0.18 Breakout

By |2025-11-23T10:52:09+02:00November 23, 2025|Crypto News, News|0 Comments

Dogecoin (DOGE) is navigating a critical consolidation phase as prices remain below $0.15, testing long-term support levels while investors assess whether a rebound toward $0.18 is feasible amid ongoing market volatility.

This analysis combines technical indicators, historical price structures, and expert commentary to provide a measured perspective on DOGE’s near- and medium-term outlook.

DOGE Trades Below Immediate Support

After falling beneath the $0.14–$0.15 range, Dogecoin has been trading near $0.138, representing a roughly 3% daily decline. According to CoinMarketCap data, DOGE’s 24-hour trading volume stands at $6.17 billion, with a market capitalization of $20.78 billion and dominance of 0.72%. The recent decline reflects broader cryptocurrency market pressures, including high-volume selling across major assets. Volume currently remains slightly below its 30-day average, suggesting moderation in trading activity compared with prior weeks.

A sustained drop below $0.14 could trigger a cascading decline for Dogecoin (DOGE), opening the door toward the $0.07 level. Source: Ali Martinez via X

Ali (@ali_charts), a technical analyst specializing in cryptocurrency pattern analysis, noted that “a sustained weekly close below $0.14 could open the path toward the $0.07 macro support.” Analysts highlight that this downside projection assumes continued selling pressure and a failure to hold higher lows on the weekly chart, while oversold RSI levels below 30 could provide conditions for a potential rebound if the $0.07 support holds.

Long-Term Symmetrical Triangle Indicates Consolidation

On the weekly chart, DOGEUSDT has formed a long-term symmetrical triangle since 2021, defined by declining swing highs and progressively higher lows. Observations include:

  • Price is retesting the triangle’s rising support line, measured from 2021 swing lows.

  • Trading volume has gradually contracted over recent months, consistent with consolidation phases.

  • The structure has maintained higher lows, suggesting ongoing accumulation rather than immediate breakdown.

Dogecoin (DOGE) Price Prediction: Consolidation Below alt=

DOGE/USDT is trading within a long-term triangle, testing rising support, with a breakout or downside retest possible. Source: sika0409 on TradingView

Market participants note that if DOGE breaks out above the triangle apex with confirming volume, a sharp upward move could follow. Conversely, failure to hold the lower support line could validate a decline toward macro support near $0.07.

Short-Term Trading Range

On daily charts, Dogecoin is currently oscillating between $0.1300 and $0.1350, forming a potential accumulation base.

Technical patterns suggest a bearish accumulation scenario in the near term, while resistance levels around $0.1500–$0.1550 remain key for any upside momentum. In the worst-case scenario, DOGE could retest the $0.0900–$0.0950 range on a monthly scale, though a break above $0.1800 would indicate a recovery trend is forming.

Monthly Chart Indicators and Support Zones

Cantonese Cat (@cantonmeow), known for providing long-term trend analysis using Ichimoku and Fibonacci models, notes that on the monthly Ichimoku model, DOGE is approaching the lower boundary near $0.04—a level historically aligned with multi-year dynamic support.

Monthly Chart Indicators and Support Zones

On the monthly chart, DOGE is currently testing the lower edge of the Ichimoku cloud—a key zone for long‑term support and momentum confirmation. Source: Cantonese Cat via X

Analysts also highlight the 0.5 logarithmic Fibonacci retracement and 200-week simple moving averages (SMAs) as additional long-term supports that could underpin rebounds toward $0.133 if broader market conditions improve. Cantonese Cat added a characteristically light remark—“Dog’s still in the house”—while emphasizing that DOGE remains within long-term structural support.

Key Levels and Risk Context

Analysts suggest the next potential resistance for DOGE could appear around $0.2000, provided critical support above $0.1500 holds.

On the downside, a sustained weekly close below $0.14 could open the path toward $0.07, contingent on volume expansion and confirmation below multi-year trendlines. Investors are advised to monitor consolidation patterns, trading volumes, and broader macro conditions, as these factors heavily influence the likelihood of both bullish and bearish outcomes.

Final Thoughts

Dogecoin remains in a cautious consolidation phase, with technical and historical support zones defining key thresholds.

Final Thoughts

Dogecoin was trading at around 0.14, down 6.48% in the last 24 hours at press time. Source: Brave New Coin

While upside targets of $0.18–$0.20 are possible, they remain dependent on a confirmed breakout and market momentum. Conversely, failure to hold support could lead to testing lower macro levels. Traders and long-term investors should consider both scenarios while accounting for volume, volatility, and historical pattern behavior.

Source link

23 11, 2025

XRPUSD News Today, Nov 23: Predicting XRP’s Future Value with Bold Pro

By |2025-11-23T08:51:18+02:00November 23, 2025|Crypto News, News|0 Comments

Acquiring insight into the future value of XRPUSD is crucial for investors navigating the unpredictable waters of cryptocurrency. Recent forecasts for XRP hover between conservative predictions of £16 by 2030 to exceedingly daring estimates of £800, rising to heights of nearly £3,850. Intense interest stems from expected institutional adoption and Ripple’s ongoing legal dramas. Currently priced at £1.58, XRPUSD is facing a daily dip of 2.3%. As we explore XRP’s potential, we’ll unpack key market indicators and expert opinions.

XRP Price Prediction: A Range of Possibilities

When discussing XRP price prediction, analysts provide a wide scope of possibilities. Conservative estimates suggest XRP could reach £16 by 2030, a figure driven largely by Ripple’s firm position in cross-border payment solutions. More optimistic forecasts see the cryptocurrency reaching between £800 and nearly £3,850. Such bullish predictions are fueled by a potential increase in institutional adoption and expected regulatory clarity.

Ripple’s ongoing legal battle against the U.S. Securities and Exchange Commission (SEC) is a significant factor. A favorable outcome could unlock new growth pathways for XRP. Regardless of the eventual legal ruling, Ripple continues to secure partnerships that strengthen its ecosystem, further boosting long-term investor confidence.

Technical Analysis: Evaluating XRPUSD

A closer look at XRPUSD’s technical indicators reveals a challenging environment. The Relative Strength Index (RSI) stands at 33.77, suggesting oversold conditions. However, an ADX of 36.77 indicates a strong trend presence, despite negative momentum seen through a MACD of -0.14.

Bollinger Bands show price volatility, with the current rate near its lower band. The Awesome Oscillator reflects a bearish short-term outlook. Nevertheless, a growing market interest, marked by an MFI of 22.62, hints at potential shifts. Investors should consider these aspects carefully when evaluating their positions.

Institutional adoption plays a crucial role in XRP’s trajectory. Ripple’s strategic alliances with financial institutions continue to bring credibility and new operational use cases to XRP.

The resolution of Ripple’s legal challenges could be pivotal. If Ripple successfully defends against SEC charges, it may bolster XRP, potentially leading to significant price appreciation. Whether these positive developments will materialize remains speculative, but their impact on XRP’s value is undeniable. This anticipation keeps investor interest intact, aligning with the evident growth in XRPUSD’s long-term potential.

Here’s a closer look at potential future scenarios for XRP in 2030.

Final Thoughts

The future of XRPUSD involves a complex interplay of legal, industry, and market forces. Predicted values ranging from £16 to over £3,850 demonstrate the wide spectrum of possibilities. Institutional uptake and the pending legal resolution are two critical facets that could drive substantial changes in XRP’s value.

For investors, it’s vital to monitor these developments attentively. Each passing event shapes the market’s predictions and the cryptocurrency landscape as a whole. As always, conducting detailed analysis and staying informed will be key to navigating these waters effectively.

Meyka, an AI-driven platform, offers real-time financial insights and predictive analytics to assist investors in making informed decisions amidst such volatility.

FAQs

What is the current XRP price?

As of now, XRPUSD trades at £1.58. It experienced a daily decline of 2.3% but remains up 295% year-over-year, reflecting significant volatility and growth potential.

How do legal developments impact XRP’s value?

Ripple’s legal battles with the SEC significantly influence XRP’s price. A positive ruling could unlock new growth opportunities, while a negative outcome might hinder its market expansion.

What are XRP’s long-term price predictions?

Long-term predictions for XRP vary widely, from £16 to upwards of £3,850 by 2030. These estimates account for potential institutional adoption and legal outcomes affecting its usage and demand.

Disclaimer:

The content shared by Meyka AI PTY LTD is solely for research and informational purposes. 
Meyka is not a financial advisory service, and the information provided should not be considered investment or trading advice.

Source link

Go to Top