The main tag of Forex News Today Articles.
You can use the search box below to find what you need.
[wd_asp id=1]

24 03, 2026

Advances to 158.75 amid bullish technical setup

By |2026-03-24T07:12:03+02:00March 24, 2026|Forex News, News|0 Comments

The USD/JPY pair attracts some dip-buyers following the previous day’s pullback of around 165 pips from the vicinity of its highest level since July 2024, and climbs to the 158.75-158.80 region during the Asian session on Tuesday.

The Japanese Yen (JPY) weakens in reaction to soft inflation figures, which showed that the National Consumer Price Index (CPI) fell below the Bank of Japan’s (BoJ) 2% target and to its lowest level since March 2022. The data further dampens hopes for an immediate interest rate hike by the central bank amid concerns that the war-driven surge in energy prices could weaken Japan’s economic growth.

Meanwhile, geopolitical uncertainties stemming from conflicts in the Middle East continue to fuel inflation fears, curbing bets for further interest rate cuts by the US Federal Reserve (Fed). This, in turn, triggers a fresh leg up in US Treasury bond yields, which, along with the risk of a further escalation of the Iran war, benefits the US Dollar’s (USD) reserve currency status and supports the USD/JPY pair.

Spot prices once again showed some resilience below the 100-period Exponential Moving Average (EMA) on the 4-hour chart, and the subsequent move up favors bullish traders. That said, the Moving Average Convergence Divergence (MACD) line has slipped marginally below the signal line around the zero mark, with a flat histogram, suggesting fading upside momentum rather than a decisive shift in trend.

Moreover, the Relative Strength Index (RSI) near 48 stays close to its midline, reinforcing a consolidative tone within an overall upward context. Nevertheless, the near-term bias is mildly bullish as the USD/JPY pair holds above the 100-period EMA on the 4-hour chart, near 158.20, which keeps the broader uptrend structure intact.

In the meantime, initial support emerges at 158.20 from the 100-period EMA, followed by 157.65, where the latest downswing stalled. A break below 157.65 would expose deeper retracement levels toward the mid-157.00s. On the topside, immediate resistance stands at 159.30, aligned with recent intraday highs, with a break opening the way to 159.80 and the 160.00 psychological barrier.

(The technical analysis of this story was written with the help of an AI tool.)

USD/JPY 4-hour chart

Japanese Yen FAQs

The Japanese Yen (JPY) is one of the world’s most traded currencies. Its value is broadly determined by the performance of the Japanese economy, but more specifically by the Bank of Japan’s policy, the differential between Japanese and US bond yields, or risk sentiment among traders, among other factors.

One of the Bank of Japan’s mandates is currency control, so its moves are key for the Yen. The BoJ has directly intervened in currency markets sometimes, generally to lower the value of the Yen, although it refrains from doing it often due to political concerns of its main trading partners. The BoJ ultra-loose monetary policy between 2013 and 2024 caused the Yen to depreciate against its main currency peers due to an increasing policy divergence between the Bank of Japan and other main central banks. More recently, the gradually unwinding of this ultra-loose policy has given some support to the Yen.

Over the last decade, the BoJ’s stance of sticking to ultra-loose monetary policy has led to a widening policy divergence with other central banks, particularly with the US Federal Reserve. This supported a widening of the differential between the 10-year US and Japanese bonds, which favored the US Dollar against the Japanese Yen. The BoJ decision in 2024 to gradually abandon the ultra-loose policy, coupled with interest-rate cuts in other major central banks, is narrowing this differential.

The Japanese Yen is often seen as a safe-haven investment. This means that in times of market stress, investors are more likely to put their money in the Japanese currency due to its supposed reliability and stability. Turbulent times are likely to strengthen the Yen’s value against other currencies seen as more risky to invest in.

Source link

24 03, 2026

GBP/USD Forecast: Pound Sterling Slides as Middle East Tensions Escalate

By |2026-03-24T03:10:48+02:00March 24, 2026|Forex News, News|0 Comments


– Written by

The Pound to US Dollar (GBP/USD) exchange rate came under notable pressure on Monday as investors reacted to renewed geopolitical tensions in the Middle East.

At the time of writing, GBP/USD was trading near $1.3263, down roughly 0.6% compared to the start of the session.

The US Dollar rallied sharply at the beginning of the week, benefiting from a flight to safety as geopolitical risks escalated.

Investor sentiment deteriorated after US President Donald Trump delivered a firm warning to Iran, calling for the reopening of the Strait of Hormuz within a tight timeframe or risking direct military action against strategic targets.

Iran responded with its own threats, signalling that any US intervention would be met with significant retaliation, including potential disruption to vital infrastructure and shipping routes across the Persian Gulf.

This exchange heightened fears of a broader conflict, with markets increasingly concerned about the implications for global energy supply and the risk of a prolonged disruption to oil shipments through the region.

As a result, demand for the safe-haven US Dollar increased markedly.

Save on Your GBP/USD Transfer

Get better rates and lower fees on your next international money transfer.
Compare TorFX with top UK banks in seconds and see how much you could save.


Compare the Best GBP/USD Rates »

Despite its losses against the US Dollar, the Pound held firmer against several other currencies, supported by expectations that the Bank of England may need to raise interest rates further.

With the UK facing growing inflationary pressures linked to rising energy costs, investors are now pricing in the possibility of multiple rate increases over the course of the year.

Short-Term GBP/USD Forecast: UK PMIs in Focus

Developments in the Middle East will remain a key driver of the Pound to US Dollar exchange rate, but upcoming UK economic data could also influence direction.

The release of the latest preliminary PMI figures is expected to provide an early indication of how the UK economy is coping amid the current geopolitical backdrop.

If the services sector continues to show resilience, it could offer some support to Sterling. However, any signs of weakness may leave the currency vulnerable to further losses.

At the same time, any escalation in tensions, particularly if the US follows through on its threats against Iranian energy infrastructure, could reinforce demand for the US Dollar as investors seek safer assets.

Like this piece? Please share with your friends and colleagues:


International Money Transfer? Ask our resident FX expert a money transfer question or try John’s new, free, no-obligation personal service! ,where he helps every step of the way,
ensuring you get the best exchange rates on your currency requirements.

TAGS: Pound Dollar Forecasts

Source link

23 03, 2026

Bears defend 159.00, eye a close below 158.00

By |2026-03-23T23:09:51+02:00March 23, 2026|Forex News, News|0 Comments

The Japanese Yen (JPY) begins the week on a strong foot as USD/JPY falls some 0.67% on Monday amid an improvement in risk appetite, following the White House’s delay of attacks on Iran for five days and its claim that the US had “very productive” talks with Tehran. At the time of writing, the pair trades at 158.06.

USD/JPY Price Forecast: Technical Outlook

Last Friday, the USD/JPY technical picture was bullish-biased, but the sudden reversal on Monday could open the door to a test of the next key support at 156.46, the March 5 swing low.

Momentum remains bullish but appears to be fading, as indicated by a falling Relative Strength Index (RSI) that is about to clear the 50-neutral level.

If USD/JPY closes the day below the 20-day SMA at 157.91, it would form a bearish engulfing pattern, clearing the way for further downside. The next support would be 157.50, followed by the 157.00 figure, the March 5 cycle low, and the 100-day SMA at 156.16. Below this level, the next area of interest is the February 23 daily low at 153.99.

On the upside, bulls must climb back above 159.00 if they want to remain hopeful of challenging the 160.00 milestone.

USD/JPY Price Chart – Daily

USD/JPY Daily Chart

Japanese Yen Price Today

The table below shows the percentage change of Japanese Yen (JPY) against listed major currencies today. Japanese Yen was the strongest against the US Dollar.

USD EUR GBP JPY CAD AUD NZD CHF
USD -0.47% -0.77% -0.71% -0.09% -0.01% -0.68% -0.35%
EUR 0.47% -0.30% -0.20% 0.42% 0.59% -0.22% 0.12%
GBP 0.77% 0.30% 0.09% 0.73% 0.89% 0.08% 0.41%
JPY 0.71% 0.20% -0.09% 0.64% 0.70% -0.03% 0.35%
CAD 0.09% -0.42% -0.73% -0.64% 0.06% -0.72% -0.31%
AUD 0.00% -0.59% -0.89% -0.70% -0.06% -0.80% -0.38%
NZD 0.68% 0.22% -0.08% 0.03% 0.72% 0.80% 0.36%
CHF 0.35% -0.12% -0.41% -0.35% 0.31% 0.38% -0.36%

The heat map shows percentage changes of major currencies against each other. The base currency is picked from the left column, while the quote currency is picked from the top row. For example, if you pick the Japanese Yen from the left column and move along the horizontal line to the US Dollar, the percentage change displayed in the box will represent JPY (base)/USD (quote).

Source link

23 03, 2026

EURUSD Forecast & Predictions for 2026, 2027–2028, and Beyond until 2030

By |2026-03-23T19:08:48+02:00March 23, 2026|Forex News, News|0 Comments

The EURUSD currency pair is one of the most popular and traded pairs in the global currency market. Its rate reflects shifts in economic conditions across the US and the Eurozone. The pair’s fluctuations are sensitive to the Fed and the ECB, the inflation rate, and global events.

This article delves into EURUSD forecasts for 2026 and beyond, assessing market sentiment and considering technical and fundamental factors. Read this article to get an answer to the main question: Is it worth investing in this currency pair now?

The article covers the following subjects:

Major Takeaways

  • The current price of the EURUSD pair is $1.15948 as of 23.03.2026.
  • The EURUSD pair reached its all-time high of $1.6039 on 15.07.2008. The pair’s all-time low of 0.8227 was recorded on 26.10.2000.
  • The EURUSD currency pair reflects the ratio of the euro to the US dollar.
  • The euro is the world’s second most valued reserve currency following the US dollar.
  • The EURUSD pair is the most liquid trading instrument in the Forex market.
  • The pair’s trajectory depends on the decisions of the ECB and Fed on interest rates, inflation, GDP growth, and other macroeconomic indicators.
  • The asset’s volatility increases during economic data publications and geopolitical events.
  • The pair is actively traded in the European and American sessions.
  • It is popular both in short-term speculative trading and in hedging currency risks.
  • It exhibits high exposure to forecasting under stable market conditions.
  • It often shows a positive correlation with the GBPUSD pair and a negative correlation with the USDCHF pair.
  • It often serves as a barometer of global economic sentiment and the monetary policy of the world’s largest economies.
  • EURUSD: Technical analysis suggests the euro is trading within a medium-term downtrend. Last week, the price rebounded.

EURUSD Real-Time Market Status

The EURUSD currency pair is trading at $1.15948 as of 23.03.2026.

When analyzing the EURUSD pair, it is essential to consider the ECB and Fed decisions regarding interest rates, inflation, and employment in the US and the eurozone. These indicators shape the pair’s trajectory. Historical extremes can reveal important technical levels, while technical analysis can help determine optimal entry and exit points.

Indicator

Value

ECB interest rate

2.15%

Fed interest rate

3.75%

EU inflation

1.9%

US inflation

2.4%

All-time high

$1.6039

All-time low

$0.8227

52-Week Range

$1.0471–$1.2079

Change over 12 months

-0.98%

Current trend

Bearish

Euro/Dollar Weekly Price Forecast as of 23.03.2026

Last week, the euro price increased during a correction within the medium-term downtrend. The asset approached the resistance A at 1.1648–1.1626 but has not yet tested it. Therefore, the correction is likely to continue this week, with the price testing the resistance A. Once it is tested, consider short trades with the first target at 1.1529 and a second one around 1.1410.

If the EURUSD pair breaks above the resistance A this week, the correction will extend toward the trend boundary at 1.1767–1.1734. Short trades can be considered near this zone.

EURUSD Trading Ideas for the Week:

Sell at resistance A at 1.1648–1.1626. TakeProfit: 1.1529, 1.1410. StopLoss: 1.1702.

Technical analysis based on margin zones methodology is presented by an independent analyst, Alex Rodionov.

EURUSD Price Forecast for 2026 Based on Technical Analysis

The EUR/USD pair reached the $1.22 resistance level but failed to consolidate above it, after which it began to decline. Quotes are gradually falling. The support level is located at $1.12–1.13.

MACD is turning down, and the RSI is falling to 35–40, indicating increased selling pressure. The SMA50 and SMA200 are already above the market price, signaling a bearish trend.

The base scenario suggests a decline in quotes with possible short-term pullbacks to key support levels.

Below are the projected price levels for EUR/USD over the next 12 months:

Month

Minimum, $

Average, $

Maximum, $

March 2026

1.148

1.160

1.175

April 2026

1.138

1.151

1.167

May 2026

1.123

1.136

1.154

June 2026

1.120

1.134

1.150

July 2026

1.118

1.131

1.147

August 2026

1.120

1.133

1.149

September 2026

1.115

1.129

1.145

October 2026

1.110

1.125

1.141

November 2026

1.114

1.128

1.145

December 2026

1.118

1.132

1.148

January 2027

1.120

1.134

1.150

February 2027

1.123

1.137

1.153

Long-Term Trading Plan for EURUSD for 2026

In 2026, short trades can be considered after the pair ends upward corrections. Positions can be opened in the $1.16–1.17 area upon confirmation of reversal signals.

Profit-taking targets are located at the $1.12–1.13 support level, where positions can be partially closed.

An alternative scenario implies that the euro settles above $1.18. In this case, it would be better to revise the trading strategy.

Analysts’ EURUSD Price Projections for 2026

Forecasts for EUR/USD in 2026 vary. Analysts factor in macroeconomic expectations, central bank policies, and geopolitical factors, including the conflict in the Middle East. Most analysts expect a choppy market, but a decline in quotes cannot be ruled out.

WalletInvestor

Price range: $1.192–$1.216.

WalletInvestor predicts growth for the EUR/USD pair. In the spring, the price will likely remain around $1.20, followed by a gradual strengthening. By year-end, the price is expected to reach a high of $1.215.

Month

Minimum, $

Average, $

Maximum, $

April

1.193

1.200

1.201

May

1.192

1.197

1.200

June

1.197

1.204

1.204

July

1.204

1.215

1.215

August

1.213

1.214

1.216

September

1.214

1.214

1.216

October

1.211

1.211

1.214

November

1.202

1.205

1.210

December

1.206

1.213

1.215

CoinCodex

Price range: $1.09–$1.17.

CoinCodex anticipates a decline in the EUR/USD pair. By June, the average price will trade near $1.12, and by November, it will likely slide to a low of $1.09. A recovery is possible in December.

Month

Minimum, $

Average, $

Maximum, $

March

1.14

1.15

1.17

April

1.11

1.12

1.15

May

1.13

1.13

1.15

June

1.11

1.12

1.13

July

1.11

1.12

1.15

August

1.13

1.13

1.14

September

1.11

1.12

1.13

October

1.10

1.11

1.12

November

1.09

1.10

1.11

December

1.11

1.12

1.12

LongForecast

Price range: $1.114–$1.195.

According to LongForecast, the EUR/USD pair is expected to trade sideways. In the spring, quotes will likely remain in the $1.11–1.18 range, and by August, they may reach $1.18. However, in December, the pair may decline to $1.14.

Month

Minimum, $

Average, $

Maximum, $

March

1.120

1.150

1.183

April

1.114

1.137

1.166

May

1.117

1.134

1.151

June

1.127

1.144

1.161

July

1.142

1.159

1.176

August

1.148

1.165

1.182

September

1.128

1.145

1.165

October

1.132

1.149

1.166

November

1.149

1.177

1.195

December

1.125

1.142

1.177

Analysts’ EURUSD Price Projections for 2027

Forecasts for the EURUSD for 2027 remain mixed. Some analysts predict a strengthening of the euro, while others anticipate a decline in the exchange rate amid deteriorating economic conditions in the EU.


Note: The price ranges reflect the asset's expected volatility throughout the year. Lows and highs may not be shown in the summary tables.

WalletInvestor

Price range: $1.208–$1.243.

According to WalletInvestor, the EUR/USD rate may rise in 2027. By summer, the average price will likely reach $1.228, and the yearly high is expected in the third quarter at $1.243. In December, quotes may decline.

Quarter

Minimum, $

Average, $

Maximum, $

Q1

1.208

1.213

1.220

Q2

1.220

1.228

1.231

Q3

1.232

1.242

1.243

Q4

1.230

1.237

1.242

CoinCodex

Price range: $1.04–$1.16.

CoinCodex projects that the EUR/USD pair may decline in 2027. In the first half of the year, the euro may trade above $1.12, but a downward trend is expected to begin later. By December, the pair may fall to a low of $1.04.

Quarter

Minimum, $

Average, $

Maximum, $

Q1

1.10

1.12

1.15

Q2

1.11

1.14

1.16

Q3

1.10

1.12

1.14

Q4

1.04

1.08

1.13

LongForecast

Price range: $1.142–$1.270.

LongForecast predicts a wave-like movement for the EUR/USD pair. In the first half of the year, analysts expect the euro to strengthen to $1.27 against the greenback. However, by December, the euro may correct to $1.19.

Quarter

Minimum, $

Average, $

Maximum, $

Q1

1.142

1.188

1.230

Q2

1.212

1.250

1.270

Q3

1.146

1.192

1.251

Q4

1.154

1.191

1.224

Analysts’ EURUSD Price Projections for 2028

The outlook for the EURUSD for 2028 remains uncertain. Some analysts predict a moderate strengthening of the euro, while others expect high volatility.

WalletInvestor

Price range: $1.235–$1.271.

WalletInvestor predicts moderate growth for the pair. By summer, quotes will rise above $1.25. The bullish trend will continue, and by November, the rate will reach a high of $1.271. A correction is possible in December.

Quarter

Minimum, $

Average, $

Maximum, $

Q1

1.235

1.241

1.248

Q2

1.247

1.255

1.259

Q3

1.259

1.266

1.271

Q4

1.257

1.264

1.269

CoinCodex

Price range: $1.04–$1.21.

CoinCodex predicts a moderate upward trend. By summer, the average price will reach $1.11, and by year-end, the pair could reach a high of $1.21.

Quarter

Minimum, $

Average, $

Maximum, $

Q1

1.04

1.07

1.09

Q2

1.06

1.11

1.15

Q3

1.14

1.18

1.21

Q4

1.16

1.18

1.21

LongForecast

Price range: $1.156–$1.244.

LongForecast anticipates continued sideways movement. After a smooth start to the year, the pair may decline in the second quarter. In the third quarter, the price may reach a yearly high of $1.244, after which a correction is expected.

Quarter

Minimum, $

Average, $

Maximum, $

Q1

1.176

1.203

1.232

Q2

1.156

1.190

1.217

Q3

1.172

1.214

1.244

Q4

1.160

1.187

1.226

Analysts’ EURUSD Price Projections for 2029

Forecasts for EURUSD in 2029 vary significantly. Some experts predict a gradual strengthening of the euro, while others expect a correction after a prolonged bullish trend.

WalletInvestor

Price range: $1.262–$1.298.

WalletInvestor anticipates a moderate strengthening for the major currency pair. At the beginning of the year, the euro may remain slightly above $1.26. By summer, quotes will rise to $1.28, and by November, they will reach a high of $1.298.

Quarter

Minimum, $

Average, $

Maximum, $

Q1

1.262

1.268

1.275

Q2

1.275

1.282

1.286

Q3

1.286

1.296

1.298

Q4

1.284

1.291

1.297

CoinCodex

Price range: $1.13–$1.26.

CoinCodex projects that the euro will weaken against the US dollar. By June, the average price will be around $1.2. In the second half of the year, the bearish trend will continue, and by December, the rate may fall to $1.13.

Quarter

Minimum, $

Average, $

Maximum, $

Q1

1.20

1.24

1.26

Q2

1.16

1.20

1.25

Q3

1.14

1.17

1.19

Q4

1.13

1.14

1.17

LongForecast

Price range: $1.158–$1.311.

LongForecast suggests the EUR/USD pair will rise gradually, reaching a high of $1.311 by the third quarter. After that, a slight correction is expected.

Quarter

Minimum, $

Average, $

Maximum, $

Q1

1.158

1.194

1.230

Q2

1.175

1.209

1.243

Q3

1.210

1.272

1.311

Q4

1.189

1.235

1.292

Analysts’ EURUSD Price Projections for 2030

Predictions for the EUR/USD pair’s performance in 2030 reflect a variety of scenarios. Some experts anticipate a gradual strengthening of the euro, while others predict a slight decline. Meanwhile, moderate volatility is expected.

WalletInvestor

Price range: $1.290–$1.325.

According to WalletInvestor, the EUR/USD pair will continue to increase in 2030. By summer, the average price will trade around $1.3. By the third quarter, quotes may reach a high of $1.325, followed by a possible correction.

Quarter

Minimum, $

Average, $

Maximum, $

Q1

1.290

1.295

1.302

Q2

1.302

1.309

1.314

Q3

1.313

1.324

1.325

Q4

1.311

1.319

1.324

CoinCodex

Price range: $1.10–$1.16.

CoinCodex projects that EUR/USD quotes will decline. By the end of June, the pair will likely fall to $1.13, and by December, it will likely reach a yearly low of $1.1.

Quarter

Minimum, $

Average, $

Maximum, $

Q1

1.13

1.14

1.16

Q2

1.12

1.13

1.15

Q3

1.10

1.12

1.14

Q4

1.10

1.11

1.13

Analysts’ EURUSD Price Projections until 2050

It is challenging to forecast currency exchange rates for the next 15–25 years. The global economy, geopolitics, and innovations are constantly changing, making it nearly impossible to predict the price trajectory.

Inflation, employment, and economic growth are hard to predict in the long run. A new reserve currency may emerge, global trade may change, or new financial instruments may appear, completely transforming the financial market. Any attempts to predict the price for 2040–2050 should be treated with caution.

EURUSD Market Sentiment on Social Media

Media sentiment on the EUR/USD pair may influence its short-term trend. A positive tone on social media may boost bullish momentum. Conversely, negative posts may temporarily increase volatility.

User @MBForex offers a cautious forecast: quotes may fall to key support levels. The pair’s direction will depend on fundamental factors.

User @ryukXBT expects the euro to decline. The author believes that now is the perfect time to open a short position. However, a recovery cannot be ruled out.

In general, media sentiment is rather neutral to bearish: traders and analysts expect the pair to decline further, but are monitoring how the price will change near the key support level. Before making trading and investment decisions, it is essential to conduct technical and fundamental analysis and study the latest expert reviews.

EURUSD Price History

The EURUSD pair reached its all-time high of $1.6039 on 15.07.2008.

The lowest price of the EURUSD pair was recorded on 26.10.2000 and reached $0.8227.

To make our forecasts as accurate as possible, it is crucial to evaluate historical data. The chart below shows EURUSD’s performance over the last ten years.

  • Between 2002 and 2008, the pair was trading within an upward trend, reaching 1.60 against a weak US dollar and the strengthened EU economy.
  • Following 2008, the exchange rate began to slide. The eurozone’s financial crisis led to a further decline, reaching 1.20–1.25.
  • Between 2014 and 2020, the euro faced headwinds due to the European Central Bank’s (ECB) low interest rates and stimulus policies.
  • In 2020–2021, the EURUSD rate surged to 1.23, reacting to the Fed’s accommodating policy and the post-pandemic recovery.
  • In 2022, the pair slipped below parity amid aggressive rate hikes in the US and the EU financial crisis.
  • Since 2023, the EURUSD pair has stabilized within the 1.05–1.10 range.
  • In 2025, the EURUSD pair was highly volatile due to monetary policy changes by the ECB and the Fed. In the first half of the year, the euro strengthened to $1.1829. In the second half, the pair traded in a wide range of $1.1391–$1.1918, reaching $1.1740 in December.
  • In the first half of January 2026, the euro weakened to $1.1577, but then a bullish trend began, pushing the price above $1.1950. In early March, after a military conflict broke out in the Middle East, the pair fell to $1.16. The bearish trend is expected to continue amid high demand for the US dollar as a safe-haven asset.

EURUSD Price Fundamental Analysis

Fundamental analysis provides the context necessary to understand what causes the EURUSD to move in one direction or another. In contrast to the technical approach, fundamental analysis relies on economic and political data that reflect the actual state of the US and eurozone economies. These indicators influence market participants’ expectations, shaping long-term trends for the EURUSD currency pair.

What Factors Affect the EURUSD Pair?

The EUR/USD pair is sensitive to the following key macroeconomic indicators:

  • Fed and ECB interest rates.
  • Inflation rates in the US and the eurozone.
  • Gross domestic product (GDP) growth rates.
  • Unemployment rates.
  • Political stability and geopolitical factors.
  • Trade balance.
  • Speeches by central bank officials.
  • Market expectations on monetary policy.
  • US–EU bond yield spread.
  • Global risk appetite and demand for the US dollar as a safe-haven asset.

These factors have the potential to strengthen or weaken the euro and the US dollar, leading to short-term fluctuations or stable market trends.

More Facts About EURUSD

The EURUSD pair is the world’s most traded trading instrument on Forex, reflecting the ratio of the euro (the currency of the eurozone) to the US dollar. It attracts both speculative traders and long-term investors.

This pair is characterized by high liquidity, narrow spreads, and quick reaction to macroeconomic news. This pair is particularly sensitive to macroeconomic data, including interest rates, inflation, GDP, and employment data. The decisions of the European Central Bank and the US Federal Reserve directly impact the EURUSD rate.

Meanwhile, the EURUSD pair is exposed to global risks. In times of uncertainty, the US dollar strengthens as a protective asset, while in times of economic recovery, the euro can grow.

Analyzing this pair requires a multifaceted approach, incorporating a fundamental focus on economic indicators, technical analysis to identify entry and exit points, and ongoing monitoring of market sentiment. Such a comprehensive approach makes the EURUSD pair a crucial barometer of global financial health.

Advantages and Disadvantages of Investing in EURUSD

The EURUSD is the most liquid currency pair in the Forex market, suitable for short-term speculation and long-term investment. However, like any instrument, it has its pros and cons.

Advantages

  • High liquidity and narrow spreads.
  • Round-the-clock trading.
  • Wide range of analytical tools and forecasts.
  • Offered by many trading platforms and brokers.
  • The pair is well studied and predictable in a stable market.
  • High sensitivity to economic news, creating opportunities for trading on news.

Disadvantages

  • High volatility when macroeconomic data is released.
  • Dependence on central bank policies and geopolitical factors.
  • Requires a deep understanding of macroeconomic factors.
  • Strongly influenced by external factors, not always predictable.
  • False signals in case of increased speculative activity.
  • Lack of a sustainable trend in a flat market.

The EURUSD pair continues to be regarded as an appealing investment due to its clarity and accessibility. However, it is essential to exercise caution and always conduct thorough technical and fundamental analyses.

How We Make Forecasts

Our forecasts are based on a combination of technical and fundamental analysis.

  • For short-term forecasts for several days to a week, a technical analysis is used. It involves studying price patterns, support and resistance levels, MACD, RSI, and moving averages, as well as analyzing price behavior on different time frames.
  • Medium-term forecasts for 1–3 months rely on macroeconomic indicators, interest rates, inflation, and central bank decisions.
  • Long-term forecasts extending over a period of 6–24 months are informed by economic cycles, geopolitical factors, and global market trends. The seasonal patterns, historical levels, and the perspectives of reputable investment funds are integral to the refinement of these forecasts.

Such a comprehensive approach enables us to assess the current price movement and the future trajectory of the analyzed currency pair.

Conclusion: Is EURUSD a Good Investment?

EURUSD remains one of the most liquid pairs in the FX market, which makes it a convenient tool for active trading and hedging USD risk. The technical picture and consensus forecasts point to moderate, mostly range-bound movement in the coming years, without a clear long-term trend. In such conditions, return potential depends largely on the ability to navigate market cycles.

For short- and medium-term traders, EURUSD may be attractive thanks to clear support and resistance levels, high liquidity, and available leverage. In a long-term portfolio, the pair serves mainly as a diversification tool rather than a standalone position. The best approach to EURUSD is to treat it as a practical portfolio tool and base decisions on technical analysis and the chosen time horizon, rather than on a single forecast.

EURUSD Price Prediction FAQs

Price chart of EURUSD in real time mode

The content of this article reflects the author’s opinion and does not necessarily reflect the official position of LiteFinance broker. The material published on this page is provided for informational purposes only and should not be considered as the provision of investment advice for the purposes of Directive 2014/65/EU.


According to copyright law, this article is considered intellectual property, which includes a prohibition on copying and distributing it without consent.

Rate this article:

{{value}} ( {{count}} {{title}} )



Source link

23 03, 2026

The EURJPY reaches the barrier– Forecast today – 23-3-2026

By |2026-03-23T15:07:18+02:00March 23, 2026|Forex News, News|0 Comments

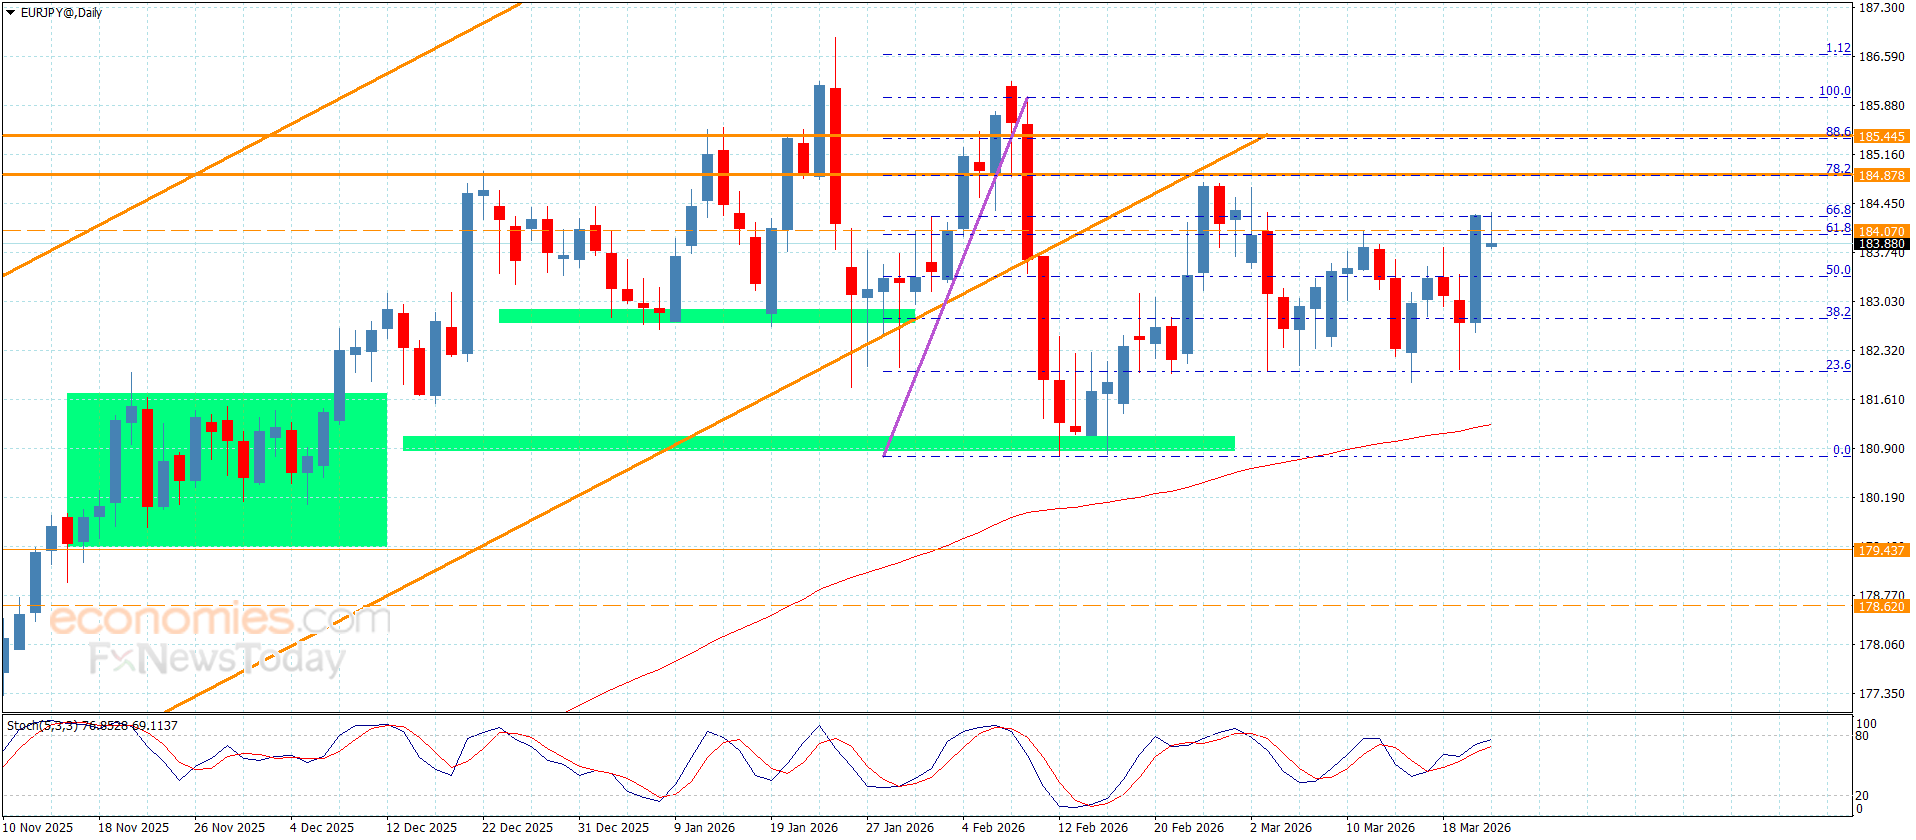
The EURJPY pair moves away from 182.00 support, affected by the positivity of the main indicators, attacking the barrier at 184.20 which represents %66.8 Fibonacci corrective level as appears in the above image.


Note that the continuation of the stability below the barrier that might push it to provide new bearish trading, reaching 183.40 and 182.65, while breaching the barrier and holding above it will confirm its readiness to form strong bullish waves, to expect reaching 184.80, attempting to reach the next target near 185.45.


The expected trading range for today is between 183.40 and 184.20


Trend forecast: Fluctuating


Source link

23 03, 2026

Pound to Dollar Week Ahead Forecast: Yield Spike Fails to Sustain GBP Rally

By |2026-03-23T11:06:08+02:00March 23, 2026|Forex News, News|0 Comments


– Written by

The Pound to Dollar exchange rate (GBP/USD) fell back toward 1.3300 after a sharp post-BoE rally, as a surge in UK bond yields and renewed energy price shocks triggered a fresh bout of Sterling volatility.

While higher yields initially supported the Pound, a sharp sell-off in gilts and deteriorating risk sentiment have raised concerns that tightening financial conditions could weigh heavily on the UK economy and limit GBP/USD upside.

GBP/USD Forecasts: Bonds collapse

Standard Chartered has a 12-month Pound to Dollar (GBP/USD) exchange rate forecast of 1.30.

JP Morgan has cut its June 2026 GBP/USD forecast to 1.34 from 1.41 previously.

According to JP Morgan; “The closure of the Strait of Hormuz led us to turn neutral on the dollar for the first time in a year and we are now shifting to a tactically bullish view on the dollar.”

GBP/USD rallied strongly to highs near 1.3450 after the Bank of England policy decision, but there was a slide to 1.3300 on Friday amid a collapse in UK bonds.

Save on Your GBP/USD Transfer

Get better rates and lower fees on your next international money transfer.
Compare TorFX with top UK banks in seconds and see how much you could save.


Compare the Best GBP/USD Rates »

Energy prices and central bank policy decisions dominated during the week with volatile trading conditions.

There was a surge in UK yields and a further big shift in expectations surrounding interest rates with traders pricing in at least two rate hikes this year and a high risk of three hikes.

The 2-year yield jumped to 4.60% from 3.50% at the end of February while the 10-year yield hit a 16-year high near 5.00%

Energy prices surged again following attacks on Middle East gas infrastructure and the dollar still generated defensive demand amid vulnerable risk conditions and weaker equity markets.

On the UK, Standard Chartered noted; “The recent spike in energy prices has revived a familiar dilemma for the BoE – tackle inflation or support softer demand.”

The combination of higher energy prices and yields will have a major negative impact on the economy.

According to MUFG; “The pound is deriving support from the surge in yields (although less support than usual for such a scale of rates move) and that will likely give way if broader risk conditions worsen.”

The Bank of England (BoE) held interest rates at 3.75%, in line with consensus forecasts.

There was a 9-0 vote for unchanged rates compared with expectations that two members would continue to back rate cuts. The central bank also warned that it was watching the impact of energy prices closely amid concerns over the risk of second-round impacts on inflation.

ING commented; “The Bank of England’s unquestionably hawkish decision to hold rates has opened the door to future hikes if energy prices stay elevated.”

It added; “Yet we’d be careful in drawing clear signals from today’s move, which also floated the possibility of faster rate cuts. Under ING’s base case energy scenario, we think the most likely path forward is a prolonged pause.”

The Federal Reserve held interest rates at 3.75% at the latest policy meeting, in line with consensus forecasts.

Chair Powell emphasised that there was a high degree of uncertainty over the outlook.

The interest rate forecasts from individual committee members continued to have a mean projection of one cut for this year.

Like this piece? Please share with your friends and colleagues:


International Money Transfer? Ask our resident FX expert a money transfer question or try John’s new, free, no-obligation personal service! ,where he helps every step of the way,
ensuring you get the best exchange rates on your currency requirements.

TAGS: Pound Dollar Forecasts

Source link

23 03, 2026

Euro clings to bullish bias after hawkish ECB tone

By |2026-03-23T03:03:04+02:00March 23, 2026|Forex News, News|0 Comments

EUR/USD stays in a consolidation phase above 1.1550 after posting impressive gains on Thursday. Comments from policymakers could impact the pair’s action in the near term.

Euro Price This week

The table below shows the percentage change of Euro (EUR) against listed major currencies this week. Euro was the strongest against the US Dollar.

USD EUR GBP JPY CAD AUD NZD CHF
USD -1.30% -1.39% -0.76% -0.07% -1.32% -1.58% -0.16%
EUR 1.30% -0.07% 0.48% 1.24% -0.02% -0.29% 1.14%
GBP 1.39% 0.07% 0.68% 1.31% 0.06% -0.21% 1.28%
JPY 0.76% -0.48% -0.68% 0.72% -0.57% -0.80% 0.62%
CAD 0.07% -1.24% -1.31% -0.72% -1.30% -1.51% -0.09%
AUD 1.32% 0.02% -0.06% 0.57% 1.30% -0.27% 1.17%
NZD 1.58% 0.29% 0.21% 0.80% 1.51% 0.27% 1.41%
CHF 0.16% -1.14% -1.28% -0.62% 0.09% -1.17% -1.41%

The heat map shows percentage changes of major currencies against each other. The base currency is picked from the left column, while the quote currency is picked from the top row. For example, if you pick the Euro from the left column and move along the horizontal line to the US Dollar, the percentage change displayed in the box will represent EUR (base)/USD (quote).

Following Wednesday’s sharp decline, EUR/USD reversed its direction on Thursday and gained more than 1% on the day, supported by the European Central Bank’s relatively hawkish guidance.

The ECB left policy settings unchanged, as anticipated, after the March meeting. “The war in the Middle East has made outlook significantly more uncertain, creating upside risks for inflation and downside risks for economic growth,” the ECB noted in its policy statement.

In the post-meeting press conference, ECB President Christine Lagarde acknowledged that a prolonged war could increase energy prices for longer and erode incomes. Lagarde further added that risks to inflation are tilted to the upside in the near term and said that they could have a “temporary, targeted and tailored” response to the energy shock.

Early Friday, ECB policymaker Joachim Nagel argued that the ECB would need to raise rates in April if the price outlook sours. On a more neutral note, policymaker José Luis Escrivá said that the situation is highly uncertain and volatile, adding that they must continues to assess a wealth of information before taking a policy step.

The economic calendar will not feature any high-tier data releases on Friday. Hence, investors will continue to pay close attention to comments from policymakers.

In case ECB officials voice their willingness to consider policy-tightening in response to rising inflation, the Euro could preserve its strength.

EUR/USD Technical Analysis:

In the 4-hours chart, EUR/USD trades at 1.1576. The near-term bias is mildly bullish as price holds above the 20-period Simple Moving Average (SMA) at 1.1522 and the 50-period SMA near 1.1528, while remaining below the declining 100- and 200-period SMAs around 1.1600 and 1.1715, respectively. This alignment suggests a recovery phase within a broader downside context, with the recent push away from the lower Bollinger Band toward the mid-band reinforcing improving momentum. The Relative Strength Index (RSI) at 59.7 stays above the 50 line, signaling steady bullish pressure without overbought conditions.

Immediate support is seen at 1.1530 (static level), reinforced by the nearby 20- and 50-period SMA, with a deeper floor at 1.1500 (round level) ahead of 1.1460 (static level) if sellers regain control. On the upside, initial resistance comes at 1.1600 (100-period SMA, upper line of the Bollinger Band) ahead of the horizontal barrier near 1.1670 and the 200-period SMA at 1.1715.

(The technical analysis of this story was written with the help of an AI tool.)

Euro FAQs

The Euro is the currency for the 20 European Union countries that belong to the Eurozone. It is the second most heavily traded currency in the world behind the US Dollar. In 2022, it accounted for 31% of all foreign exchange transactions, with an average daily turnover of over $2.2 trillion a day.
EUR/USD is the most heavily traded currency pair in the world, accounting for an estimated 30% off all transactions, followed by EUR/JPY (4%), EUR/GBP (3%) and EUR/AUD (2%).

The European Central Bank (ECB) in Frankfurt, Germany, is the reserve bank for the Eurozone. The ECB sets interest rates and manages monetary policy.
The ECB’s primary mandate is to maintain price stability, which means either controlling inflation or stimulating growth. Its primary tool is the raising or lowering of interest rates. Relatively high interest rates – or the expectation of higher rates – will usually benefit the Euro and vice versa.
The ECB Governing Council makes monetary policy decisions at meetings held eight times a year. Decisions are made by heads of the Eurozone national banks and six permanent members, including the President of the ECB, Christine Lagarde.

Eurozone inflation data, measured by the Harmonized Index of Consumer Prices (HICP), is an important econometric for the Euro. If inflation rises more than expected, especially if above the ECB’s 2% target, it obliges the ECB to raise interest rates to bring it back under control.
Relatively high interest rates compared to its counterparts will usually benefit the Euro, as it makes the region more attractive as a place for global investors to park their money.

Data releases gauge the health of the economy and can impact on the Euro. Indicators such as GDP, Manufacturing and Services PMIs, employment, and consumer sentiment surveys can all influence the direction of the single currency.
A strong economy is good for the Euro. Not only does it attract more foreign investment but it may encourage the ECB to put up interest rates, which will directly strengthen the Euro. Otherwise, if economic data is weak, the Euro is likely to fall.
Economic data for the four largest economies in the euro area (Germany, France, Italy and Spain) are especially significant, as they account for 75% of the Eurozone’s economy.

Another significant data release for the Euro is the Trade Balance. This indicator measures the difference between what a country earns from its exports and what it spends on imports over a given period.
If a country produces highly sought after exports then its currency will gain in value purely from the extra demand created from foreign buyers seeking to purchase these goods. Therefore, a positive net Trade Balance strengthens a currency and vice versa for a negative balance.

Source link

22 03, 2026

Weekly Forex Forecast – 23th to 27th March 2026 (Charts)

By |2026-03-22T19:00:56+02:00March 22, 2026|Forex News, News|0 Comments

I wrote on 15th March that the best trades for the week would be:

  1. Long of the USD/JPY currency pair. This gave a loss of 0.31%.

  2. Long of Wheat. This gave a loss of 1.27%.

Last week’s overall loss of 1.58% is 0.79% per asset.

A summary of last week’s most important data in the market:

  1. US Federal Reserve Policy Meeting – a slightly hawkish tilt as the Fed emphasized inflation risk from the secondary effects of the war in the Middle East, which briefly sent the US Dollar higher.

  2. US PPI – this was much stronger than expected, showing a month-on-month increase of 0.7% while only 0.3% was widely forecast. This suggests higher inflationary pressure in the USA and contributed to the more hawkish sentiment around the US Dollar.

  3. Reserve Bank of Australia Policy Meeting – the Cash Rate was hiked by 0.25% as expected, and the renewed strong focus on inflation was seen as mildly hawkish.

  4. Bank of Japan Policy Meeting – a slightly hawkish hold, with one board member pushing for a rate hike of 0.25% now.

  5. European Central Bank Policy Meeting – a hawkish hold, as the bank revised its 2026 inflation forecast upward.

  6. Bank of England Policy Meeting – a solidly hawkish hold, with analysts now seeing a chance of a rate hike later in 2026.

  7. Bank of Canada Policy Meeting – a marginally dovish hold, with the Bank downplaying inflationary risk.

  8. Canadian CPI (inflation) – slightly lower than expected, showing an increase of only 0.5% month-on-month while 0.7% was widely expected.

  9. Swiss National Bank Policy Meeting – arguably a slightly dovish hold, as the Bank are acting in a way that suggests further cuts to a negative rate are possible.

  10. US Unemployment Claims – very slightly better than expected.

  11. New Zealand GDP = worse than expected, with growth increasing by only 0.2% when 0.5% was expected.

  12. Australia Unemployment Rate – this rose unexpectedly from 4.1% to 4.3%.

  13. UK Unemployment Claims – as expected.

Last week’s data had little effect on the market, excepting the boost in the US Dollar and the strengthening of the Euro after the ECB’s hawkish rate hold. Generally, we are seeing hawkish central banks against the backdrop of a potentially inflationary energy price shock generated by the ongoing war in the Middle East. There are open and frightening questions over how this war might end, with the parties on the bring of seriously escalating by targeting critical energy and infrastructure.

The latest developments in the war are:

  1. A few hours ago, President Trump issued an ultimatum that if the Strait of Hormuz is not opened by Iran within 48 hours, the USA will start destroying Iranian power plans. This follows several days of attacks on other countries’ infrastructure by Iran, which has been aiming at Israel’s (alleged) nuclear reactor in its South and at the oil refinery in Haifa. It is hard to see an outcome where Iran backs down over this so we can expect US attacks here probably on Tuesday or Wednesday. This threat, let alone its execution, is likely to rattle energy and stock markets.

  2. Seven NATO and non-NATO allies have pledged to assist the USA in reopening the Strait of Hormuz. However, experts believe such a military operation will take a few weeks to be executed.

  3. Prediction markets see this war continuing for at least another five weeks, into May, after US troops enter Iran at some point in April. This war is very unlikely to stop quickly, which increases the potential for it to disrupt or influence markets.

Clearly, the USA and Israel are successfully striking all the targets they want to inside Iran, while suffering very few casualties themselves. There is damage to US bases and facilities near the Gulf, and relatively minor damage in Israel, although yesterday’s missile strikes produced an unusually large number of casualties which Israel will see as an escalation to be met.

There is massive damage to Iran’s regime and military. What is far from clear is the fate of the Iranian regime and the large supply of enriched uranium which is somewhere in Iran.

We are on the brink of a very serious escalation.

The middle east war is likely to remain more influential that any economic data releases which are scheduled over the coming week, especially if it escalates towards increased targeting of infrastructure. The top three items have realistic potential to move the market a bit, especially in the British Pound and in the Australian Dollar.

The coming week’s most important data points, in order of likely importance, are:

  1. UK CPI (inflation)

  2. Australian CPI (inflation)

  3. USA, Germany, UK Flash Services & Manufacturing PMI

  4. US Unemployment Claims

  5. UK Retail Sales

Currency Price Changes and Interest Rates

For the month of March, I made no monthly Forex forecast as the US Dollar was not in a clear trend at the start of the month.

Last week saw no currency crosses with excessive volatility, so I am making no forecast for the coming week.

The Euro was the strongest major currency last week, while the Swiss Franc was the weakest. Directional volatility decreased strongly last week, with only 11% of all major pairs and crosses changing in value by more than 1%.

Next week’s volatility is likely to increase and might be exceptionally high due to the escalation of the war in the Middle East, which is now threatening power facilities, oil facilities, and desalination plants. This could generate volatility in the US Dollar, the Japanese Yen, and the Canadian Dollar, not to mention stock markets. There could also be unforeseen side effects which might affect other currencies.

You can trade these forecasts in a real or demo Forex brokerage account.

Weekly Forex Forecast – 23th to 27th March 2026 (Charts)

Key Support and Resistance Levels

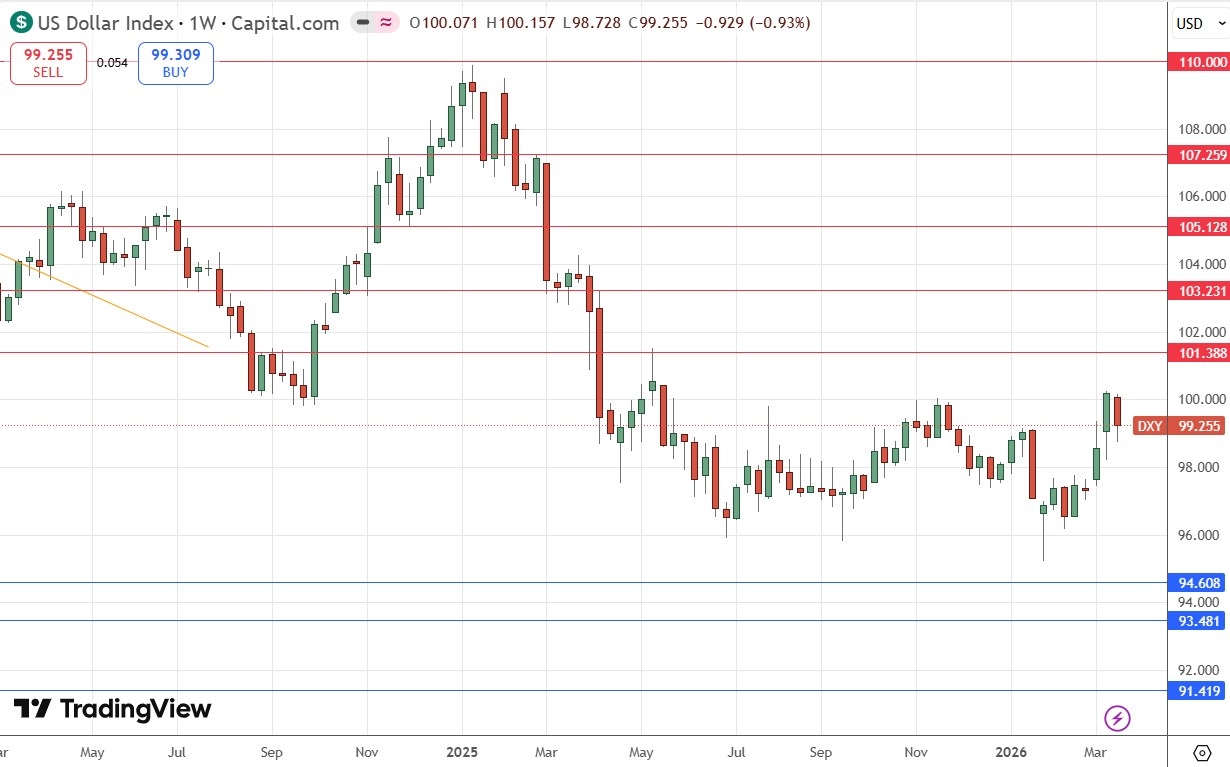
The US Dollar printed a bearish inside bar, although the price remains within a valid long-term trend. There is a lower wick on the candlestick, which is a minor bullish sign. The price has more room to rise before reaching the key resistance level at 101.39.

I think expecting the greenback to rise is still the healthy and correct approach despite this minor retracement, because fundamentals and sentiment still point towards a rising US Dollar, with US Treasury Yields reaching significant highs last week. The Fed itself expects to make one rate cut in 2026, though, although the market does not agree that this is likely to happen.

Weekly Forex Forecast – 23th to 27th March 2026 (Charts)

US Dollar Index Weekly Price Chart

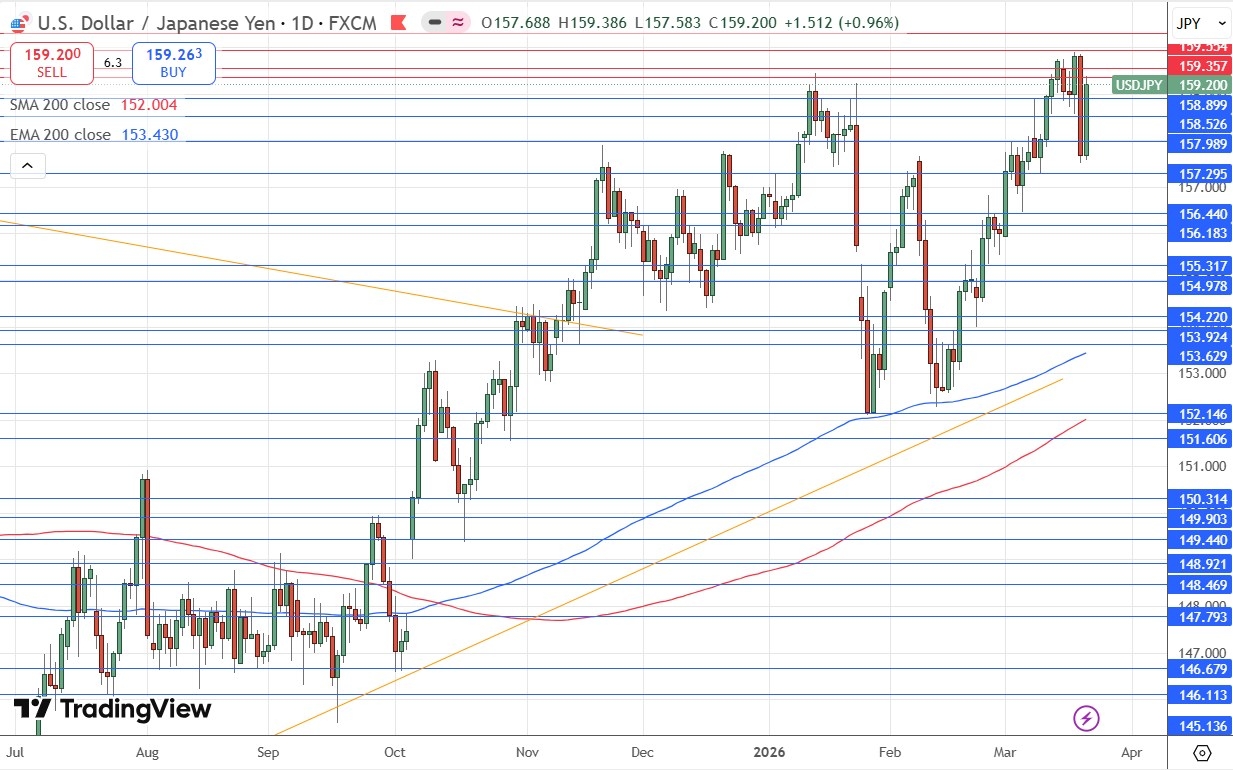
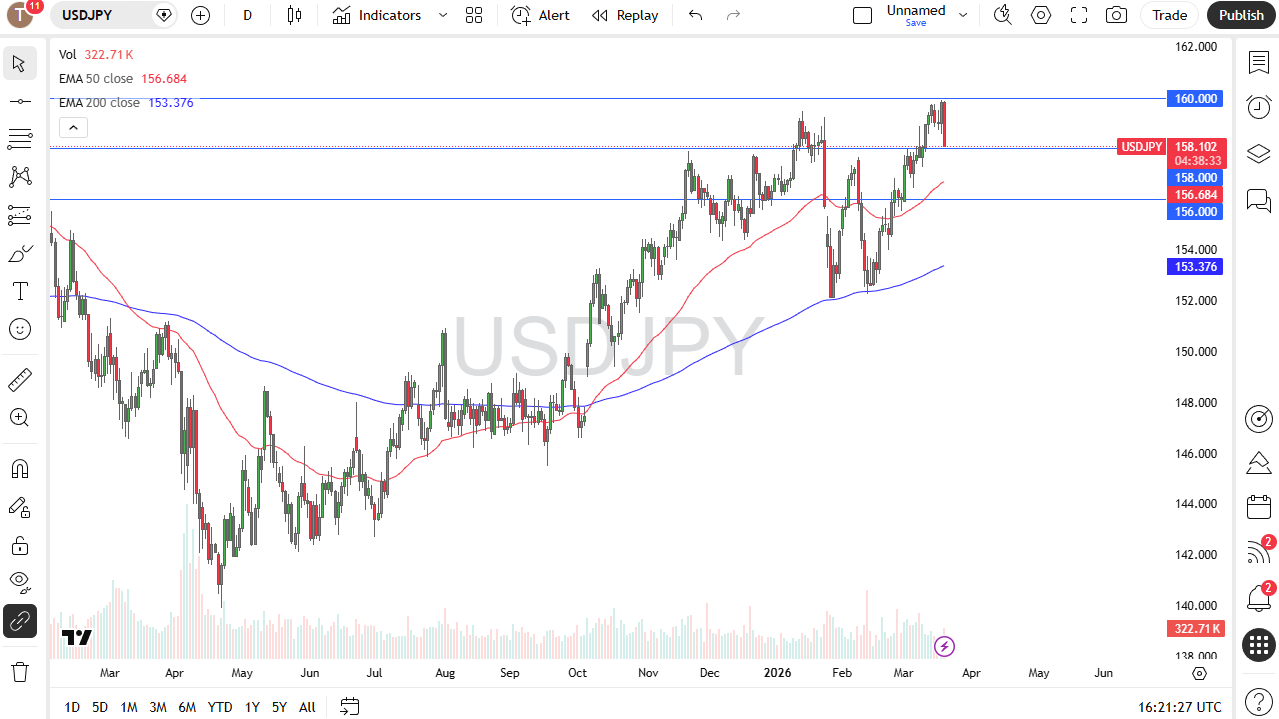
The USD/JPY currency pair gained strongly at the end of last week but could still not regain the high price made earlier in the week, which represented a long-term high. I am long of this currency pair. The only doubts I have is that we have not yet cleared the big round number at ¥160 which has acted as resistance for a long time, and that the technically significant breakout is taking a long time to happen.

The US Dollar lost some ground last week but did better against the Japanese Yen than it did against many other currencies. The Bank of Japan did not look like it is about to start hiking rates very soon at its meeting last week, and that has caused a little underlying weakness in the Yen.

There are excellent fundamental, sentimental, and technical reasons to be long here, but more cautious traders might want to wait for a New York close above ¥160 before going long.

Weekly Forex Forecast – 23th to 27th March 2026 (Charts)

USD/JPY Daily Price Chart

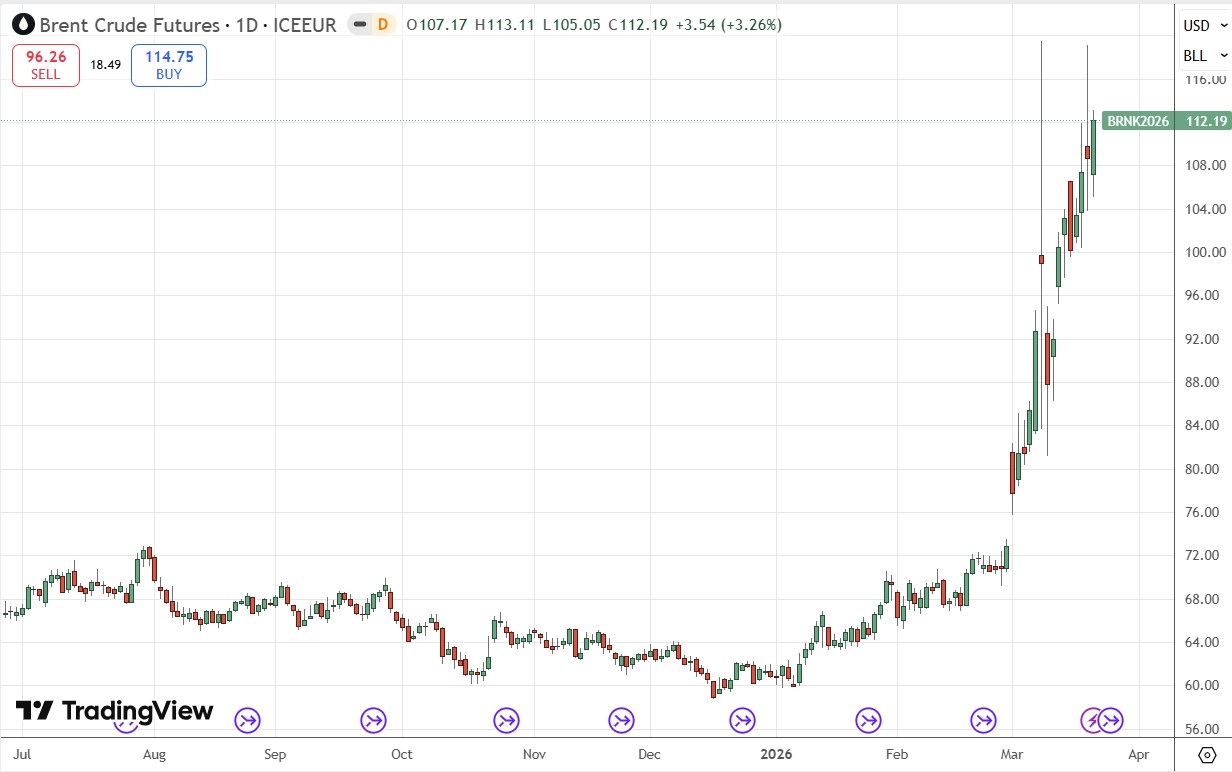
Brent Crude Oil is outperforming WTI Crude Oil, mainly because the USA is functionally energy independent (WTI), while Brent Crude is seaborne international trade which is currently more prone to well-founded fears of supply disruption due to the war in the Middle East and Iranian blockade of the Strait of Hormuz.

The war in the middle east is showing signs of escalating as President Trump threatens Iranian power stations if Iran does not open the Strait of Hormuz by about dawn local time Tuesday. Iran in turn threatened power and desalination plants throughout much of the Middle East, which it has already shown it is prepared to target and in some cases able to target.

These threats, as well as ongoing speculation that the USA might seize Kharg Island as one of its next military steps, are spooking markets – we can be sure that markets will open with energy prices higher and stock markets lower as the new week gets underway, unless there is a credible rumour of ceasefire talks.

Polymarket is showing US ground troops in Iran at some point during April and the USA (plus presumably Israel) ceasing operations in May, meaning the war will probably go on for at least another five weeks.

It is likely to be dangerous to enter now as we could easily see a fast and huge move in the price either up or down. However, the price action does look bullish, so longs will still be dominating orders. I don’t see the Iranians backing down, and I think that means a week of rising crude oil prices.

Despite the mature and very over-extended trend here, and its total reliance on geopolitical developments, I think it will still be a good idea to enter long on bullish price action using a trailing stop (I prefer 3 X ATR (100)). It will probably be wise to use a very small position size maybe one-quarter of the usual, or maybe even one-eighth.

Weekly Forex Forecast – 23th to 27th March 2026 (Charts)

Brent Crude Oil Daily Price Chart

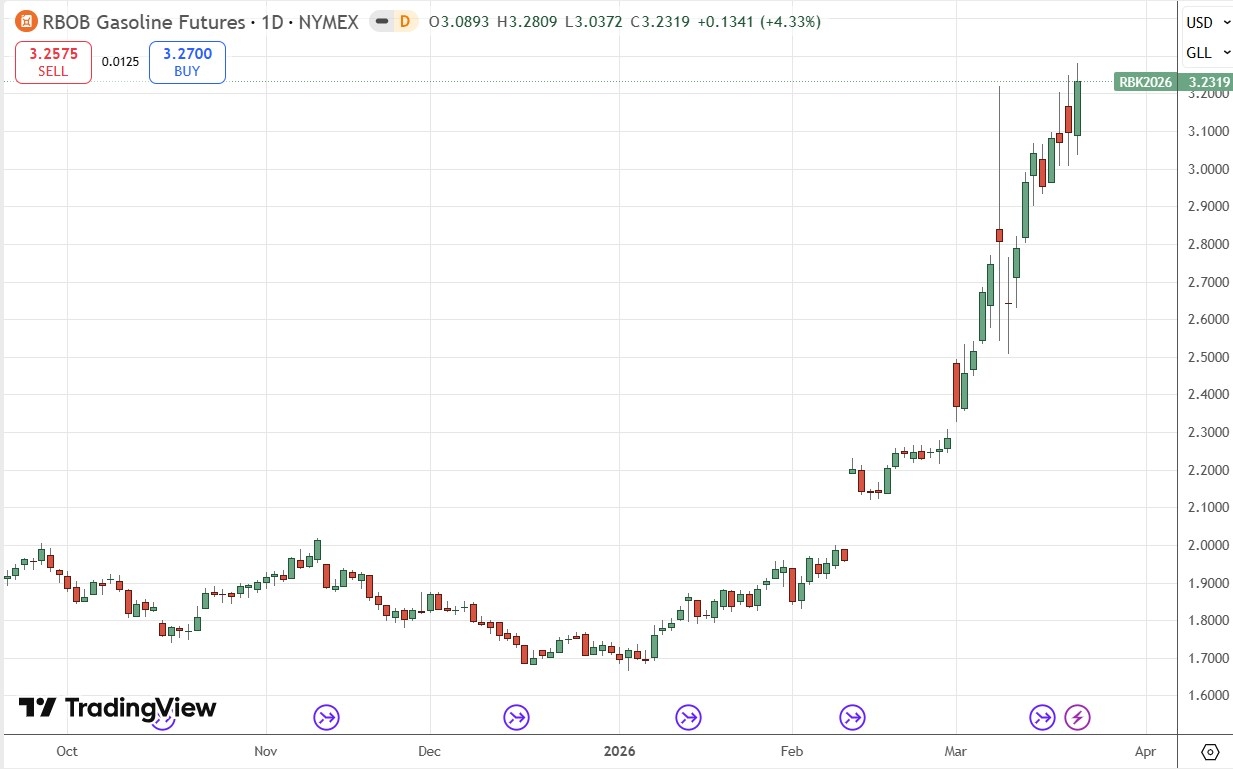
RBOB Gasoline futures rose firmly to close at a new 3-year high last week ending very near the high price, which was made on Friday. Gasoline is trading in blue sky and can keep rising easily.

This is all about what I wrote above concerning Brent Crude Oil. As the price of crude oil rises, so the price of Gasoline is almost certain to rise with high positive correlation between the two assets, as gasoline is derived by refining crude oil.

As I wrote above, it might be too late for a long trade, but it may be wise to try to get in on the ongoing action using a very small position size (respect the very high volatility) and a trailing stop to avoid a catastrophic loss. Remember that what goes up very hard and very fast can come down just the same way.

Weekly Forex Forecast – 23th to 27th March 2026 (Charts)

RBOB Gasoline Futures Daily Price Chart

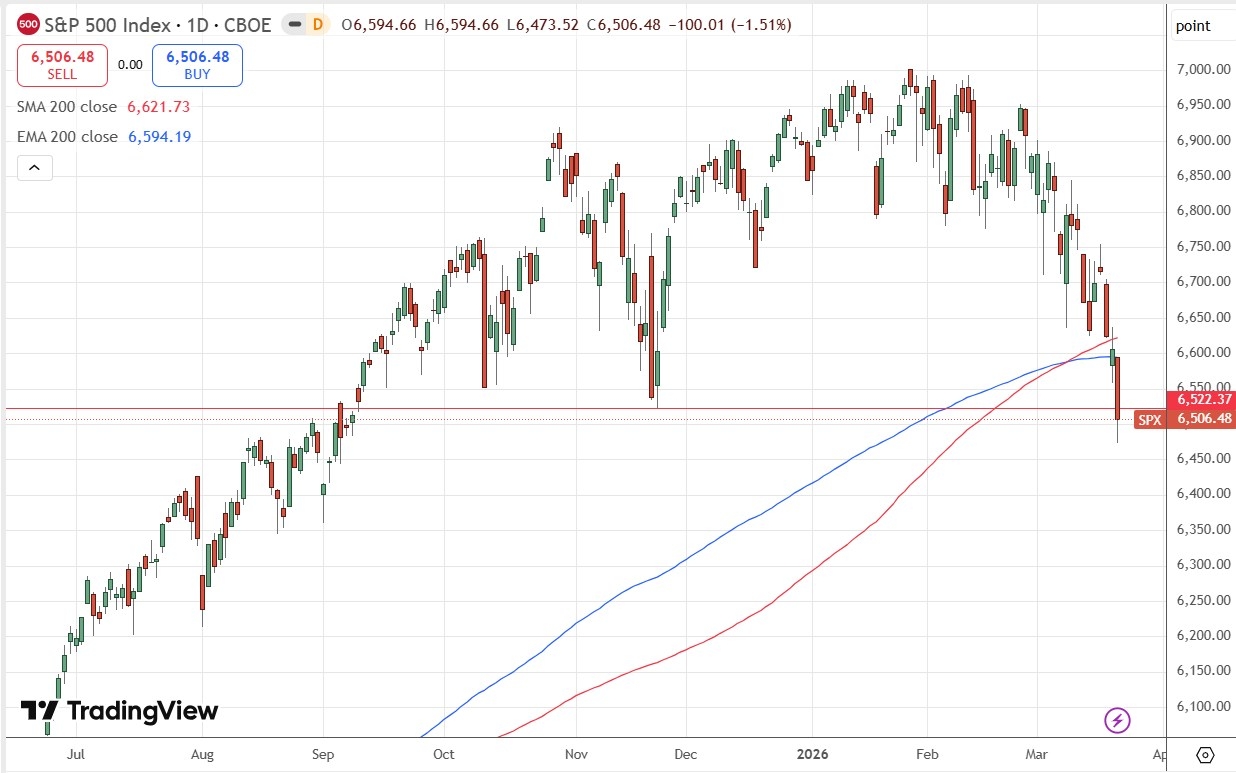
Last week was poor for the US stock market, with the S&P 500 Index falling quite heavily to reach a new 6-month low, with the daily chart closing below both the SMA 200 and the EMA 200. These are bearish signs, although it is worth pointing out that the market is not down by even 10% from its recent all-time high which it reached just a few weeks ago.

I was correct last week in saying that the price would quickly reach the significant round number at 6,500. What will be closely watched now is whether the price continues to descend below that. If it spends most of the coming week below 6,500 that will be a very bearish sign and point to further losses.

President Trump and Iran’s latest infrastructure threats are likely to further spook the market. Unless there is contrary news, I am sure this Index will open below 6,500 and probably lose some more ground on Monday.

The escalating war in the Middle East is not the only thing weighing on the stock market. It is also very over-extended and overbought and due a significant retracement, and the worrying war was easily enough to give that a tailwind.

Despite the bearish outlook, shorting the US stock market, especially an Index, is not easy, and should only be attempted by experienced traders. A bullish bounce over the coming week, or at least a consolidation and minor gain, is a possible outcome, as we are in a price area where you could expect long-term buyers to step in.

Weekly Forex Forecast – 23th to 27th March 2026 (Charts)

S&P 500 Index Daily Price Chart

I see the best trades this week as:

  1. Long of the USD/JPY currency pair.

  2. Long of Brent Crude Oil but with ¼ of the normal position size.

  3. Long of Gasoline but with ¼ of the normal position size.

Source link

21 03, 2026

Euro clings to bullish bias after hawkish ECB tone

By |2026-03-21T22:55:02+02:00March 21, 2026|Forex News, News|0 Comments

EUR/USD stays in a consolidation phase above 1.1550 after posting impressive gains on Thursday. Comments from policymakers could impact the pair’s action in the near term.

Euro Price This week

The table below shows the percentage change of Euro (EUR) against listed major currencies this week. Euro was the strongest against the US Dollar.

USD EUR GBP JPY CAD AUD NZD CHF
USD -1.30% -1.39% -0.76% -0.07% -1.32% -1.58% -0.16%
EUR 1.30% -0.07% 0.48% 1.24% -0.02% -0.29% 1.14%
GBP 1.39% 0.07% 0.68% 1.31% 0.06% -0.21% 1.28%
JPY 0.76% -0.48% -0.68% 0.72% -0.57% -0.80% 0.62%
CAD 0.07% -1.24% -1.31% -0.72% -1.30% -1.51% -0.09%
AUD 1.32% 0.02% -0.06% 0.57% 1.30% -0.27% 1.17%
NZD 1.58% 0.29% 0.21% 0.80% 1.51% 0.27% 1.41%
CHF 0.16% -1.14% -1.28% -0.62% 0.09% -1.17% -1.41%

The heat map shows percentage changes of major currencies against each other. The base currency is picked from the left column, while the quote currency is picked from the top row. For example, if you pick the Euro from the left column and move along the horizontal line to the US Dollar, the percentage change displayed in the box will represent EUR (base)/USD (quote).

Following Wednesday’s sharp decline, EUR/USD reversed its direction on Thursday and gained more than 1% on the day, supported by the European Central Bank’s relatively hawkish guidance.

The ECB left policy settings unchanged, as anticipated, after the March meeting. “The war in the Middle East has made outlook significantly more uncertain, creating upside risks for inflation and downside risks for economic growth,” the ECB noted in its policy statement.

In the post-meeting press conference, ECB President Christine Lagarde acknowledged that a prolonged war could increase energy prices for longer and erode incomes. Lagarde further added that risks to inflation are tilted to the upside in the near term and said that they could have a “temporary, targeted and tailored” response to the energy shock.

Early Friday, ECB policymaker Joachim Nagel argued that the ECB would need to raise rates in April if the price outlook sours. On a more neutral note, policymaker José Luis Escrivá said that the situation is highly uncertain and volatile, adding that they must continues to assess a wealth of information before taking a policy step.

The economic calendar will not feature any high-tier data releases on Friday. Hence, investors will continue to pay close attention to comments from policymakers.

In case ECB officials voice their willingness to consider policy-tightening in response to rising inflation, the Euro could preserve its strength.

EUR/USD Technical Analysis:

In the 4-hours chart, EUR/USD trades at 1.1576. The near-term bias is mildly bullish as price holds above the 20-period Simple Moving Average (SMA) at 1.1522 and the 50-period SMA near 1.1528, while remaining below the declining 100- and 200-period SMAs around 1.1600 and 1.1715, respectively. This alignment suggests a recovery phase within a broader downside context, with the recent push away from the lower Bollinger Band toward the mid-band reinforcing improving momentum. The Relative Strength Index (RSI) at 59.7 stays above the 50 line, signaling steady bullish pressure without overbought conditions.

Immediate support is seen at 1.1530 (static level), reinforced by the nearby 20- and 50-period SMA, with a deeper floor at 1.1500 (round level) ahead of 1.1460 (static level) if sellers regain control. On the upside, initial resistance comes at 1.1600 (100-period SMA, upper line of the Bollinger Band) ahead of the horizontal barrier near 1.1670 and the 200-period SMA at 1.1715.

(The technical analysis of this story was written with the help of an AI tool.)

Euro FAQs

The Euro is the currency for the 20 European Union countries that belong to the Eurozone. It is the second most heavily traded currency in the world behind the US Dollar. In 2022, it accounted for 31% of all foreign exchange transactions, with an average daily turnover of over $2.2 trillion a day.
EUR/USD is the most heavily traded currency pair in the world, accounting for an estimated 30% off all transactions, followed by EUR/JPY (4%), EUR/GBP (3%) and EUR/AUD (2%).

The European Central Bank (ECB) in Frankfurt, Germany, is the reserve bank for the Eurozone. The ECB sets interest rates and manages monetary policy.
The ECB’s primary mandate is to maintain price stability, which means either controlling inflation or stimulating growth. Its primary tool is the raising or lowering of interest rates. Relatively high interest rates – or the expectation of higher rates – will usually benefit the Euro and vice versa.
The ECB Governing Council makes monetary policy decisions at meetings held eight times a year. Decisions are made by heads of the Eurozone national banks and six permanent members, including the President of the ECB, Christine Lagarde.

Eurozone inflation data, measured by the Harmonized Index of Consumer Prices (HICP), is an important econometric for the Euro. If inflation rises more than expected, especially if above the ECB’s 2% target, it obliges the ECB to raise interest rates to bring it back under control.
Relatively high interest rates compared to its counterparts will usually benefit the Euro, as it makes the region more attractive as a place for global investors to park their money.

Data releases gauge the health of the economy and can impact on the Euro. Indicators such as GDP, Manufacturing and Services PMIs, employment, and consumer sentiment surveys can all influence the direction of the single currency.
A strong economy is good for the Euro. Not only does it attract more foreign investment but it may encourage the ECB to put up interest rates, which will directly strengthen the Euro. Otherwise, if economic data is weak, the Euro is likely to fall.
Economic data for the four largest economies in the euro area (Germany, France, Italy and Spain) are especially significant, as they account for 75% of the Eurozone’s economy.

Another significant data release for the Euro is the Trade Balance. This indicator measures the difference between what a country earns from its exports and what it spends on imports over a given period.
If a country produces highly sought after exports then its currency will gain in value purely from the extra demand created from foreign buyers seeking to purchase these goods. Therefore, a positive net Trade Balance strengthens a currency and vice versa for a negative balance.

Source link

21 03, 2026

USD/JPY Analysis 20/03: 160 Remains Major Ceiling

By |2026-03-21T02:49:20+02:00March 21, 2026|Forex News, News|0 Comments

  • The 160-yen level is a large figure in the USD/JPY pair at the moment that a lot of people will be watching. If it were to get broken – it would be a big deal.

  • So far, it is proving very tough.

The US dollar plunged against the Japanese yen during trading on Thursday as we can see the 160-yen level is still being defended. The 160-yen level is a large, round, psychologically significant figure that a lot of people will be watching because if we could break above there, then we could really start to challenge somewhere near the 160.40-yen level a breakout and a move that tops the highs all the way back to 1990.

With that being the case, I think you have to be very cautious, but you also have to understand that this is a market that will continue to be very noisy.

Interest Rates and Central Bank Divergence

We just had the Federal Reserve come out and sound pretty hawkish and at the same time, we have the Bank of Japan basically doing nothing but suggesting that perhaps we will continue to see very easy rates coming out of Japan.

I just don’t see a situation where this changes, but obviously there was a bit of a reaction to the chatter coming out of Japan. I think this is temporary and I do believe that we will end up seeing a little bit of a bounce.

I like the idea of buying a bounce, but I need to see a little bit of a V-pattern on shorter-term charts to get involved. I’m looking at the 158-yen level as a major support level but even if we break down below there, I think we’re looking at the 156 level as a floor.

I am looking for opportunities. I do believe that it will end up being offered here, but it is going to be noisy. After all we don’t break a 36-year high easily very often, so a little bit of a pullback and another surge higher make quite a bit of sense.

Want to trade our USD/JPY forex analysis and predictions? Here’s a list of forex brokers in Japan to check out.

Christopher Lewis has been trading Forex and has over 20 years experience in financial markets. Chris has been a regular contributor to Daily Forex since the early days of the site. He writes about Forex for several online publications, including FX Empire, Investing.com, and his own site, aptly named The Trader Guy. Chris favours technical analysis methods to identify his trades and likes to trade equity indices and commodities as well as Forex. He favours a longer-term trading style, and his trades often last for days or weeks.

Source link

Go to Top