rises to a 10-week high even as the UK jobs market slows. slips after mixed data and amid caution ahead of the tomorrow.
GBP/USD Rises to a 10-Week High Even as UK Jobs Market Slows
- UK unemployment stays at 4.7% and wage growth slows
- US falls ahead of the Fed rate decision tomorrow
- GBP/USD rises above 1.36
GBP/USD has risen to a 10-week high ahead of the BoE – Fed rate divergence, and even after UK jobs data point to a slowing labour market.
Data today showed that the UK job market slowed again, with the number of workers on payrolls falling for a seventh straight month, and the remained at 4.7% its highest since the second quarter of 2021—however, the number of vacancies improved from last month’s 4-year low. Wage growth eased to 4.7%, which is still too high to be consistent with an inflation rate of 2%.
The data today won’t do too much to alleviate the Bank of England’s concerns over the upside risk to inflation. UK data is due tomorrow and is expected to rise to 3.9% amid a stagflationary outlook.
The central bank is expected to leave rates up 4% in Thursday’s meeting. Given sticky inflation and concerns over the chancellor’s budget in late December, the Bank of England may not until early next year.
This is in contrast to the Federal Reserve, which kicks off its two-day meeting today and is expected to reduce rates by 25 basis points in the right announcement tomorrow. The decision comes amid signs of weakness in the US labour market and as inflation sits at 2.9%. The question here is how dovish will the Fed be? The market is pricing in almost three rate cuts before the end of the year, while the Fed guided for two.
US data is due today and is expected to ease to 0.3% from 0.5%. Weaker-than-forecast data could unnerve investors, pulling the lower.
GBP/USD Forecast – Technical Analysis
GBP/USD has extended its recovery from the 1.3140 August double bottom low, rising above the 50 SMA, the falling trendline, and the 1.36 August high, which, together with the RSI above 50, keeps buyers hopeful of further upside.
Buyers will look to extend gains towards 1.37, the round number, and 1.3790, the 2025 high.
Support is seen at 1.36, and 1.3480, the falling trendline support. Below here, 1.3430 comes into play, and 1.3350.
DAX Slips After Mixed ZEW Survey Data
- German ZEW economic sentiment rises & current situation falls
- Banks fall in a cautious mood ahead of the Fed decision
- DAX consolidates in a tight range
European stocks are slipping lower on Tuesday, giving back some of yesterday’s gains and pulled down by banks as investors show signs of caution ahead of the Federal Reserve interest rate decision on Wednesday.
The Fed is expected to reduce rates by 25 basis points as the central bank looks to support the weakening labour market even as remains above target.
On the data front, defied Expectations by rising to 37.3 in September, up from 34.7. Economists had expected a decline to 27.3. This points to investor morale improving in a sign that financial analysts are optimistic about the outlook.
However, the current situation was worse than feared, falling to -76.4 down from -68.6. This was worse than the -75 that the mark that economists and forecast. This reflects uncertainty surrounding the risks around US tariff policies and Germany’s autumn of reforms.
DAX Forecast – Technical Analysis
After falling away from its record high, the DAX is consolidating in a tight range below its multi-month rising trendline resistance around 23,700. The RSI below 50 suggests that momentum is slowly fading.
Sellers need to break below the 23,500 support zone, the September low, and 23,400, the August low, to open the door to 23,000, the June low.
On the upside, a rise above the 24,000 resistance zone and the 50 SMA opens the door to 24,540 and fresh record highs.
Original Post


")

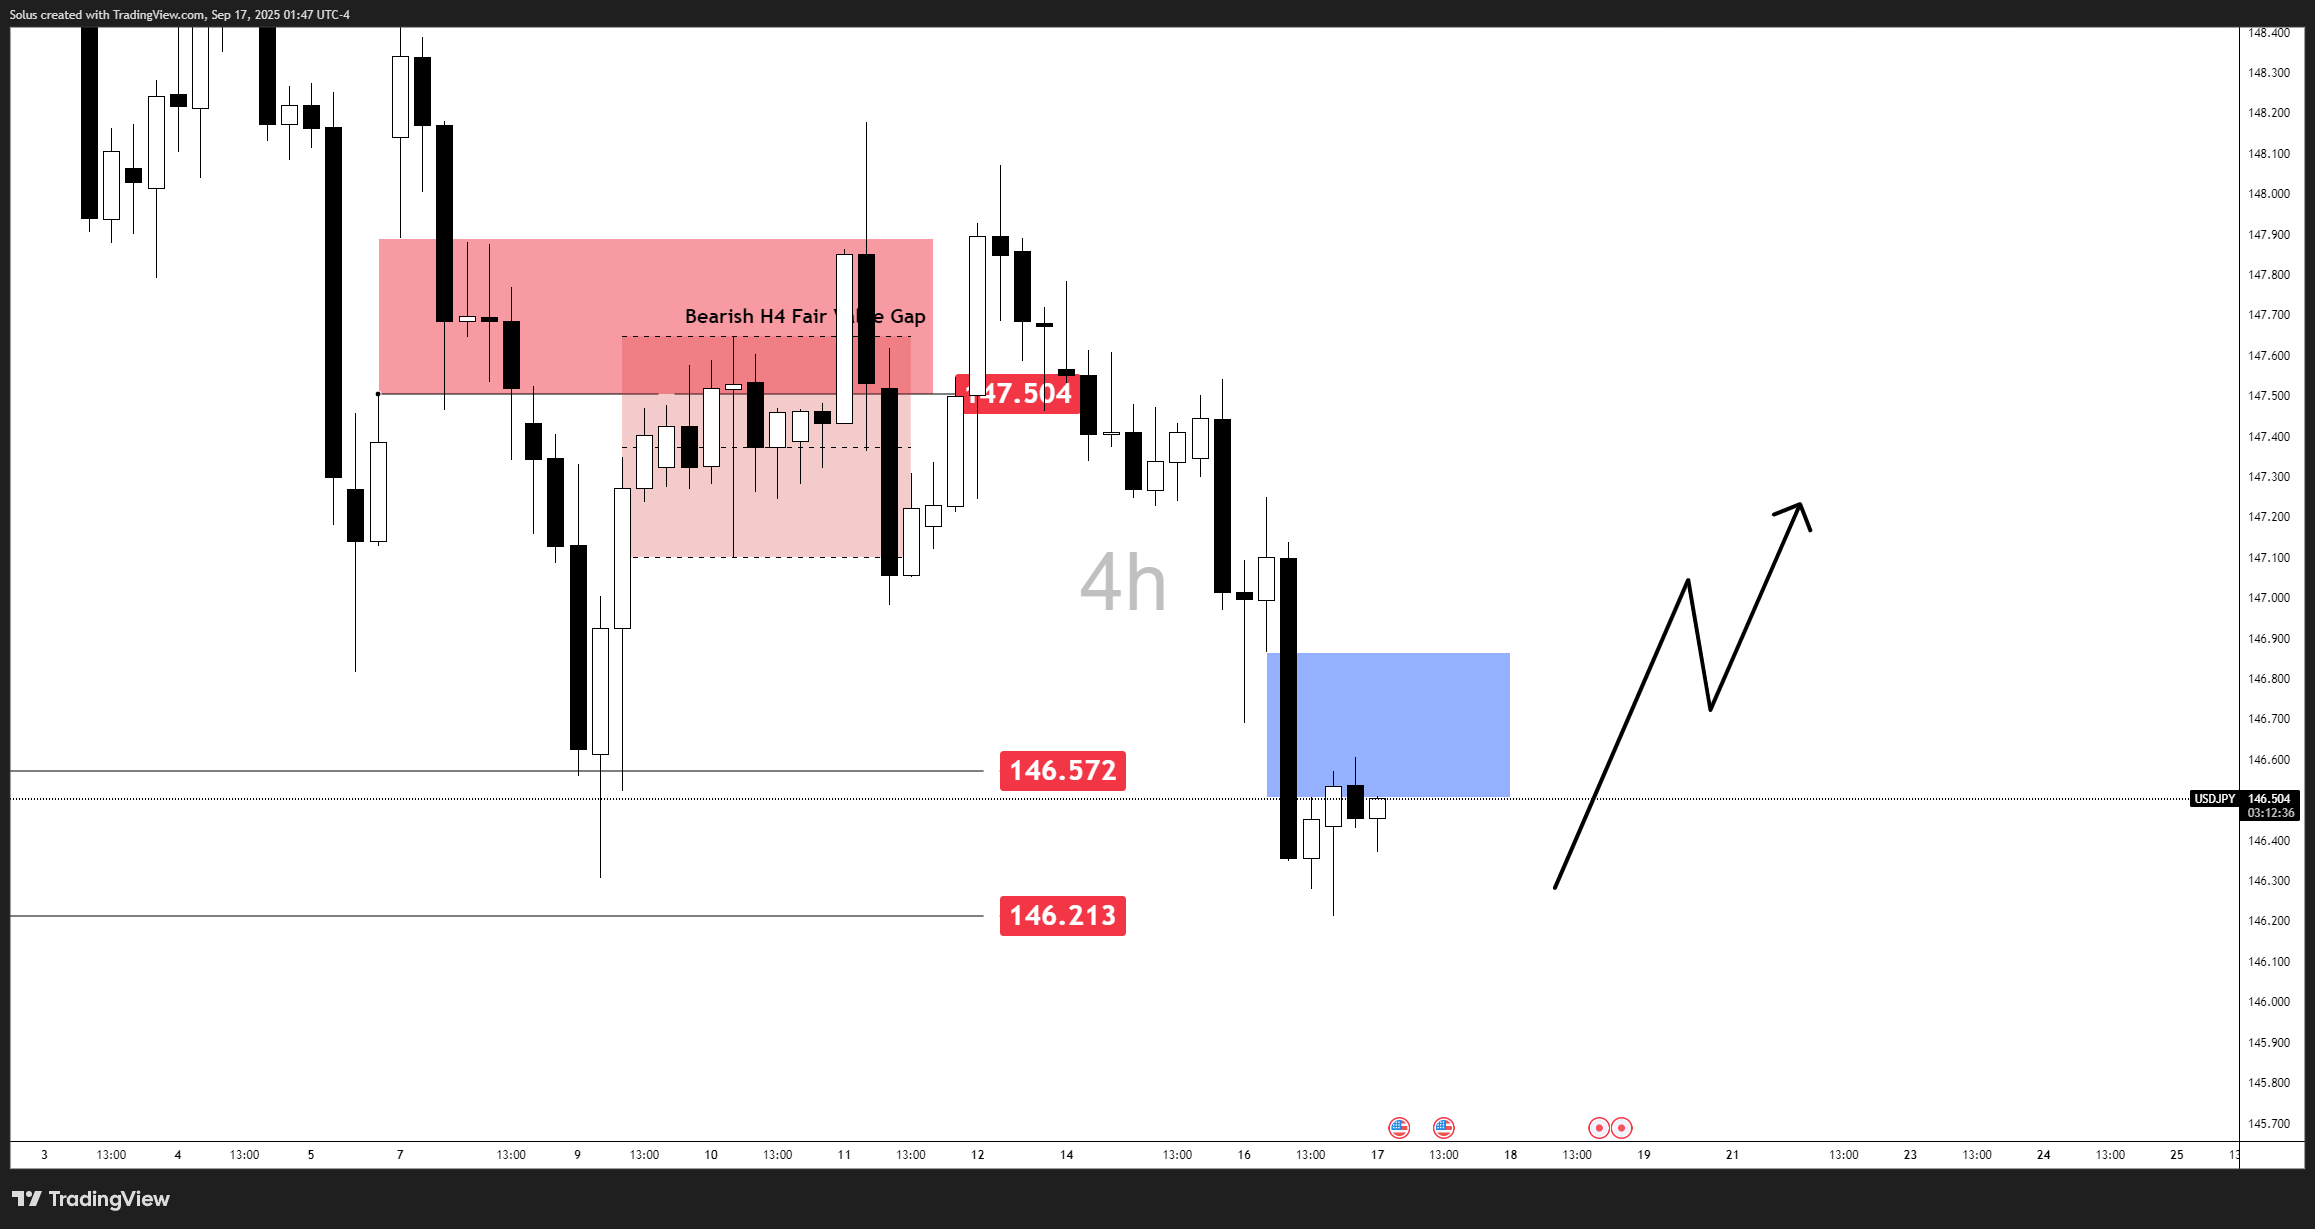
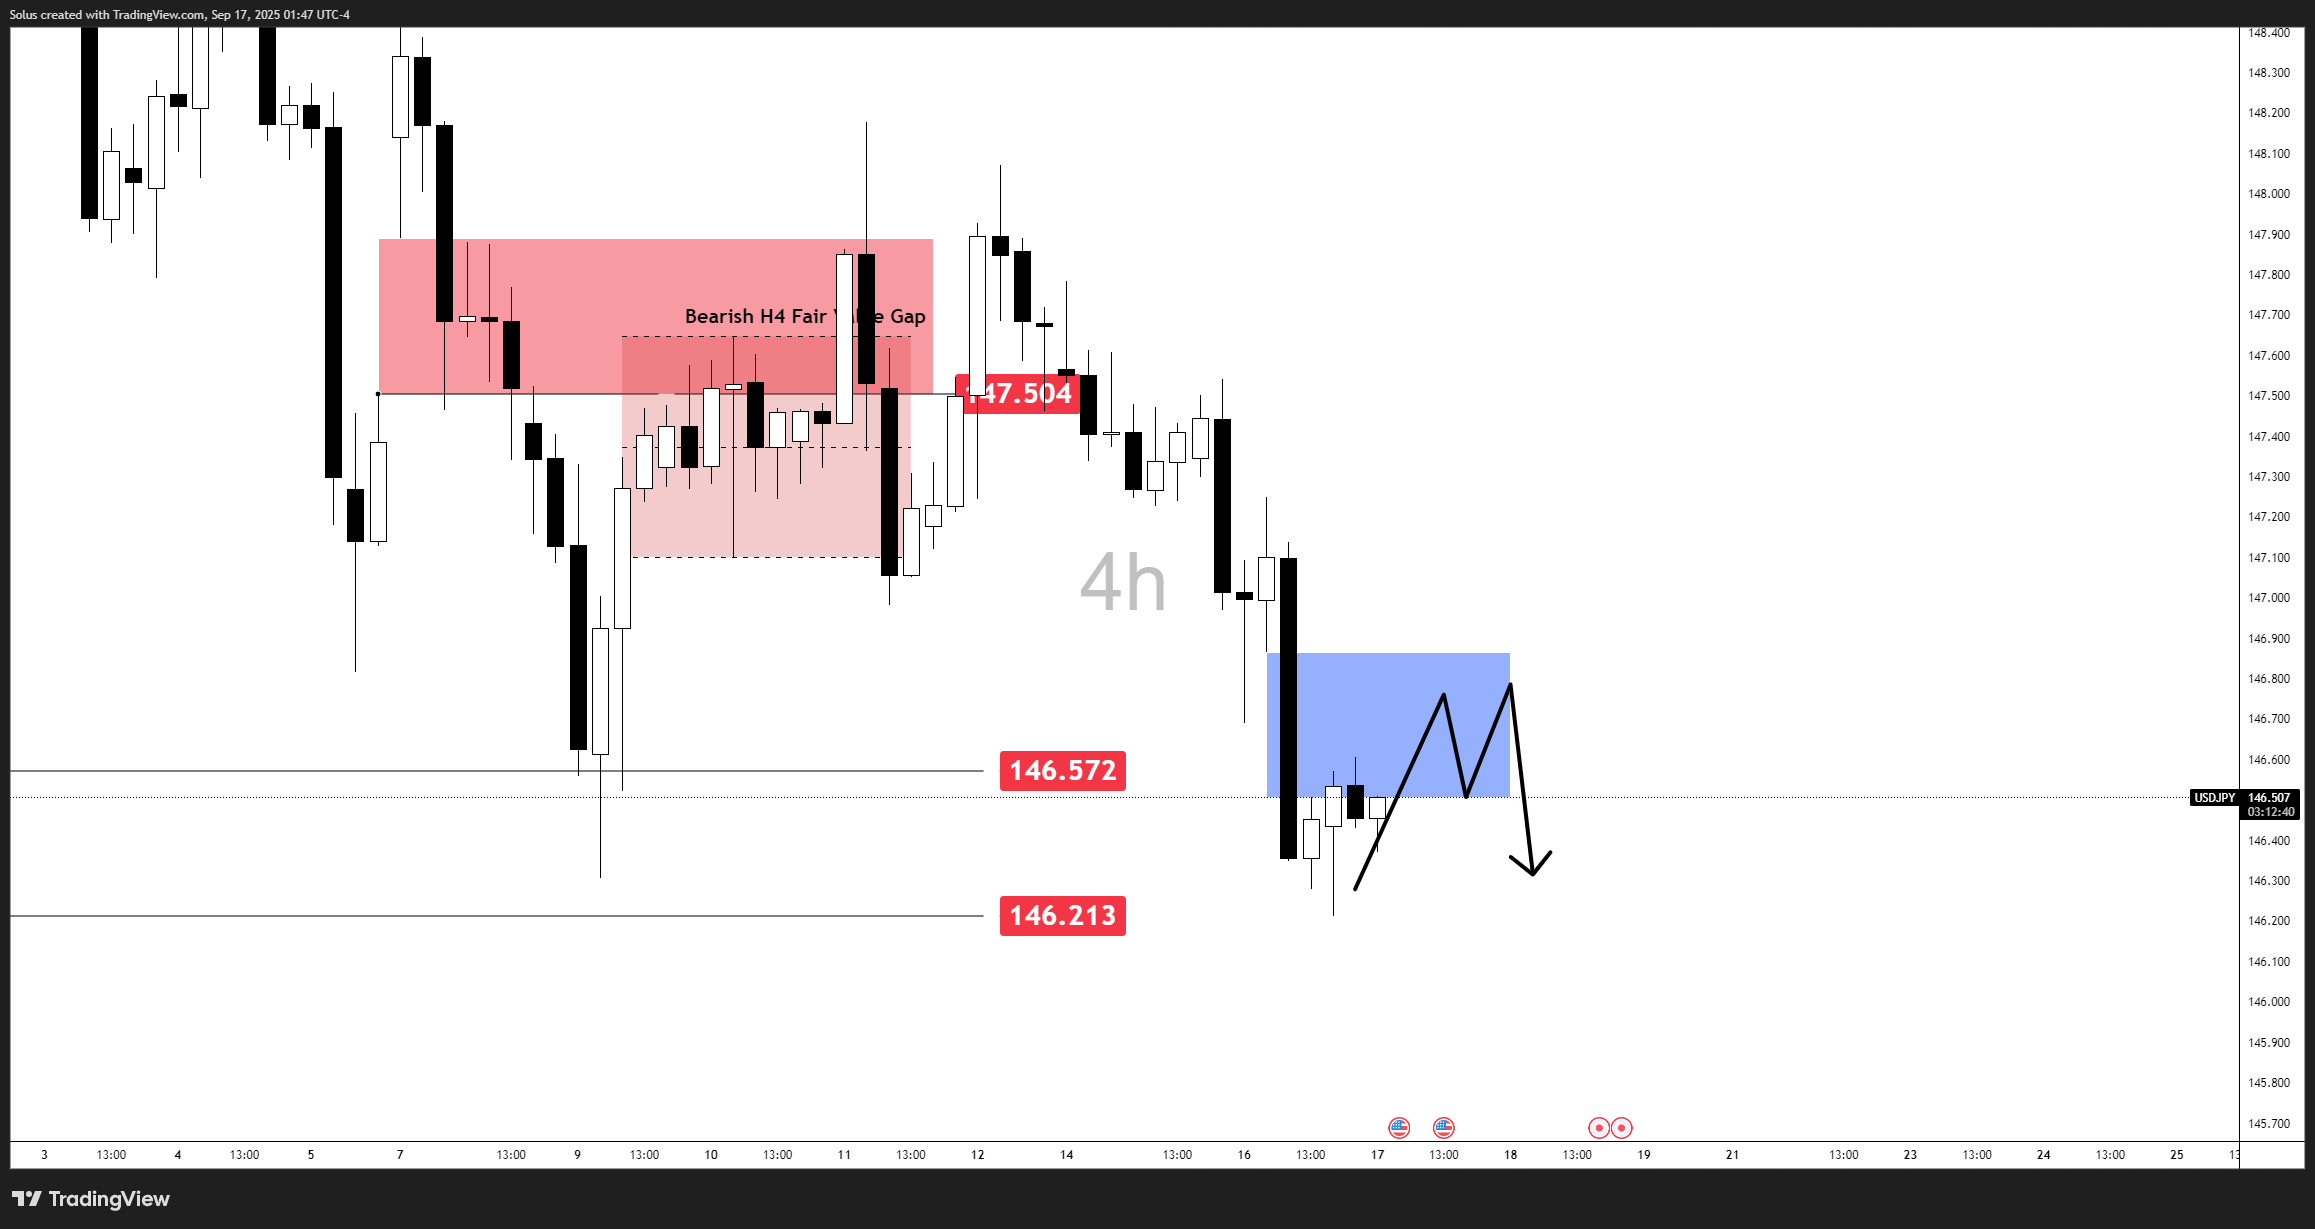
![Rate gap narrows as Fed cuts [Video]](https://editorial.fxsstatic.com/miscelaneous/USDJPY_2025-09-17_13-46-23_d5e79-1758092539963-1758092539964.png "Rate gap narrows as Fed cuts [Video]")
")


