The main tag of Forex News Today Articles.
You can use the search box below to find what you need.
[wd_asp id=1]

4 07, 2026

EUR/USD Forecast: Can the US Dollar recover momentum after the latest hiccups?

By |2026-07-04T07:30:51+03:00July 4, 2026|Forex News, News|0 Comments

The EUR/USD pair trimmed part of its recent losses and settled around 1.1450 as demand for the US Dollar (USD) cooled down. On the one hand, easing concerns about the Middle East war and its consequences pushed investors away from the USD’s safety. On the other hand, tepid American data weighed on the local currency. At the end, the odds of interest rate hikes in the United States (US) dropped, making it easier for speculative interest to push the Greenback lower.

Middle East and Oil Price

Markets kicked off the week in a cautious mood amid headlines indicating some tit-for-tat attacks between the US and Iran over the weekend. The fragility of the ceasefire, however, is no news to the world and investors, while ships keep transiting the Strait of Hormuz.

Physical and verbal skirmishes continue, but as long as Oil prices come down, it seems market players are far from concerned about the war. And it has its logic: lower Oil prices mean easing inflationary pressures and, hence, decreased odds for economic turmoil. In the US, it also means that the Federal Reserve (Fed) may not need to hike interest rates.

By the end of the week, the barrels of Brent and West Texas Intermediate (WTI) crude trade at pre-war levels, reflecting the ‘normalization’ of vessels’ traffic through the critical sea passage. It seems that as long as the Strait is open, market participants will bet against mounting risk and hence move into higher-yielding assets.

As a note of color, there has been no clear progress in negotiations between the US and Iran, and Pakistani mediators were just able to inform that the next meeting between the two countries will be scheduled “at the earliest possible time.” Tehran is now focused on a massive funeral for the former Supreme Leader, Ayatollah Ali Khamenei, who was killed at the beginning of the war on February 28. His funeral will last until July 9, and talks are unlikely to resume before that date.

Cautious yet confident European authorities

European Central Bank (ECB) President Christine Lagarde started the week praising Europe’s resilience, noting it means rate hike effects on the economy are more contained, and that the ECB “can raise rates to address inflation without fear it becomes a source of financial stress.” Lagarde later noted that risks are more broadly balanced “than a few weeks ago” and that the European Union (EU) is not in stagflation, while speaking at a policy panel at the ECB Forum on Central Banking 2026 that took place in Sintra, Portugal.

Data somehow backed her words, as annual inflation in Germany, as measured by the change in the Consumer Price Index (CPI), softened to 2.3% in June, according to preliminary estimates, from 2.6% in May. The Harmonized Index of Consumer Prices (HICP) in the same period printed at 2.4%, down from the 2.7% posted in the previous month.

The preliminary estimate of the Euro area annual HICP came in at 2.8% in June, below the previous reading of 3.2% and lower than the anticipated 3%. Finally, the core annual HICP printed at 2.4%, lower than the prior 2.6%.

As Middle East tensions eased and inflation cooled, the odds for additional interest rate hikes in the Eurozone decreased, with market players now looking for a prolonged hold.

United States Federal Reserve

The US macroeconomic calendar revolved around employment, and news were not good. The ADP Employment Change report showed that the private sector added 98K new jobs in June, below the previous 122K. Also, US-based employers announced 45,849 job cuts in June, down 53% from the 97,006 cuts announced in May, according to the Challenger Job Cuts report. The big miss came from the Nonfarm Payrolls (NFP) report released on Thursday, as the country added a measly 57K new jobs in June vs the anticipated 110K and the previous May reading of 129K (downwardly revised from 172K). The report also showed that the Unemployment Rate declined to 4.2% from 4.3%.

Other than employment data, the country released the June ISM Manufacturing Purchasing Managers’ Index (PMI), which printed at 53.3, below the 54 expected but still indicating business expansion for the sixth consecutive month. The Price sub-index edged sharply lower, from the 82.1 posted in May to 73, a sign of easing inflationary pressures.

Meanwhile, Fed Chair Kevin Warsh participated in the ECB Central Banking forum and delivered some interesting comments. He reiterated that forward guidance is not in his book and that the focus is on price stability. US policymakers will decide on rates in four weeks’ time, according to Warsh. “When we get into that room and shut the door, we’re going to have a good debate,” Warsh added.

A softer labor market, easing inflationary pressures, and the absence of any other clues on future monetary policy played against the Greenback, with odds of a rate hike edging sharply lower after the release of the NFP report.

What’s next in the docket

The new week starts with the EU releasing May Retail Sales and the US delivering the June ISM Services PMI. The Federal Open Market Committee (FOMC) will unveil the Minutes of the latest meeting on Wednesday, while Germany will publish the final estimate of the June HICP on Friday. The calendar also includes some other figures that could provide clues on the actual health of major economies.

Also, as central banks’ decisions are now one month away, policymakers from both shores of the Atlantic will hit the wires, and their words will be scrutinized in search of monetary policy clues.

EUR/USD Technical Outlook:

The weekly recovery is far from changing the EUR/USD pair’s technical picture, which still shows that bears are in control. Furthermore, the advance met sellers around a long-term static resistance area near 1.1470, which is also an inflection point. As long as it is clearly below it, the odds are on sellers’ side.

Chart Analysis EUR/USD

In the daily chart, EUR/USD maintains a bearish near-term bias as spot holds below the 20-day, 100-day and 200-day Simple Moving Averages (SMAs) at 1.1470, 1.1623 and 1.1654, respectively. The Momentum indicator lacks directional strength but holds below its midline, while the Relative Strength Index (RSI) indicator hovers around 43, suggesting downside pressure persists but has lost strength. Still, the moving averages setup is likely to contain attempts to advance further while suggesting lower lows are still possible.

Bigger time frames also reflect sellers’ dominance, as in the weekly chart, EUR/USD maintains a bearish bias. The pair develops far above the 100- and 200-week SMAs at roughly 1.1296 and 1.1001, but remains capped by the 20-week SMA at 1.1611. The pair’s slide from recent highs, together with a 14-week RSI hovering near 42 and a negative 14-week Momentum reading, tilts risks toward further consolidation while leaving the door open for additional slides.

On the topside, initial resistance is at the 1.1470 area, reinforced by the 20-day SMA near it. The next significant resistance comes in a handful of pips above 1.1600, with the 100-day SMA around 1.1623 and the 200-day SMA at 1.1650. The EUR/USD would need to clearly break above this area to ease the broader bearish tone. The recent multi-week low at 1.1324 is the immediate support, closely followed by the 100-week SMA at 1.1296. An extension below the latter exposes the psychological 1.1000 threshold.

(The technical analysis of this story was written with the help of an AI tool.)

Source link

4 07, 2026

EUR/GBP Technical Outlook: Forex Analysis for the Euro-Sterling Pair

By |2026-07-04T03:29:39+03:00July 4, 2026|Forex News, News|0 Comments

Intraday bias in EUR/GBP stays on the downside at this point. Fall from 0.8863 should target 61.8% retracement of 0.8221 to 0.8863 at 0.8466 at next. On the upside, above 0.8601 minor resistance will turn bias neutral first. But risk will stay on the downside as long as 0.8686 resistance holds, in case of recovery.

In the bigger picture, current development suggests that rise from 0.8221 (2024 low) has completed at 0.8863, just ahead of 38.2% retracement of 0.8221 (2024 low) to 0.8863 (2025 high) at 0.8618. Deeper fall would be seen back to 0.8201 (2022 low). For now, outlook will be neutral at beast as long as 0.8863 hold.

EUR/GBP Technical Outlook: Forex Analysis for the Euro-Sterling Pair

Source link

3 07, 2026

GBP/USD: Elliott Wave Analysis and Forecast for 03.07.26–10.07.26

By |2026-07-03T23:28:42+03:00July 3, 2026|Forex News, News|0 Comments

The article covers the following subjects:

Major Takeaways

  • Main scenario: Once the correction is completed, consider short positions below the level of 1.3467 with a target of 1.3050–1.2936. A sell signal: the correction ends and the price holds below 1.3467. Stop Loss: above 1.3510, Take Profit: 1.3050–1.2936.
  • Alternative scenario: Breakout and consolidation above the level of 1.3467 will allow the pair to continue rising to the levels of 1.3660–1.3870. A buy signal: the level of 1.3467 is broken to the upside. Stop Loss: below 1.3425, Take Profit: 1.3660–1.3870.

Main Scenario

Consider short positions below 1.3467 with a target of 1.3050–1.2936 once the correction is completed.

Alternative Scenario

Breakout and consolidation above 1.3467 will allow the pair to continue rising to the levels of 1.3660–1.3870.

Analysis

On the weekly time frame, an ascending wave of larger degree (A) of B is developing. Within it, wave 1 of (A) has formed, and a downward correction has been completed as wave 2 of (A). The third wave 3 of (A) appears to be unfolding on the daily chart. Within it, wave i of 3 has formed, and bearish correction ii of 3 is developing. On the H4 time frame, wave (c) of ii is developing. Within it, wave iii of (c) has formed, and a local correction is unfolding as wave iv of (c). If the presumption is correct, GBP/USD will continue to decline to 1.3050–1.2936 after the correction is over. The level of 1.3467 is critical in this scenario as a breakout above it will enable the pair to continue rising to the levels of 1.3660–1.3870.


This forecast is based on the Elliott Wave Theory. When developing trading strategies, it is essential to consider fundamental factors, as the market situation can change at any time.

Price chart of GBPUSD in real time mode

The content of this article reflects the author’s opinion and does not necessarily reflect the official position of LiteFinance broker. The material published on this page is provided for informational purposes only and should not be considered as the provision of investment advice for the purposes of Directive 2014/65/EU.


According to copyright law, this article is considered intellectual property, which includes a prohibition on copying and distributing it without consent.

Rate this article:

{{value}} ( {{count}} {{title}} )


Source link

3 07, 2026

USD/JPY: Elliott Wave Analysis and Forecast for 03.07.26–10.07.26

By |2026-07-03T19:27:42+03:00July 3, 2026|Forex News, News|0 Comments

The article covers the following subjects:

Major Takeaways

  • Main scenario: Consider long positions from corrections above 159.83 with a target of 165.00–170.00. A buy signal: the price holds above 159.83. Stop Loss: below 159.30, Take Profit: 165.00–170.00.
  • Alternative scenario: Breakout and consolidation below 159.83 will allow the asset to continue declining to the levels of 158.90–158.00. A sell signal: the level of 159.83 is broken to the downside. Stop Loss: above 160.35, Take Profit: 158.90–158.00.

Main Scenario

Consider long positions from corrections above 159.83 with a target of 165.00–170.00.

Alternative Scenario

Breakout and consolidation below 159.83 will allow the pair to continue declining to the levels of 158.90–158.00.

Analysis

On the weekly time frame, an ascending third wave of larger degree 3 has formed, a downward correction has been completed as the fourth wave 4, and the fifth wave 5 is developing. On the daily chart, the third wave of smaller degree (3) of 5 appears to be developing, with wave 3 of (3) forming as its part. Wave i of 3 has formed on the H4 chart, and wave ii of 3 has presumably been completed as a local correction. If the presumption is correct, USD/JPY will continue to rise to 165.00–170.00 within wave iii of 3. The level of 159.83 is critical in this scenario as a breakout below it will enable the asset to continue declining to the levels of 158.90–158.00.


This forecast is based on the Elliott Wave Theory. When developing trading strategies, it is essential to consider fundamental factors, as the market situation can change at any time.

Price chart of USDJPY in real time mode

The content of this article reflects the author’s opinion and does not necessarily reflect the official position of LiteFinance broker. The material published on this page is provided for informational purposes only and should not be considered as the provision of investment advice for the purposes of Directive 2014/65/EU.


According to copyright law, this article is considered intellectual property, which includes a prohibition on copying and distributing it without consent.

Rate this article:

{{value}} ( {{count}} {{title}} )


Source link

3 07, 2026

Citi Euro To Dollar Forecast: EUR/USD Could Test 1.10, Say Analysts

By |2026-07-03T15:26:46+03:00July 3, 2026|Forex News, News|0 Comments

The Euro to Dollar (EUR/USD) exchange rate has recovered to around 1.1430 after rebounding from recent multi-month lows, although Citi believes the broader risks remain tilted to the downside.

Citi maintains its three-month EUR/USD forecast at 1.13 and expects the pair to trade around 1.14 over the following six to 12 months, with scope for only a gradual recovery.

The bank warns that EUR/USD “risks a move towards the 1.10 area” if US inflation remains sticky enough to keep markets pricing further Federal Reserve tightening, even if additional rate hikes are ultimately not delivered.

Citi also believes the European Central Bank could become less hawkish as commodity prices decline and the Middle East conflict continues to ease, opening the door to further scaling back of ECB tightening expectations.

Over the medium term, however, the bank expects some mean reversion once the US Dollar rally peaks. Citi argues that markets may eventually unwind overly aggressive Fed expectations, helping to limit further Dollar gains.

The bank also expects higher European defence spending to provide a gradual lift to economic growth, although it cautions that broader structural reforms are progressing only slowly.

While Citi remains cautious on EUR/USD in the near term, it believes a moderation in Dollar strength should allow the pair to stabilise around 1.14 over the longer horizon.

foreign exchange rates

Source link

3 07, 2026

GBP/JPY Price Forecast: Possible Japan intervention caps gains near 216.00

By |2026-07-03T11:26:01+03:00July 3, 2026|Forex News, News|0 Comments

GBP/JPY trades under pressure on Thursday as the Japanese Yen (JPY) strengthens across the board amid speculation that Japanese authorities may have intervened in the foreign exchange market after the Yen fell to a 40-year low against the US Dollar (USD) earlier this week.

At the time of writing, the cross is trading around 215, retreating from the two-month high of 216.08 touched during the Asian session.

According to Reuters, it was not immediately clear what drove the Yen’s sharp rebound, and Japan’s Ministry of Finance declined to comment. Some traders and strategists speculated that authorities had conducted a rate check.

Traders remain alert to the possibility of intervention by Japanese authorities. However, the downside in GBP/JPY could remain limited as investors continue to take advantage of Japan’s relatively low interest rates compared with other major economies, supporting carry trades. From a technical perspective, the broader trend also remains tilted to the upside.

Technical Analysis:

In the 4-hour chart, GBP/JPY holds a mildly bullish bias as it stays above the 100-period simple moving average (SMA) at 214.25 and the 200-period SMA at 214.19. The pair is also trading just over the horizontal support at 215, suggesting near-term demand on dips, while the Relative Strength Index (RSI) at 52 leans slightly positive and the Average Directional Index (ADX) at 31 hints at a moderately established trend rather than a volatile reversal phase.

On the topside, immediate resistance is seen at the horizontal barrier at 216, where a clear break would open the way for a continuation of the broader advance. On the downside, initial support is located at 215, followed by the clustered moving average zone between the 100-period SMA at 214.25 and the 200-period SMA at 214.19, before a deeper floor emerges at 213.

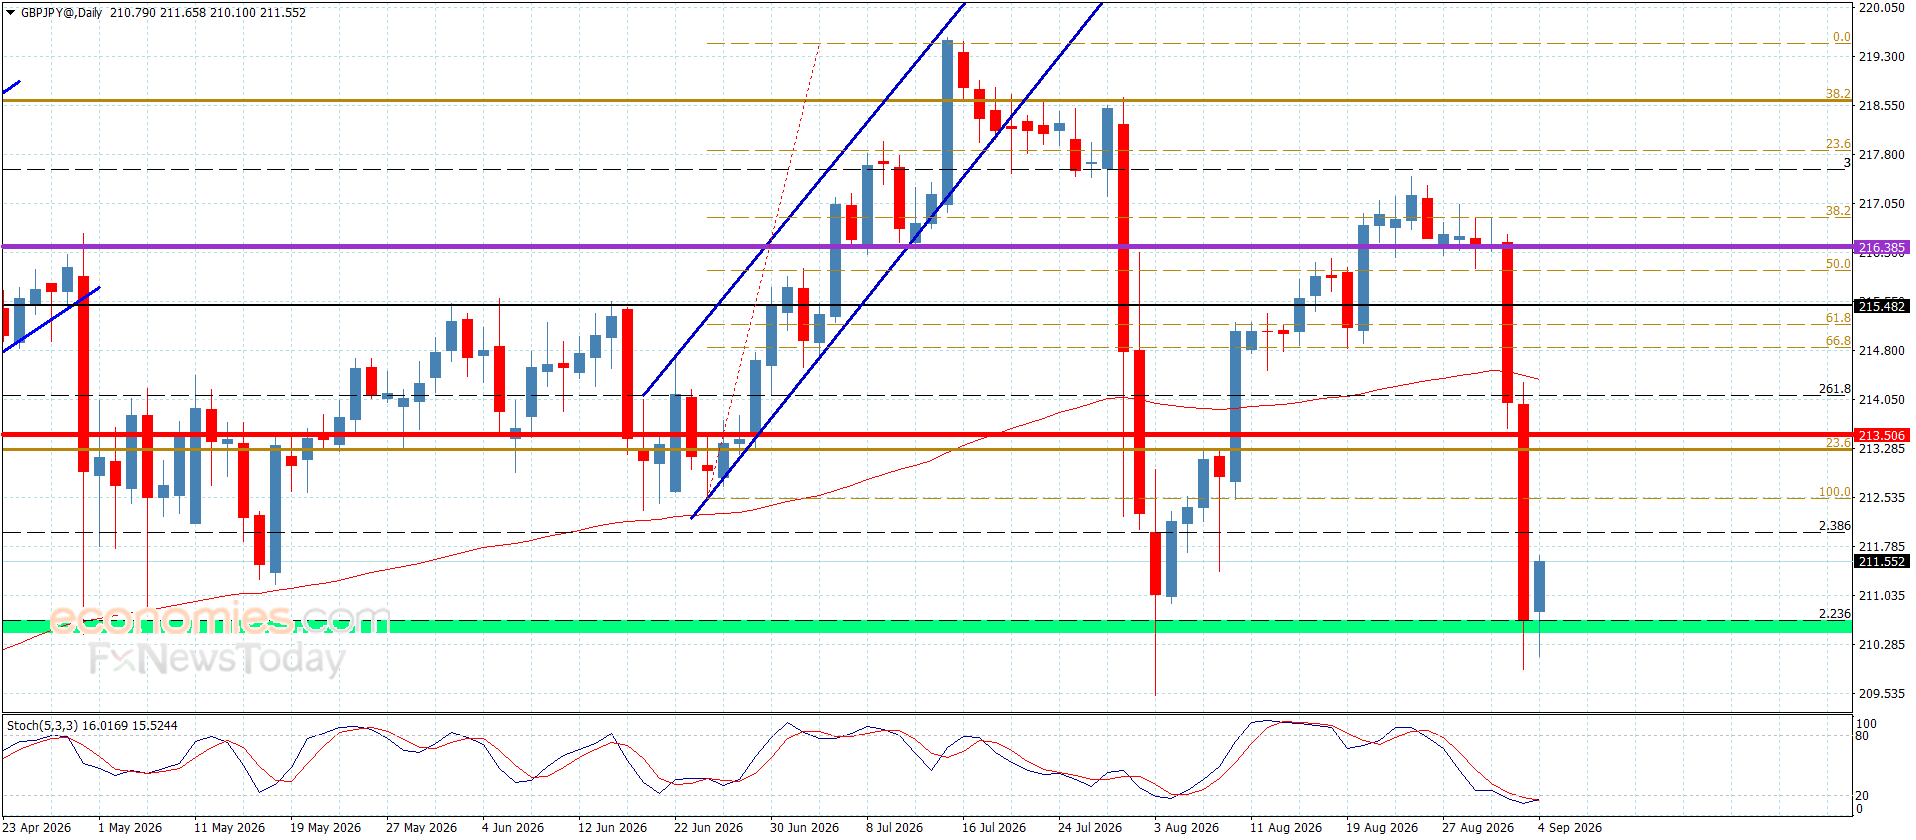
On the daily chart, GBP/JPY maintains a bullish near-term bias as it holds above both the 100-day and 200-day simple moving averages (SMAs) at 213.02 and 210.03 respectively. The pair is trading under the horizontal resistance at 216.00, while a mid-50s Relative Strength Index (RSI) suggests constructive momentum and the subdued Average Directional Index (ADX) around 13 hints at a trend that is firm but not strongly directional.

On the downside, initial support appears at 214.50, where a horizontal level underpins the latest advance, followed by the 100-day SMA at 213.02 and the 200-day SMA near 210.03. On the topside, a break above 216.00 would open the way for further gains, with the existing moving average structure reinforcing the broader supportive backdrop as long as price holds above 213.02.

(The technical analysis of this story was written with the help of an AI tool.)

Japanese Yen Price Today

The table below shows the percentage change of Japanese Yen (JPY) against listed major currencies today. Japanese Yen was the strongest against the Australian Dollar.

USD EUR GBP JPY CAD AUD NZD CHF
USD -0.23% -0.28% -0.68% -0.00% 0.05% -0.02% -0.35%
EUR 0.23% -0.06% -0.44% 0.21% 0.28% 0.23% -0.12%
GBP 0.28% 0.06% -0.39% 0.24% 0.33% 0.28% -0.07%
JPY 0.68% 0.44% 0.39% 0.66% 0.74% 0.64% 0.33%
CAD 0.00% -0.21% -0.24% -0.66% 0.06% 0.01% -0.34%
AUD -0.05% -0.28% -0.33% -0.74% -0.06% -0.05% -0.40%
NZD 0.02% -0.23% -0.28% -0.64% -0.01% 0.05% -0.35%
CHF 0.35% 0.12% 0.07% -0.33% 0.34% 0.40% 0.35%

The heat map shows percentage changes of major currencies against each other. The base currency is picked from the left column, while the quote currency is picked from the top row. For example, if you pick the Japanese Yen from the left column and move along the horizontal line to the US Dollar, the percentage change displayed in the box will represent JPY (base)/USD (quote).

Source link

3 07, 2026

GBP/USD Forecast: Pound Sterling Surges as Weak US Payrolls Sinks USD

By |2026-07-03T07:25:18+03:00July 3, 2026|Forex News, News|0 Comments


– Written by

The Pound to US Dollar (GBP/USD) exchange rate rallied strongly on Thursday after weaker-than-expected US labour market data sparked a broad selloff in the ‘Greenback’.

At the time of writing, GBP/USD was trading near $1.3360, up around 0.6% compared with Thursday’s opening levels.

The US Dollar (USD) came under heavy pressure on Thursday following the release of the latest US non-farm payrolls report from the Bureau of Labor Statistics, which pointed to a marked slowdown in hiring during June.

The US economy added only 57,000 jobs over the month, significantly below expectations for an increase of roughly 110,000 and representing the weakest payroll gain for several months.

The report also included downward revisions to employment figures for both April and May, reinforcing concerns that conditions in the US labour market are cooling faster than previously believed.

The disappointing data prompted investors to reassess the outlook for Federal Reserve policy, with market pricing for an interest rate increase before the end of the summer falling sharply from around 70% to close to 50% in the aftermath of the release.

The Pound (GBP) also traded with a firmer tone on Thursday as investors became increasingly confident that the UK’s political transition will be smoother than previously feared.

Save on Your GBP/USD Transfer

Get better rates and lower fees on your next international money transfer.
Compare TorFX with top UK banks in seconds and see how much you could save.


Compare the Best GBP/USD Rates »

With Andy Burnham expected to become the next Prime Minister without facing a leadership contest, markets have continued to unwind some of the political uncertainty that had weighed on Sterling in recent weeks.

Additional support came from Burnham’s repeated assurances that his government would continue to adhere to Labour’s existing fiscal framework, including commitments to balancing day-to-day public spending through tax receipts and reducing debt as a proportion of GDP over the longer term.

Near-Term GBP/USD Forecast: Bailey Comments in Focus

Looking ahead to Friday’s session, attention is likely to centre on a scheduled speech from Bank of England (BoE) Governor Andrew Bailey, which could provide fresh direction for the Pound to US Dollar (GBP/USD) exchange rate.

Bailey adopted a relatively hawkish stance earlier in the week, indicating that interest rate cuts are not currently under consideration while also warning that higher energy costs could yet feed through into inflation.

Should he reiterate this message, Sterling may be able to extend its recent gains.

For the US Dollar, however, volatility may be subdued heading into the weekend, with US financial markets closed in observance of the Independence Day holiday, resulting in lighter trading volumes.

Like this piece? Please share with your friends and colleagues:


International Money Transfer? Ask our resident FX expert a money transfer question or try John’s new, free, no-obligation personal service! ,where he helps every step of the way,
ensuring you get the best exchange rates on your currency requirements.

TAGS: Pound Dollar Forecasts

Source link

3 07, 2026

Japanese Yen Forecast: MUFG Says Fed Driving USD/JPY To 40-Year High

By |2026-07-03T03:23:40+03:00July 3, 2026|Forex News, News|0 Comments

USD/JPY Forecast: MUFG Sees Further Dollar Strength but Says Yen Recovery Risks Are Building

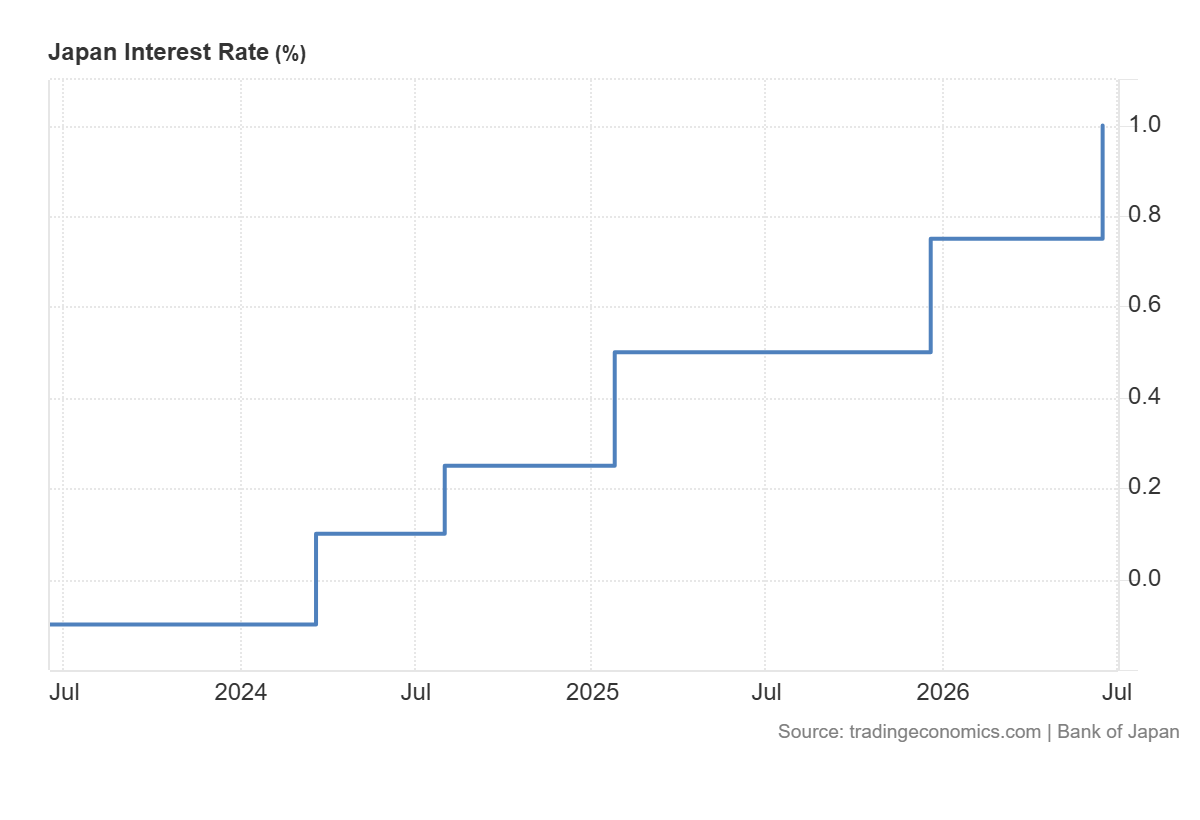
The Japanese Yen remains under pressure despite the Bank of Japan’s latest rate hike, with MUFG arguing that stronger US interest-rate expectations continue to dominate the currency outlook.

USD/JPY traded near 161.23 on Wednesday after briefly touching 162.84, its highest level since 1986, earlier this week. The pair has climbed almost 4% this year and more than **2% during June.

USD/JPY Statistics
USD/JPY 2026 High: 162.84
Highest level since: 1986

MUFG: Fed Driving Dollar, Not BoJ

MUFG says the Bank of Japan’s June rate hike to 1.00% reinforces the case for further tightening, but has not been enough to reverse Yen weakness.

“The BOJ raised the policy rate by 25bp to 1.00% and signaled a hawkish stance.”

The bank expects another BoJ rate increase could come as early as September as higher energy costs continue feeding into inflation.

However, MUFG argues that Fed policy remains the dominant driver.

foreign exchange rates

“We therefore expect continued dollar strength in the short term.”

The bank notes that markets are increasingly pricing another Fed rate hike this year after Chair Kevin Warsh’s hawkish June meeting.

Latest — Exchange Rates:
Dollar to Yen (USD/JPY): 161.2505 (-0.8%)
Euro to Dollar (EUR/USD): 1.1413 (+0.31%)
Pound to Dollar (GBP/USD): 1.33431 (+0.49%)

Yen Could Recover Later This Year

Despite its near-term bullish Dollar view, MUFG believes USD/JPY gains may not be sustainable.

“Dollar strength driven by Fed rate-hike expectations may therefore not last long.”

The bank argues that falling oil and gasoline prices could reduce inflation pressures in the US, allowing President Trump to renew pressure on the Federal Reserve to cut interest rates ahead of the midterm elections.

MUFG also notes that intervention concerns remain elevated after USD/JPY climbed to its highest level in around 40 years, suggesting Japanese authorities could become more active if Yen weakness accelerates again.

Source link

2 07, 2026

MUFG sees euro rallying to 1.20 against dollar by 2027 as ECB nears rate peak

By |2026-07-02T23:22:46+03:00July 2, 2026|Forex News, News|0 Comments

Rate spread dynamics are reasserting themselves as the dominant EUR/USD driver now that Middle East risk premium has largely unwound from oil prices. A narrowing gap between US and European yield expectations, as Fed hike pricing fades faster than ECB pricing, points to scope for the pair to grind higher through 2026 and into 2027. The bund curve has flattened alongside the drop in crude, with the 10-year yield already easing to reflect reduced inflation risk. Positioning around a potential final ECB insurance hike will be a key swing factor for European rates markets into year end.


MUFG forecasts EUR/USD recovering to 1.20 by Q1 2027, above consensus, as fading Fed hike bets and one final ECB insurance hike reshape the rate spread outlook.

Summary:

  • EUR/USD weakened from 1.1683 to 1.1422 in June, its longest stretch below 1.15 since June last year
  • The ECB raised its deposit rate 25bp to 2.25% in June, its first hike since September 2023
  • OIS pricing has fallen from close to three ECB hikes priced before June to roughly one now
  • ECB Chief Economist Philip Lane said the top of the neutral policy range had likely drifted to 2.50%
  • The 10-year German bund yield fell 8bps in June to 2.86% as crude oil declines eased inflation risk
  • EUR/USD is forecast to recover to 1.1600 by Q3 2026, 1.1800 by Q4 2026 and 1.2000 by Q1 2027, above consensus

The euro is set to claw back recent losses against the US dollar and climb to 1.20 by early 2027, according to MUFG, as fading expectations for further Federal Reserve tightening outpace the diminishing but still live prospect of one more European Central Bank rate hike. The euro weakened from 1.1683 to 1.1422 against the dollar in June, its longest run below the 1.15 level in over a year, after the ECB raised its deposit rate 25 basis points to 2.25%, its first increase since September 2023.

The rate move followed a rapid unwind of the geopolitical risk premium built into oil prices earlier this year. Brent crude has largely reversed its US-Iran conflict driven surge, easing energy pass through pressure on inflation faster than had been anticipated. Options market pricing has adjusted accordingly, with OIS markets shifting from pricing close to three ECB hikes before the June meeting to roughly one now.

Even so, a further insurance hike remains plausible. ECB Chief Economist Philip Lane has said the top of the neutral policy range likely drifted higher to 2.50%, suggesting a relatively low hurdle to one more move, while flagging that energy related inflation pass through risks could persist for some time. ECB President Christine Lagarde has separately argued the euro area economy has grown more resilient to external shocks, implying it could absorb a further hike if required.

With crude oil stabilising near current levels, MUFG expects rate spreads to reassert themselves as the dominant driver of EUR/USD, arguing that pricing for a Fed hike now looks less realistic than pricing for a final ECB move. That dynamic underpins the bank’s above consensus forecast profile, with EUR/USD seen rising to 1.1600 in the third quarter, 1.1800 by year end, and 1.2000 by the first quarter of 2027, a level it expects to hold into the following quarter. The 10-year German bund yield, which fell 8 basis points in June to 2.86%, is expected to ease further over the same period as inflation risks continue to recede.

Source link

2 07, 2026

The GBPJPY repeats the positive closes– Forecast today – 2-7-2026

By |2026-07-02T19:21:40+03:00July 2, 2026|Forex News, News|0 Comments

There is no change for Platinum price’s track by its stability within the minor bearish channel’s levels, depending on the stability of its resistance that is located at $1665.00, besides the main stability below $178000 barrier confirms the continuation of the previously suggested negativity, therefore, we will keep waiting for gathering extra negative momentum, allowing it to reach the initial target near $1510.00, and surpassing it will extend the trading directly towards $1480.00 and $1435.00.


While the price rally above $1780.00 and providing a positive close will force it to delay the negative moves, to provide a chances for achieving some gains by its rally towards $1810.00 and $1865.00.


The expected trading range for today is between $1510.00 and $1650.00


Trend forecast: Bearish


Source link

Go to Top