The main tag of Forex News Today Articles.
You can use the search box below to find what you need.
[wd_asp id=1]

5 08, 2026

Euro Forecast: EUR/USD Faces A Crucial Test At 1.1550

By |2026-08-05T22:55:11+03:00August 5, 2026|Forex News, News|0 Comments

Foreign exchange analysts at ING expect EUR/USD to edge below 1.1500 as the Dollar regains ground, although Scotiabank sees the Euro holding within a 1.1500–1.1600 range.

The Euro-to-Dollar exchange rate has climbed back towards 1.1550, but fx analysts at ING think the latest recovery may be running a little ahead of the rate backdrop.

EUR/USD traded around 1.1547 on Wednesday, up from 1.1507 at the start of the week and more than 1.5% above its late-July low.

ING’s short-term fair-value model suggests the pair is now “modestly overvalued”, by around 0.5% to 1%.

“It’s not a very strong directional signal,” the bank said, “but does endorse our perception that EUR/USD needs help from a favourable shift in short-term rate differentials… to take another leap higher.”

That help would probably need to come from weaker US labour data and renewed speculation that the Federal Reserve could adopt a less hawkish stance.

ING believes the Dollar is now more evenly positioned after last week’s sell-off and sees “room for some USD recovery in the next couple of days”.

“If position-squaring exacerbated the dollar selloff last week, we think further USD losses from here require a more compelling macro argument,” it said.

48hr Euro to Dollar exchange rate chart
Image: 48hr Euro to Dollar exchange rate chart

EUR/USD has recovered steadily over the past 48 hours, but resistance has emerged around the 1.1550 area.

The bank expects attention to remain firmly on US employment releases. Unless ADP and payrolls point to a clearly weakening jobs market, ING doubts the Dollar will surrender much more ground.

“Our baseline for this week is for EUR/USD to edge back below 1.150 on a more supported USD,” it said.

Even so, ING is not looking for a full reversal of the Euro’s recent gains.

“Unless US jobs figures come in particularly hot, we don’t see a return to 1.140 in the near term.”

Near-Term EUR/USD Outlook: Scotiabank Sees a 1.1500–1.1600 Range

Scotiabank takes a slightly more constructive view of the Euro’s latest rebound.

The bank said EUR/USD was “extending its latest consolidation in the mid/lower 1.15 area”, with the final Eurozone services and composite PMIs offering “a fractional improvement on the preliminary prints”.

From a valuation perspective, Scotiabank sees little obvious imbalance.

“The EUR is trading in line with a narrow FV estimate tied to 2Y spreads between the US and Germany, offering little in terms of directional risk from a fundamental perspective,” it said.

The technical picture has improved, however.

“The EUR’s latest recovery has been important, delivering a clear bullish shift in momentum and a break of trend resistance with the push above the 50-day MA,” Scotiabank said.

EUR/USD 3-month candlestick chart
Image: EUR/USD 3-month candlestick chart

EUR/USD has moved back above its 20-day and 50-day moving averages after recovering from June’s low near 1.1330.

Scotiabank identifies near-term resistance around 1.1550, followed by the 200-day moving average near 1.1630, and expects the pair to trade between 1.1500 and 1.1600.

That leaves a fairly narrow battleground. ING sees a modest dip below 1.1500 if US data hold up, while Scotiabank thinks the improving trend should limit the downside unless the Dollar receives a much stronger macro boost.

Exchange Rates UK Research EUR/USD sentiment survey poll results for 2026, 2027 and 2028.
Image: Exchange Rates UK Research EUR/USD sentiment survey poll results for 2026, 2027 and 2028.

Source link

5 08, 2026

GBP/JPY Price Forecast: Bears test 200-day SMA after sharp selloff

By |2026-08-05T18:55:05+03:00August 5, 2026|Forex News, News|0 Comments

  • GBP/JPY edges higher as the Japanese Yen loses ground following its recent sharp rally.
  • MUFG says coordinated intervention may support the Yen temporarily but cannot reverse its broader weakness without a change in fundamentals.
  • The cross holds below the 100-day SMA and tests the 200-day SMA, keeping the near-term outlook bearish.

GBP/JPY on Tuesday as the Japanese Yen (JPY) gives back part of its recent rally, which was driven by coordinated intervention from Tokyo and Washington.

At the time of writing, the cross trades around 211.55, up 0.20% on the day.

TMGM Analysis: Financial Market News, Economic Calendar & Market Insights

Yen support from US intervention seen as limited and time-buying

Analysts at MUFG/BTMU argue that the recent bout of joint FX intervention offers only partial and temporary relief for the Yen. They stress that, “on balance, we expect US intervention to support the yen to remain relatively small in scale,” even if coordinated action with Japan helps steady the currency in the near term. In their view, “while joint intervention may prove more effective at helping to provide support for the yen in the near-term, we still believe that it can only buy time.” MUFG/BTMU conclude that, ultimately, “there will need to be a change in fundamentals as well to encourage a sustainable reversal of the yen weakening trend that has been in place over the last five years.”

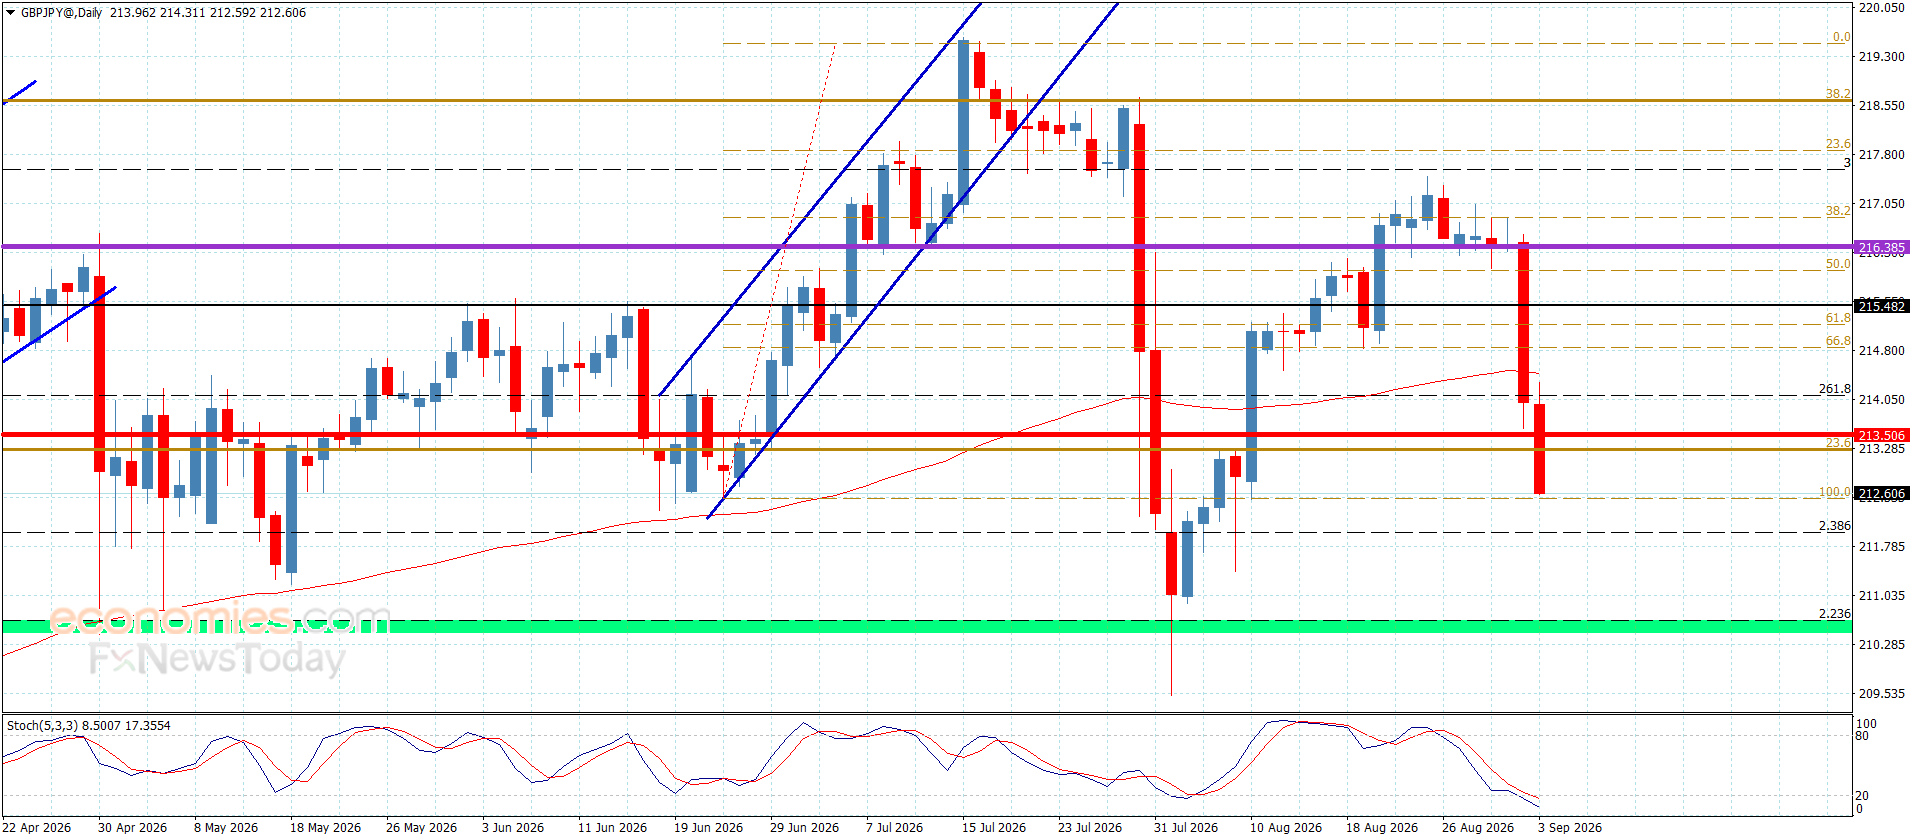
Despite Tuesday’s rebound, the near-term technical picture for GBP/JPY has turned bearish. The recent sell-off pushed the cross decisively below the 100-day Simple Moving Average (SMA) for the first time since April 2025, with the pair now testing the 200-day SMA.

Technical analysis

On the daily chart, GBP/JPY trades below the 100-day Simple Moving Average (SMA) at 214.45 and hovers around the 200-day SMA at 211.75, keeping the near-term bias tilted to the downside.

The Relative Strength Index (RSI) near 30 hints at oversold conditions and the Moving Average Convergence Divergence (MACD) remains deeply negative, reinforcing selling pressure.

On the topside, initial resistance is located at the 100-day SMA at 214.45, followed by the horizontal barrier at 216.50, with a stronger cap emerging near 220.

On the downside, the 200-day SMA at 211.75 marks first support ahead of the 210 level, with deeper floors at 207 and 205, where bears could start to lose momentum if the RSI slips further into oversold territory.

(The technical analysis of this story was written with the help of an AI tool. Know more.)

Japanese Yen Price Today

The table below shows the percentage change of Japanese Yen (JPY) against listed major currencies today. Japanese Yen was the strongest against the Canadian Dollar.

USD EUR GBP JPY CAD AUD NZD CHF
USD -0.06% -0.08% 0.14% 0.10% -0.44% -0.22% -0.15%
EUR 0.06% -0.04% 0.22% 0.15% -0.41% -0.19% -0.08%
GBP 0.08% 0.04% 0.28% 0.21% -0.35% -0.13% -0.04%
JPY -0.14% -0.22% -0.28% -0.06% -0.60% -0.41% -0.19%
CAD -0.10% -0.15% -0.21% 0.06% -0.54% -0.34% -0.24%
AUD 0.44% 0.41% 0.35% 0.60% 0.54% 0.22% 0.30%
NZD 0.22% 0.19% 0.13% 0.41% 0.34% -0.22% 0.10%
CHF 0.15% 0.08% 0.04% 0.19% 0.24% -0.30% -0.10%

The heat map shows percentage changes of major currencies against each other. The base currency is picked from the left column, while the quote currency is picked from the top row. For example, if you pick the Japanese Yen from the left column and move along the horizontal line to the US Dollar, the percentage change displayed in the box will represent JPY (base)/USD (quote).

Source link

5 08, 2026

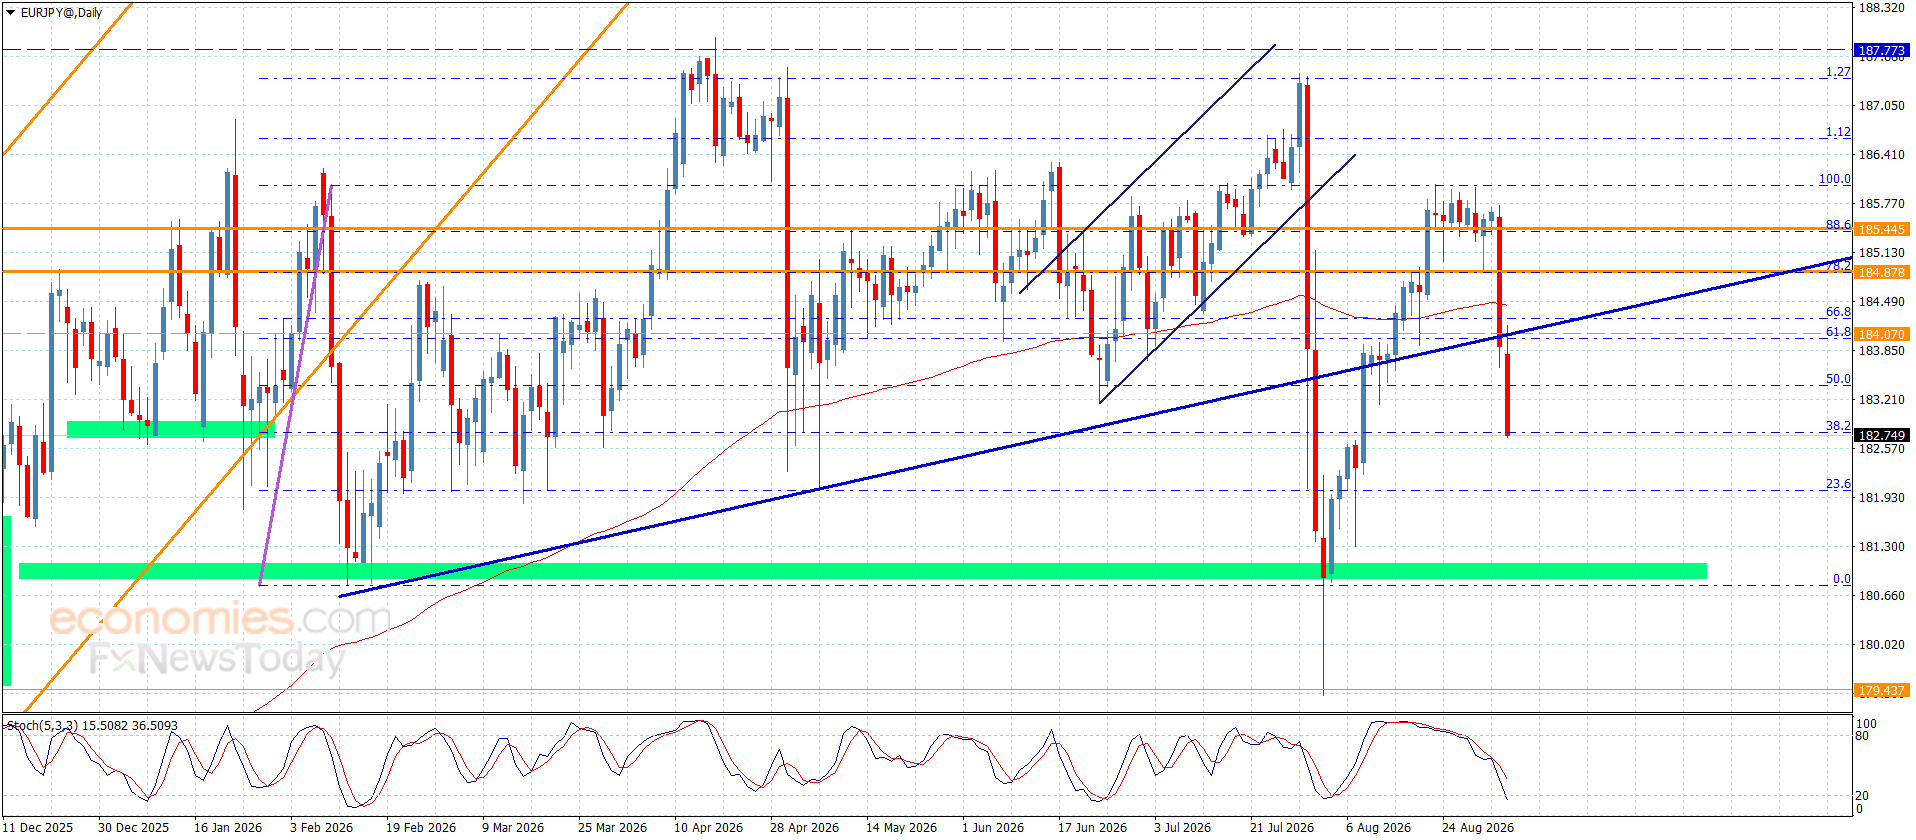
EUR/JPY Price Forecast: Softens below 182.00 on intervention risks, bearish outlook prevails

By |2026-08-05T14:53:06+03:00August 5, 2026|Forex News, News|0 Comments

The EUR/JPY cross trades in negative territory around 181.70 during the early European trading hours on Wednesday. The Japanese Yen (JPY) strengthens against the Euro (EUR) as traders remain on alerts for further intervention from Japanese authorities following the coordinated intervention between the United States (US) and Japan.

Traders will closely monitor the developments surrounding US-Iran talks. Axios reported that the US, Iran, and Oman are closing in on an interim deal to reopen the Strait of Hormuz, with Washington aiming for a Wednesday announcement.

The source added that the agreement under discussion sets up a 60-day temporary arrangement between Oman and Iran in the critical waterway. Fresh optimism over the Middle East could improve risk sentiment and provide some support to the riskier asset, such as the EUR against the JPY.

Yen outlook seen hinging on growth rather than faster BoJ hikes

Societe Generale argues that the policy rate path alone is unlikely to deliver a sustained recovery in the Yen. Analysts there stress that “more, or faster BoJ rate hikes won’t solve the problem either, unless the Japanese growth outlook makes them appear realistic,” underscoring their view that a credible improvement in Japan’s growth prospects is a prerequisite for any meaningful policy tightening to support the currency.

Technical Analysis: Negative outlook of EUR/JPY remains intact

In the daily chart, EUR/JPY keeps a bearish near-term tone as spot holds below the 20-day simple moving average (SMA) from the Bollinger Bands and the 100-day SMA, which now act as a tight resistance cluster overhead. Price is sliding toward the lower Bollinger Band while the Relative Strength Index (14) at 34.77 stays close to oversold territory, hinting that downside pressure persists but may be approaching a fatigue zone.

On the topside, initial resistance is aligned at the Bollinger mid-line/20-day SMA near 184.90, followed by the 100-day SMA at 185.10. A decisive daily close above this level would be needed to ease the current downside bias, with the upper Bollinger Band up at 188.65 as a more distant barrier. 

On the downside, the lower Bollinger Band around 181.15 offers the first notable support, and a clear break beneath it would expose the February 12 low of 180.81, en route to the 180.00 psychological level. 

(The technical analysis of this story was written with the help of an AI tool. Know more.)

Japanese Yen FAQs

The Japanese Yen (JPY) is one of the world’s most traded currencies. Its value is broadly determined by the performance of the Japanese economy, but more specifically by the Bank of Japan’s policy, the differential between Japanese and US bond yields, or risk sentiment among traders, among other factors.

One of the Bank of Japan’s mandates is currency control, so its moves are key for the Yen. The BoJ has directly intervened in currency markets sometimes, generally to lower the value of the Yen, although it refrains from doing it often due to political concerns of its main trading partners. The BoJ ultra-loose monetary policy between 2013 and 2024 caused the Yen to depreciate against its main currency peers due to an increasing policy divergence between the Bank of Japan and other main central banks. More recently, the gradually unwinding of this ultra-loose policy has given some support to the Yen.

Over the last decade, the BoJ’s stance of sticking to ultra-loose monetary policy has led to a widening policy divergence with other central banks, particularly with the US Federal Reserve. This supported a widening of the differential between the 10-year US and Japanese bonds, which favored the US Dollar against the Japanese Yen. The BoJ decision in 2024 to gradually abandon the ultra-loose policy, coupled with interest-rate cuts in other major central banks, is narrowing this differential.

The Japanese Yen is often seen as a safe-haven investment. This means that in times of market stress, investors are more likely to put their money in the Japanese currency due to its supposed reliability and stability. Turbulent times are likely to strengthen the Yen’s value against other currencies seen as more risky to invest in.

Source link

5 08, 2026

Pound-to-Dollar Forecast For Year Ahead: Why GBP Could Lose 5%

By |2026-08-05T10:51:34+03:00August 5, 2026|Forex News, News|0 Comments

Goldman Sachs sees GBP/USD falling towards 1.28 as UK fiscal risks and relatively high Bank of England pricing leave Pound Sterling vulnerable.

The Pound to Dollar (GBP/USD) exchange rate has recovered from late-July lows, but Goldman Sachs still expects Sterling to weaken towards 1.28.

GBP/USD was trading around 1.3446 on Tuesday, having gained 0.6% over the past month.

The pair touched 1.3558 in July before falling back, with the latest rebound largely driven by broad Dollar weakness.

Goldman has now closed its tactical short GBP/USD recommendation for a small profit, but its broader Sterling view remains cautious.

“We continue to expect Sterling underperformance over the medium term, driven by bouts of fiscal premium and an unwind of BoE hike pricing,” the bank said.

That leaves the direction lower even if the timing is less straightforward.

GBP/USD 1 month chart
Image: GBP/USD 1 month chart

GBP/USD has recovered from below 1.33, but the latest rally has struggled to hold above the 1.35 area.

Goldman says Sterling’s near-term risks are now “more balanced” after the recent rebound, particularly as EUR/GBP has moved back closer to the level implied by cyclical fundamentals.

The bigger concern sits further ahead.

“On the former, after some question marks around funding propositions in week one, fiscal news in the second week of the Burnham government has been comparatively light,” Goldman said.

“We suspect this largely remains the case until closer to the Autumn Budget.”

That relative calm may not last. Goldman expects fiscal concerns to return once the Budget approaches, with renewed pressure likely if the government struggles to explain how new spending or tax measures will be funded.

“Many of the fundamental constraints to fiscal policy still [remain] in place,” the bank said, adding that another period of fiscal volatility would likely produce “short-lived but asymmetrically negative bouts of Sterling pressure”.

Near-Term GBP/USD Outlook: BoE Pricing Leaves Pound Sterling Exposed

The Bank of England is the second part of the story.

Goldman said its main takeaway from the latest MPC meeting was the “patient tone from the on-hold majority”, particularly from Governor Bailey and Deputy Governor Lombardelli.

The bank’s economists have “reiterated their no-hike baseline”, while market pricing through to year-end has moved further above Goldman’s own forecast than in any other G10 market.

“We see [this] as a likely source of downside Sterling pressure in the months ahead,” Goldman said.

GBP to USD forecast consensus range 2026-2027
Image: GBP to USD forecast consensus range 2026-2027

The latest bank consensus range shows a wide spread of GBP/USD forecasts, with the current rate near the middle of the third-quarter distribution.

In our view, the main risk is not an immediate collapse in Sterling, but a slower repricing as markets pare back expectations for tighter UK policy and refocus on the autumn fiscal outlook.

Goldman’s 1.28 target sits below the current bank consensus median and would represent a fall of roughly 5% from current levels.

Exchange Rates UK Research

Our currency coverage draws on live market data, official economic releases and published bank research.

Source link

5 08, 2026

USD/JPY Price Forecast: 200-day SMA caps rebound after intervention-led selloff

By |2026-08-05T06:49:34+03:00August 5, 2026|Forex News, News|0 Comments

USD/JPY trades modestly higher on Tuesday despite a softer US Dollar (USD), as the impact of recent intervention fades and the Japanese Yen (JPY) comes under pressure again. At the time of writing, the pair trades around 157.60, recovering after briefly falling toward 155 on Monday, its lowest level since May 6.

Analysts at Societe Generale argue that a lasting recovery in the Yen will hinge on the domestic growth story rather than policy theatrics, maintaining that “what will trigger a durable yen rally will be a rise in consensus forecasts of Japanese growth, rather than more, bigger intervention, coordinated or otherwise.”

They add that “more, or faster BoJ rate hikes won’t solve the problem either, unless the Japanese growth outlook makes them appear realistic,” cautioning that “if Japanese growth remains weak, higher JGB yields will increasingly be unhelpful for the yen.”

In contrast, strategists at BBH focus on the near-term impact of recent official action, noting that “the coordinated US-Japan intervention – and officials’ warning that they stand ready to act again – significantly raises the cost of fighting a stronger yen and puts a much firmer ceiling on USD/JPY.”

From a technical perspective, the intervention-driven pullback in USD/JPY has weakened the near-term bullish structure, with the pair slipping below key moving averages.

On the daily chart, the 200-day Simple Moving Average (SMA) at 158 offers immediate resistance. Further up, the 100-day SMA at 160 guards the path toward the 50-day SMA at 161.26 and the 21-day SMA at 161.89, ahead of a more distant structural hurdle at 164.

The Relative Strength Index (RSI) at 27 signals oversold conditions, while the Moving Average Convergence Divergence (MACD) remains below zero, reflecting the recent shift in momentum to the downside.

On the downside, the 155.00 psychological mark offers immediate support. A decisive break below this level could expose the 152.50 area, with the 150.00 psychological mark emerging as the next major downside target.

(The technical analysis of this story was written with the help of an AI tool. Know more.)

Japanese Yen Price Today

The table below shows the percentage change of Japanese Yen (JPY) against listed major currencies today. Japanese Yen was the strongest against the Canadian Dollar.

USD EUR GBP JPY CAD AUD NZD CHF
USD -0.15% -0.06% 0.25% 0.18% -0.59% -0.34% -0.09%
EUR 0.15% 0.06% 0.44% 0.32% -0.45% -0.22% 0.07%
GBP 0.06% -0.06% 0.36% 0.27% -0.50% -0.27% 0.00%
JPY -0.25% -0.44% -0.36% -0.09% -0.85% -0.64% -0.24%
CAD -0.18% -0.32% -0.27% 0.09% -0.77% -0.55% -0.26%
AUD 0.59% 0.45% 0.50% 0.85% 0.77% 0.22% 0.51%
NZD 0.34% 0.22% 0.27% 0.64% 0.55% -0.22% 0.29%
CHF 0.09% -0.07% -0.01% 0.24% 0.26% -0.51% -0.29%

The heat map shows percentage changes of major currencies against each other. The base currency is picked from the left column, while the quote currency is picked from the top row. For example, if you pick the Japanese Yen from the left column and move along the horizontal line to the US Dollar, the percentage change displayed in the box will represent JPY (base)/USD (quote).

Source link

5 08, 2026

EUR/USD Forecast: Decisive Break Of 1.1600 Needed For Sustained Upside

By |2026-08-05T02:48:41+03:00August 5, 2026|Forex News, News|0 Comments


Source link

4 08, 2026

GBP/JPY Price Forecast: Bears test 200-day SMA after sharp sell-off

By |2026-08-04T22:46:29+03:00August 4, 2026|Forex News, News|0 Comments

GBP/JPY rises on Tuesday as the Japanese Yen (JPY) gives back part of its recent rally, which was driven by coordinated intervention from Tokyo and Washington.

At the time of writing, the cross trades around 211.55, up 0.20% on the day.

Yen support from US intervention seen as limited and time-buying

Analysts at MUFG/BTMU argue that the recent bout of joint FX intervention offers only partial and temporary relief for the Yen. They stress that, “on balance, we expect US intervention to support the [Y]en to remain relatively small in scale,” even if coordinated action with Japan helps steady the currency in the near term. In their view, “while joint intervention may prove more effective at helping to provide support for the [Y]en in the near-term, we still believe that it can only buy time.” MUFG/BTMU conclude that, ultimately, “there will need to be a change in fundamentals as well to encourage a sustainable reversal of the [Y]en weakening trend that has been in place over the last five years.”

Despite Tuesday’s rebound, the near-term technical picture for GBP/JPY has turned bearish. The recent sell-off pushed the cross decisively below the 100-day Simple Moving Average (SMA) for the first time since April 2025, with the pair now testing the 200-day SMA.

Technical analysis

On the daily chart, GBP/JPY trades below the 100-day Simple Moving Average (SMA) at 214.45 and hovers around the 200-day SMA at 211.75, keeping the near-term bias tilted to the downside.

The Relative Strength Index (RSI) near 30 hints at oversold conditions and the Moving Average Convergence Divergence (MACD) remains deeply negative, reinforcing selling pressure.

On the topside, initial resistance is located at the 100-day SMA at 214.45, followed by the horizontal barrier at 216.50, with a stronger cap emerging near 220.

On the downside, the 200-day SMA at 211.75 marks first support ahead of the 210 level, with deeper floors at 207 and 205, where bears could start to lose momentum if the RSI slips further into oversold territory.

(The technical analysis of this story was written with the help of an AI tool. Know more.)

Japanese Yen Price Today

The table below shows the percentage change of Japanese Yen (JPY) against listed major currencies today. Japanese Yen was the strongest against the Canadian Dollar.

USD EUR GBP JPY CAD AUD NZD CHF
USD -0.06% -0.08% 0.14% 0.10% -0.44% -0.22% -0.15%
EUR 0.06% -0.04% 0.22% 0.15% -0.41% -0.19% -0.08%
GBP 0.08% 0.04% 0.28% 0.21% -0.35% -0.13% -0.04%
JPY -0.14% -0.22% -0.28% -0.06% -0.60% -0.41% -0.19%
CAD -0.10% -0.15% -0.21% 0.06% -0.54% -0.34% -0.24%
AUD 0.44% 0.41% 0.35% 0.60% 0.54% 0.22% 0.30%
NZD 0.22% 0.19% 0.13% 0.41% 0.34% -0.22% 0.10%
CHF 0.15% 0.08% 0.04% 0.19% 0.24% -0.30% -0.10%

The heat map shows percentage changes of major currencies against each other. The base currency is picked from the left column, while the quote currency is picked from the top row. For example, if you pick the Japanese Yen from the left column and move along the horizontal line to the US Dollar, the percentage change displayed in the box will represent JPY (base)/USD (quote).

Source link

4 08, 2026

EUR/JPY Forecast 04/08: Euro Stabilizes After BoJ Action

By |2026-08-04T18:45:08+03:00August 4, 2026|Forex News, News|0 Comments

EUR/JPY is starting to bounce; now the question is whether or not we are going to continue?

EUR/JPY

The Euro has fallen a bit during the trading session here on Monday against the Japanese yen, but it has bounced a bit. We’re starting to see a little bit of a pushback from the coordinated effort between the Fed and the Bank of Japan to save the Japanese yen, basically.

Really, what we’ve got here is a situation where a lot of borrowing in Japanese yen means that a rapidly depreciating yen can cause systemic concerns. It’s really not so much about the level of the yen per se as it is the relentless selling of it. Now, this pair is a little bit different because it involves the Euro as opposed to the US dollar, which was the true concern.

The Euro itself is a currency that’s somewhat lackluster, but it is starting to see a little bit of benefit from US weakness. Now, having said that, the US numbers today were the manufacturing PMI and the ISM numbers, and they actually came out a little bit ahead, about 1.5 points. So, we’ve turned around from seeing everything miss for a couple of weeks to suddenly inflation in orders are starting to pick up.

So, what’s going to happen to the US dollar? I suspect interest rates will continue to remain high. So, converting that over here, once the market starts to push back against the Bank of Japan, you have a scenario where the Euro will possibly rise. It probably won’t rise as quickly as the US dollar because we also have to worry about inflationary pressures coming out of the Middle East.

Central Bank Interventions Focus on Slowing Trends Rather Than Reversals

The Europeans are going to have a serious problem if the Strait of Hormuz cannot get opened. The Qataris are already buying natural gas from the Americans, meaning that they are, in a roundabout way, importing LNG from the US to the EU in this winter. If that keeps up, it’s going to cause a lot of problems in the European Union, and that will show itself here in the Euro.

So, with that being said, if we can recapture the 200-day EMA, it is a potential drift higher. Right now, I think we’re in the middle of stabilizing. This is generally the pattern you see after an intervention. You get 1 or 2 really big drops, and then you get a little bit of stabilization like we’ve seen a couple of times before.

When looked at through the big picture, it’s but a blip on the radar. In general, these interventions are all about slowing down something, not changing the trend. EUR/JPY is a pair that a year and a half ago was down here near 155. We find ourselves at 180. Still very bullish, but you’re going to have to be patient. You have to enter positions slowly.

Begin trading our daily forecasts and analysis. Here is a list of Forex brokers in Japan to work with.

Christopher Lewis is a technical analyst and market commentator at DailyForex with more than two decades of trading experience in Forex and other leveraged markets. Based in Columbus, Ohio, he specializes in chart-based analysis of major currency pairs, stock indices, commodities, and energy markets, focusing on clear support and resistance levels, trend structure, and risk management. Christopher produces daily written and video analysis for traders who rely on technical setups to navigate volatile market conditions

As seen on: Pairs Of Aces Podcast,The Trader Guy, FXEmpire

Source link

4 08, 2026

GBP/USD Price Forecast: Downward-sloping trendline near 1.3470 remains key barrier

By |2026-08-04T14:44:33+03:00August 4, 2026|Forex News, News|0 Comments

The British pound (GBP) faces selling pressure against its major currency peers, trading 0.1% lower at around 1.3420 against the US Dollar (USD) during the European trading session on Tuesday.

Pound Sterling Price Today

The table below shows the percentage change of British Pound (GBP) against listed major currencies today. British Pound was the weakest against the Australian Dollar.

USD EUR GBP JPY CAD AUD NZD CHF
USD 0.03% 0.08% 0.35% 0.12% -0.22% 0.13% -0.01%
EUR -0.03% 0.03% 0.36% 0.08% -0.26% 0.08% -0.02%
GBP -0.08% -0.03% 0.32% 0.06% -0.29% 0.04% -0.06%
JPY -0.35% -0.36% -0.32% -0.25% -0.58% -0.27% -0.25%
CAD -0.12% -0.08% -0.06% 0.25% -0.33% -0.01% -0.11%
AUD 0.22% 0.26% 0.29% 0.58% 0.33% 0.33% 0.19%
NZD -0.13% -0.08% -0.04% 0.27% 0.01% -0.33% -0.09%
CHF 0.00% 0.02% 0.06% 0.25% 0.11% -0.19% 0.09%

The heat map shows percentage changes of major currencies against each other. The base currency is picked from the left column, while the quote currency is picked from the top row. For example, if you pick the British Pound from the left column and move along the horizontal line to the US Dollar, the percentage change displayed in the box will represent GBP (base)/USD (quote).

Pound struggles for support as BoE hawkish split meets dovish Bailey tone

Analysts at Rabobank highlight that “GBP net shorts bounced higher last week ahead of the BoE policy meeting,” underscoring renewed speculative pressure on the Pound. They note that, “despite a more hawkish voting split than the market had expected from the MPC, Governor Bailey’s tone was dovish,” which in their view “suggest[ed] little support for the pound from the BoE.” This combination of positioning and communication leaves Sterling lacking clear policy backing despite the ostensibly firmer stance implied by the vote split.

In BoE Bailey’s last week’s press conference, he said, “Please do not leave this room thinking that the Bank of England is edging towards a hike, because frankly, there’s nothing in what I said, and I think any of us have said, along those lines,” Reuters reported.

The selling pressure in the GBP/USD pair is also driven by the higher US Dollar. As of writing, the US Dollar Index (DXY), which gauges the Greenback’s value against six major currencies, trades slightly higher to near 100.05. The USD Index recovered sharply on Monday after posting a fresh two-week high at 99.42.

The Greenback extends Monday’s recovery further as investors turn cautious ahead of key United States (US) economic releases.

Investors will pay close attention to the US Nonfarm Payrolls (NFP) data for July on Friday to get fresh cues regarding the Federal Reserve’s (Fed) monetary policy. Fed’s new policy “say no to so-called forward-guidance” has increased investors’ dependency on economic releases to project the Fed’s next policy move.

Later in the day, investors will focus on the US JOLTS Job Openings data for June, which will be published at 14:00 GMT. The data is expected to arrive at 7.45 million fresh jobs, slightly lower than 7.594 million in May.

GBP/USD technical analysis

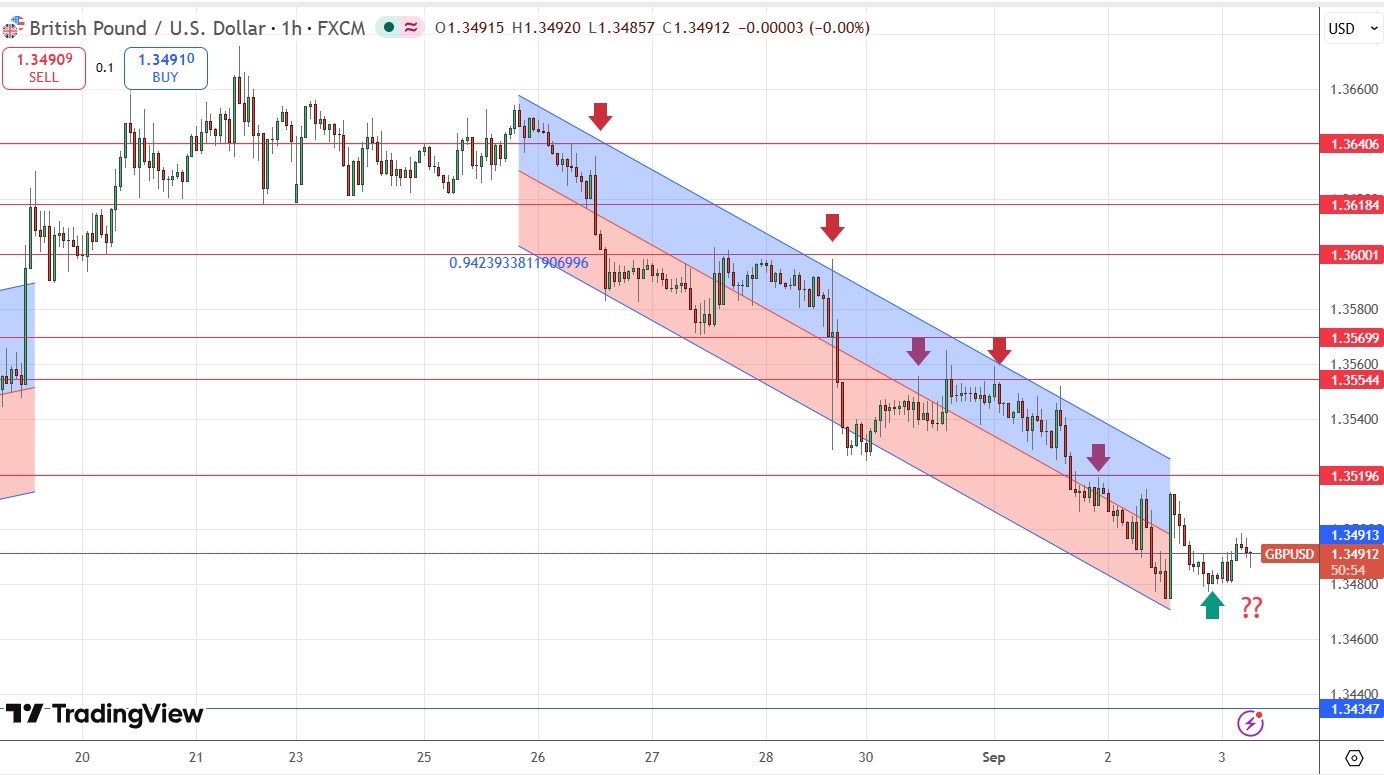
GBP/USD trades slightly lower at around 1.3423, but is holding above the 20-day exponential moving average (EMA) at 1.3389 and retaining a mildly bullish near-term bias. The pair has reclaimed short-term trend support, while the downward resistance trend line, with a key break reference at 1.3473, now caps the topside.

The Relative Strength Index (RSI) at roughly 54 leans constructive without signaling overbought conditions, suggesting scope for further gains while acknowledging nearby overhead supply.

On the topside, immediate resistance is seen at the trend-line break area near 1.3473, ahead of the psychological level at 13500. On the downside, initial support is provided by the 20-day EMA at 1.3389, which should act as a cushion on pullbacks; a daily close back below this level would weaken the current bullish tone and expose it to the July 28 low at 1.3274.

(The technical analysis of this story was written with the help of an AI tool. Know more.)

Pound Sterling FAQs

The Pound Sterling (GBP) is the oldest currency in the world (886 AD) and the official currency of the United Kingdom. It is the fourth most traded unit for foreign exchange (FX) in the world, accounting for 12% of all transactions, averaging $630 billion a day, according to 2022 data.
Its key trading pairs are GBP/USD, also known as ‘Cable’, which accounts for 11% of FX, GBP/JPY, or the ‘Dragon’ as it is known by traders (3%), and EUR/GBP (2%). The Pound Sterling is issued by the Bank of England (BoE).

The single most important factor influencing the value of the Pound Sterling is monetary policy decided by the Bank of England. The BoE bases its decisions on whether it has achieved its primary goal of “price stability” – a steady inflation rate of around 2%. Its primary tool for achieving this is the adjustment of interest rates.
When inflation is too high, the BoE will try to rein it in by raising interest rates, making it more expensive for people and businesses to access credit. This is generally positive for GBP, as higher interest rates make the UK a more attractive place for global investors to park their money.
When inflation falls too low it is a sign economic growth is slowing. In this scenario, the BoE will consider lowering interest rates to cheapen credit so businesses will borrow more to invest in growth-generating projects.

Data releases gauge the health of the economy and can impact the value of the Pound Sterling. Indicators such as GDP, Manufacturing and Services PMIs, and employment can all influence the direction of the GBP.
A strong economy is good for Sterling. Not only does it attract more foreign investment but it may encourage the BoE to put up interest rates, which will directly strengthen GBP. Otherwise, if economic data is weak, the Pound Sterling is likely to fall.

Another significant data release for the Pound Sterling is the Trade Balance. This indicator measures the difference between what a country earns from its exports and what it spends on imports over a given period.
If a country produces highly sought-after exports, its currency will benefit purely from the extra demand created from foreign buyers seeking to purchase these goods. Therefore, a positive net Trade Balance strengthens a currency and vice versa for a negative balance.

Source link

4 08, 2026

USD/JPY Forecast: Dollar Gains Respite, But 160.00 Holds As Key Hurdle

By |2026-08-04T10:43:24+03:00August 4, 2026|Forex News, News|0 Comments


Source link

Go to Top