The main tag of Forex News Today Articles.
You can use the search box below to find what you need.
[wd_asp id=1]

4 08, 2026

Bank Of America Euro To Dollar Forecast: EUR/USD At 1.12 Before Year-End Recovery

By |2026-08-04T06:42:23+03:00August 4, 2026|Forex News, News|0 Comments

The euro’s recovery against the dollar has strengthened, but Bank of America still sees scope for a near-term pullback.

The Euro to US Dollar exchange rate (EUR/USD) slipped to around 1.1504 on Monday after opening near 1.1548, leaving the pair at the bottom of its intraday range.

Today's EUR/USD intraday chart
Image: Today’s EUR/USD intraday chart

EUR/USD ended July around 1.1530, having recovered from a monthly low near 1.1354.

The pair remains 1.7% lower for 2026, with this year’s trading range extending from 1.1325 to 1.2075.

The Euro-to-Dollar exchange rate - historical year-to-date chart for 2026
Image: The Euro-to-Dollar exchange rate – historical year-to-date chart for 2026

Bank of America says the July Fed press conference “injected uncertainty around the Fed’s inflation-fighting commitment and reaction function”.

The bank described the meeting as “doved and confused”, with Chair Kevin Warsh suggesting that financial markets had already delivered some of the tightening that might otherwise have required higher rates.

BofA said this was “not reassuring”, adding that the Dollar should respond differently to “a central bank credibly doing the tightening” than one which “outsources the tightening to the market”.

That credibility concern has shifted the near-term risk balance against the Dollar. However, BofA still sees support from resilient US economic conditions, artificial-intelligence investment and geopolitical uncertainty.

The bank also believes the Fed may ultimately need to respond more forcefully.

“Ironically, we think the need to re-establish credibility increases the probability that the Fed will hike in September,” BofA said.

Its economists continue to forecast three 25-basis-point increases over the remaining meetings of 2026.

BofA forecasts EUR/USD at 1.12 in September, 1.15 at year-end and 1.20 by the end of 2027.

The Euro’s technical recovery has improved after the late-July surge, but 1.1500 remains the immediate test.

A sustained hold above it would keep 1.1555 and 1.1600 in view, while a renewed break lower would expose 1.1450 and the 1.1370 area.

Exchange Rates UK Research

Our currency coverage draws on live market data, official economic releases and published bank research.

Source link

4 08, 2026

USD to YEN Forecast: Rare US Intervention Sends Pair to 155; Will It Fall Further?

By |2026-08-04T02:41:21+03:00August 4, 2026|Forex News, News|0 Comments

TradingKey – As of the European session on August 3, the US dollar against the Japanese yen ( USD/JPY) was trading near 156.70, having briefly plummeted to 155.20 intraday before paring some of its losses. Last week, USD/JPY neared 164.00, hitting a roughly 40-year high, but the exchange rate has fallen for four consecutive trading sessions as Japan and the US successively bought yen.

Why the Dollar Is Falling Against the Yen?

The direct cause of the current decline in USD/JPY is the joint foreign exchange intervention by the US and Japan. Japan’s Ministry of Finance confirmed that after Japan bought yen in the New York market last week, the US Treasury Department also participated in buying yen through the New York Fed to curb the currency’s recent excessive volatility and disorderly depreciation. This is the first joint intervention by the US and Japan since 1998, releasing a policy signal far stronger than unilateral intervention by Japan.

Japanese Finance Minister Satsuki Katayama stated that if the yen experiences sharp volatility again, Japan and the US will not hesitate to take further joint action. US Treasury Secretary Bessent also indicated that Washington is prepared to repeat intervention if necessary. Because the market cannot accurately predict the timing and scale of the authorities’ next entry, some investors who previously bet on the continuous depreciation of the yen began to unwind their positions, driving USD/JPY down rapidly from above 163 to near 155.

The direct participation of the US in this intervention has also changed the market’s assessment of the yen. In the past, unilateral yen purchases by Japan usually only triggered a short-term rally because the wide US-Japan interest rate gap meant investors still preferred to borrow low-yield yen to buy dollar assets. However, the US’s participation implies that the yen’s depreciation is no longer merely a domestic issue for Japan, but is instead seen as a risk that could affect global financial stability and the US Treasury market.

Japan holds a massive amount of US Treasuries. If Japan were to sell off US Treasuries in a concentrated manner to raise intervention funds, it could push up US Treasury yields and increase borrowing costs for the US government. Direct yen purchases by the US Treasury, or utilizing the New York Fed to provide dollar liquidity, can reduce Japan’s need to conduct large-scale sales of US Treasuries, which is likely one of the key reasons why the US is willing to participate in the intervention.

The Bank of Japan’s policy stance has also begun to provide support for the yen. While the BOJ kept its policy rate unchanged at 1% at its July meeting, it stated in its economic outlook that it will continue to raise rates in the future as underlying inflation gradually approaches 2%. BOJ Governor Kazuo Ueda also noted that if upside risks to inflation expand, the central bank will discuss whether faster action is needed. The combination of the joint intervention and the BOJ keeping the door open to rate hikes has further weakened the upward momentum of USD/JPY.

Can the Yen Continue to Appreciate?

Whether the yen can sustain its appreciation remains uncertain. U.S. interest rates are still significantly higher than Japan’s, and with low yen financing costs, the foundation for the carry trade has not fully disappeared. Meanwhile, Japan’s expansionary fiscal policy could increase government debt and inflationary pressures, which would also limit the yen’s long-term appreciation potential.

ING believes that if expectations for Fed rate hikes do not cool significantly and the Bank of Japan does not tighten policy further, USD/JPY could still climb back above 160.

USD TO YEN Technical Analysis

USD/JPY Daily Chart, Source: TradingView

According to the USD/JPY daily chart, the pair previously approached the 164.00 level before falling rapidly, breaking below two key levels of 160.00 and 158.00 in quick succession, indicating that short-term market sentiment has shifted to the bearish side. Following joint intervention by the U.S. and Japan, bearish momentum has significantly strengthened. However, the exchange rate quickly rebounded from near 155.20 to around 157.00, suggesting some support remains near the 155.00 level.

On the downside, initial support for the pair is located near the 155.00 level. A break below this level could lead to further declines toward 152.00, with a potential test of the key 150.00 level.

On the upside, immediate resistance sits near the 158.00 level. If the pair breaks and holds above this point, further room for a rebound would open up, potentially testing the 160.00 level. However, with both the U.S. and Japan clearly indicating that further interventions remain on the table, levels above 160 will face stronger policy pressure. Only a decisive break and consolidation above 160 would allow USD/JPY to challenge the 162 to 164 range once again.

This content was translated using AI and reviewed for clarity. It is for informational purposes only.

Disclaimer: The content of this article solely represents the author’s personal opinions and does not reflect the official stance of Tradingkey. It should not be considered as investment advice. The article is intended for reference purposes only, and readers should not base any investment decisions solely on its content. Tradingkey bears no responsibility for any trading outcomes resulting from reliance on this article. Furthermore, Tradingkey cannot guarantee the accuracy of the article’s content. Before making any investment decisions, it is advisable to consult an independent financial advisor to fully understand the associated risks.


Source link

3 08, 2026

GBP/USD Analysis: Pound holds firm after BoE decision

By |2026-08-03T22:40:22+03:00August 3, 2026|Forex News, News|0 Comments

The pound sterling has started to show relevant strength against the U.S. dollar. At the moment, GBP/USD has gained slightly more than 1.3% in the short term, reflecting an important buying bias.

Buying pressure began to gain relevance after the Federal Reserve decision during yesterday’s session and strengthened even further after the Bank of England decision today. For now, the central bank dynamic could continue to be key for demand in the pound sterling and maintain possible buying pressure on GBP/USD over the next few trading sessions.

Fed and BoE signals shape the outlook

During today’s session, the Bank of England published its interest rate decision and kept the reference rate at 3.75%, in line with expectations. However, the vote delivered an important signal: 6 members voted to keep rates unchanged, while 3 members voted for a 0.25% hike.

Although the rate did not change, this division was interpreted as a slightly more aggressive signal, as it shows that an important part of the committee is starting to consider the need for further increases over the coming months.

In the statement after the decision, the central bank highlighted that energy prices remain volatile and that this factor could continue to pressure inflation. For this reason, although additional hikes were not confirmed, the BoE does not appear ready to ease its stance either. If annual inflation fails to move closer to the 2.00% target, the central bank could continue to consider a more restrictive monetary policy.

The dynamic in the United States was slightly different. Although the Federal Reserve also kept rates unchanged in the 3.50% – 3.75% range, Kevin Warsh’s comments after the decision did not offer a clear signal of a possible hike in September.

This difference is important because the market expected a more aggressive stance from the Fed, but the event did not confirm that expectation. According to the CME Group probability table, for the September 16 decision, there is still a probability near 61% of a rate hike in the United States. However, a probability of almost 40% that rates remain unchanged has also started to emerge, something that had not been observed with the same strength in previous weeks.

Source: CMEGROUP

As a result, the market is facing an interesting dynamic. In the United States, expectations of a more aggressive Fed have lost strength, while in the United Kingdom, the BoE showed internal division that keeps open the possibility of a more restrictive stance if inflation remains a problem.

This contrast has started to be reflected in the U.S. dollar. The DXY index, which measures the dollar’s strength against its main peers, has shown a relevant decline since the Federal Reserve announcement and is now below the 100-point area. This suggests that demand for the dollar has started to weaken significantly after the U.S. central bank decision.

Source: TradingEconomics

With this in mind, and considering that both the United States and the United Kingdom maintain rates near 3.75%, the main difference lies in each central bank’s message. While the market is starting to price in a Bank of England that appears more willing to act if necessary, the Federal Reserve has reduced signals of early rate increases.

This dynamic could continue to weigh on the dollar and open room for the pound sterling to recover more consistently. If this scenario remains in place, GBP/USD could continue to show buying pressure over the next few trading sessions.


Technical forecast for GBP/USD

Source: StoneX, Tradingview

  • The broad sideways range continues to dominate: Despite GBP/USD’s recovery attempts, the chart continues to show a broad sideways channel that has acted as the main technical structure for several months. This range remains between an upper area near 1.37492 and support around 1.32079. If price fails to break consistently out of these levels, the sideways structure will remain the most relevant pattern and could continue to reflect indecision over the coming trading weeks.
     
  • RSI: Now, the RSI remains above the neutral 50 level, suggesting that bullish impulses have started to gain relevance in the short term. If this dynamic continues, the indicator could keep supporting the formation of a more important buying bias over the next few sessions.
     
  • MACD: The MACD shows a histogram near the neutral 0 area, suggesting balance in the strength of short-term moving averages. This reading indicates that, although the pound has gained strength, the indecision bias has not completely disappeared from the GBP/USD chart.
     

Key levels:

  • 1.36255 – Relevant resistance: This relevant high is positioned as the main bullish barrier in the short term. Price movements toward this area could reinforce the current buying pressure and open room for a more consistent bullish bias over the next few sessions. In addition, a clear break above this level could start to put at risk the broad sideways range that has remained in place for several months.
     
  • 1.34079 – Near-term barrier: This recent neutral area coincides with the 50- and 200-period simple moving averages. If price moves back toward this level consistently, it could once again highlight a phase of indecision and keep the sideways range as the dominant technical structure.
     
  • 1.32079 – Crucial support: This low coincides with the lower barrier of the broad sideways range. Sustained moves below this point could reflect a dominant selling bias and open room for the formation of a short-term bearish trend line over the coming trading weeks.
     

Written by Julian Pineda, CFA, CMT – Market Analyst

Follow him on: @julianpineda25


Source link

3 08, 2026

US, Japan, and South Korea Join Forces to Support Yen. Forecast as of 03.08.2026

By |2026-08-03T18:39:20+03:00August 3, 2026|Forex News, News|0 Comments

Over the past few weeks, the USD/JPY pair has been trading amid concerns about potential currency interventions. Eventually, the Forex market saw them happen. The coordinated intervention was meant to further temper speculators. Let’s discuss this topic and develop a trading plan.

The article covers the following subjects:

Major Takeaways

  • The yen was supported by a coordinated intervention.
  • The Bank of Japan’s sluggish response is helping the USD/JPY.
  • The US does not want to allow Treasury yields to rise.
  • Long positions can be considered as long as the USD/JPY remains above 156.

Weekly Fundamental Forecast for Yen

The first coordinated currency intervention since 1998 aimed at supporting the yen has raised many questions. Is Japan truly so vulnerable that it cannot counter USD/JPY bulls on its own? Why would the US support such an effort? Which other countries, if any, were involved? Finally, why did the euro become a target for selling pressure rather than the US dollar alone?

According to Bloomberg, around $53 billion was deployed on the first day of intervention. Since September 2022, Japan has spent approximately $255 billion on currency interventions. With foreign exchange reserves exceeding $1 trillion, Tokyo theoretically had sufficient resources to act independently. However, a significant portion of those reserves is invested in US Treasury securities. Selling these assets aggressively would push Treasury yields higher—an outcome that does not align with US policy objectives.

US and Japanese Bond Yields

Source: Bloomberg.

According to Mizuho Bank, it was precisely the Ministry of Finance—led by Scott Bessent—that did not want volatility in Japan’s debt market to continue negatively affecting the US debt market, and this was the main reason for US participation in the coordinated intervention.

Why was the euro chosen as the target? The answer may be simpler than attempts to link it to the concept of a strong dollar. According to JPMorgan, the US Treasury’s Exchange Stabilization Fund held assets of approximately $13 billion and €25 billion. While this amount alone would clearly be insufficient for a large-scale intervention, the combined resources of Japan and a potential third participant could have provided a more substantial firepower. Against this backdrop, the FX market speculates that South Korea may also have taken part in the coordinated currency intervention.

Speculative Positions on Japanese Yen

Source: Bloomberg.

Notably, the timing was perfect. Speculators had pushed net short positions in the yen to their highest levels since 2024, while hedge funds’ short positions had soared to their highest level since 2007. Confusion over whether Kevin Warsh wants to raise rates or will wait until the last minute caused investors to flee the US dollar.

The key question is whether the current USD/JPY exchange rate is fundamentally justified. Based on the yield spread between US and Japanese government bonds, the pair appears to have moved closer to levels supported by market fundamentals. However, currency markets are also pricing in expectations for future Fed and Bank of Japan interest-rate policies. This is where Tokyo’s cautious approach could become a vulnerability—potentially leading to the pattern seen after the interventions in April and May. In that scenario, the dollar could resume its advance.

Market Expectations for Fed and BOJ Interest Rates

Source: Bloomberg.

Weekly USDJPY Trading Plan

The joint intervention managed to scare speculators but hardly discouraged traders from attempting to recover their losses. In currency markets, every victory comes with the possibility of a setback. The strategy of selling USD/JPY from 163.35 proved highly effective. However, the Bank of Japan’s slow response and the renewed activity of carry traders create conditions for taking profits and considering long positions—at least while the pair remains above ¥156.


This forecast is based on the analysis of fundamental factors, including official statements from financial institutions and regulators, various geopolitical and economic developments, and statistical data. Historical market data are also considered.

Price chart of USDJPY in real time mode

The content of this article reflects the author’s opinion and does not necessarily reflect the official position of LiteFinance broker. The material published on this page is provided for informational purposes only and should not be considered as the provision of investment advice for the purposes of Directive 2014/65/EU.


According to copyright law, this article is considered intellectual property, which includes a prohibition on copying and distributing it without consent.

Rate this article:

{{value}} ( {{count}} {{title}} )


Source link

3 08, 2026

EUR/USD forecast: Can yen intervention force a trend change?

By |2026-08-03T14:38:19+03:00August 3, 2026|Forex News, News|0 Comments

From forex.com | 14 hr ago

It was a big week for the FX market, but most of that drive came from the USD/JPY pair. While the prior week ECB meeting saw Christine Lagarde take a dovish tilt, EUR/USD stuttered after a downside break of a bear flag formation. To be sure, last week started with an open door for sellers but they were seemingly disinterested in continuation as short-term …

Source link

3 08, 2026

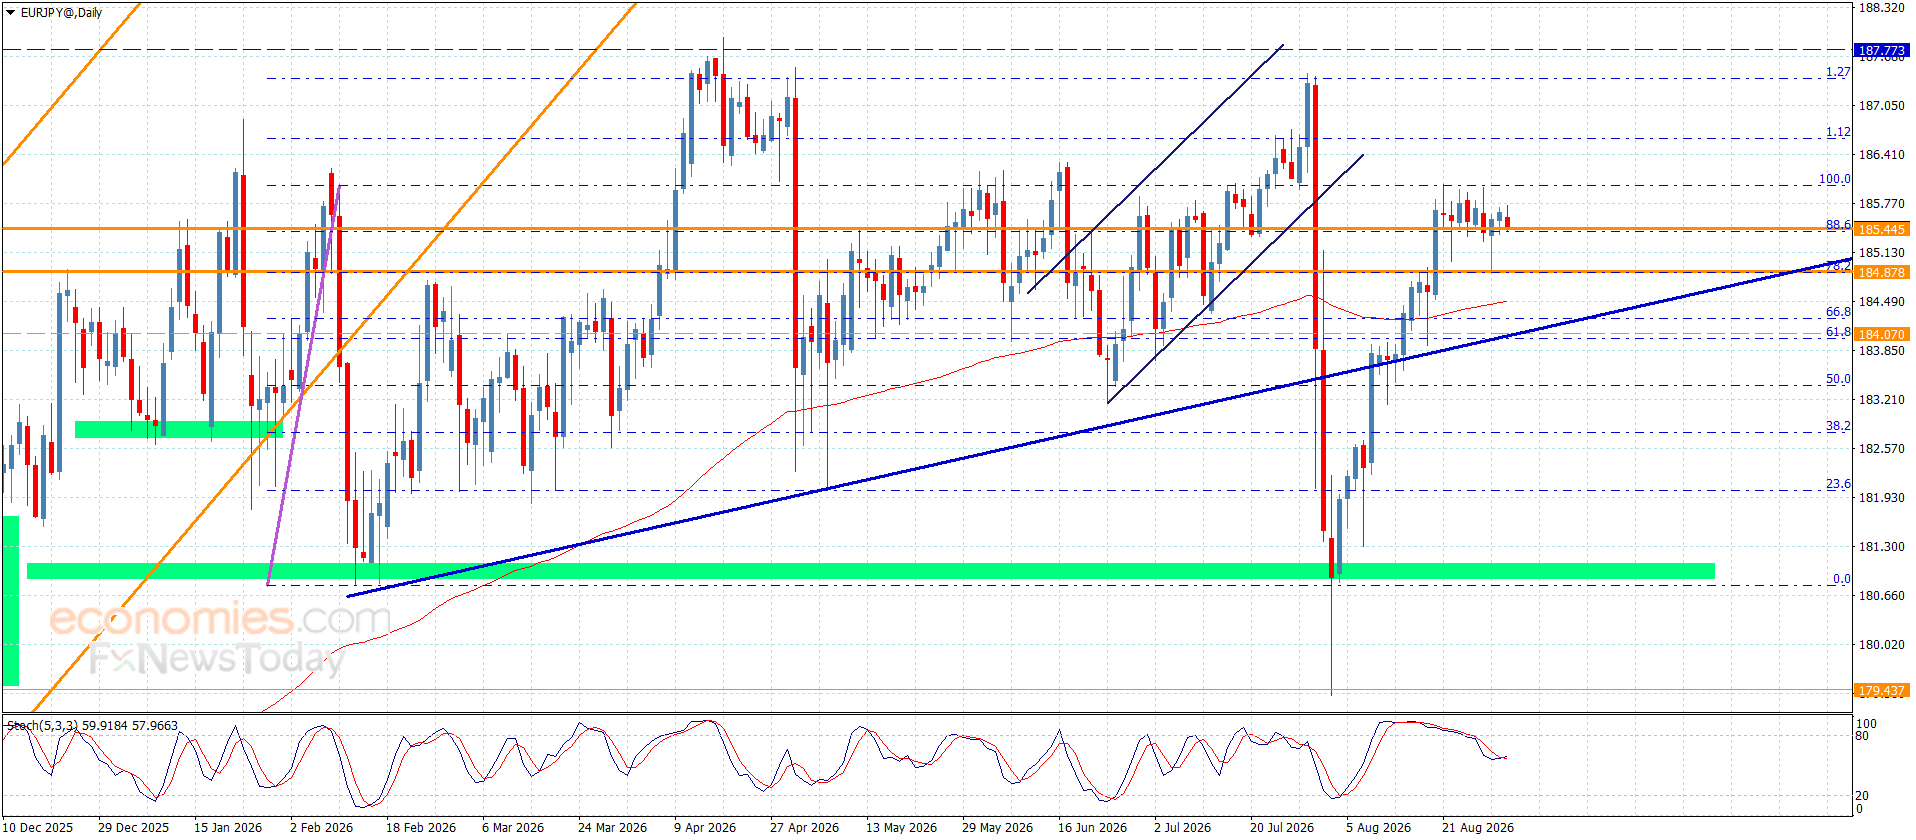
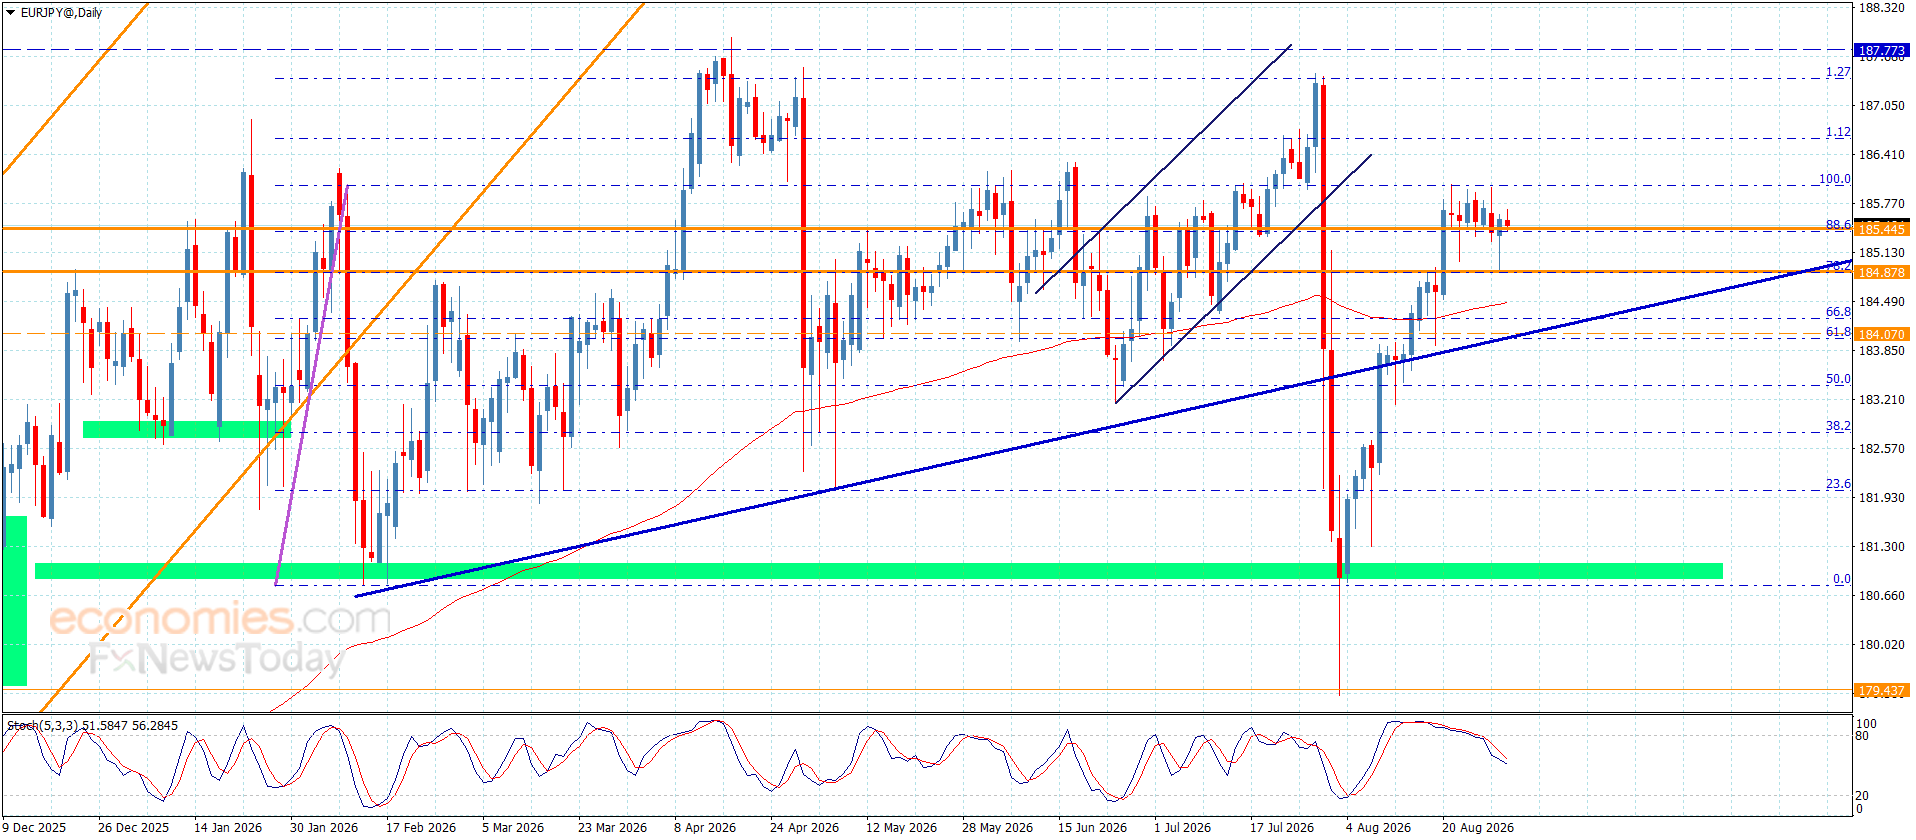
EUR/JPY Price Forecast: Breaks below 179.50 as bearish bias prevails

By |2026-08-03T10:37:23+03:00August 3, 2026|Forex News, News|0 Comments

EUR/JPY extends its gains for the third successive day, trading around 179.40 during the Asian hours on Monday. The currency cross is extending a bearish near-term tone as price holds beneath both the nine-period and 50-period Exponential Moving Averages (EMAs).

The short-term EMA remains below the longer 50-period EMA, reinforcing downside pressure, while the 14-day Relative Strength Index (RSI) indicator at 27.71 slips into oversold territory, hinting that while sellers are in control, the pace of the decline could soon moderate.

The EUR/JPY cross may retest the initial support at the eight-month low of 179.37, reached on August 3. Further support lies at the nine-month low of 175.70.

On the upside, the EUR/JPY cross rises toward the nine-day EMA at 184.07, followed by 185.02. A break above these moving averages would cause a bullish shift and support the currency cross to explore the region around the all-time high of 187.95, which was recorded on April 17.

EUR/JPY: Daily Chart

(The technical analysis of this story was written with the help of an AI tool. Know more.)

Euro Price Today

The table below shows the percentage change of Euro (EUR) against listed major currencies today. Euro was the weakest against the Japanese Yen.

USD EUR GBP JPY CAD AUD NZD CHF
USD -0.08% 0.06% -0.63% 0.09% -0.13% -0.08% 0.15%
EUR 0.08% 0.13% -0.61% 0.16% -0.07% 0.04% 0.18%
GBP -0.06% -0.13% -0.70% 0.00% -0.20% -0.09% 0.08%
JPY 0.63% 0.61% 0.70% 0.66% 0.42% 0.54% 0.67%
CAD -0.09% -0.16% -0.00% -0.66% -0.23% -0.12% 0.00%
AUD 0.13% 0.07% 0.20% -0.42% 0.23% 0.10% 0.29%
NZD 0.08% -0.04% 0.09% -0.54% 0.12% -0.10% 0.19%
CHF -0.15% -0.18% -0.08% -0.67% -0.01% -0.29% -0.19%

The heat map shows percentage changes of major currencies against each other. The base currency is picked from the left column, while the quote currency is picked from the top row. For example, if you pick the Euro from the left column and move along the horizontal line to the US Dollar, the percentage change displayed in the box will represent EUR (base)/USD (quote).

Source link

2 08, 2026

ING Euro-to-Dollar Forecast: EUR/USD Rally Has Further To Run, But 1.16 A Stretch

By |2026-08-02T22:34:23+03:00August 2, 2026|Forex News, News|0 Comments

ING expects EUR/USD to remain supported around 1.1500 following the sharp Dollar selloff, although a sustained move above 1.1600 would require a further dovish repricing of US interest rates.

The Euro to US Dollar exchange rate (EUR/USD) gained just over 1% in July, recovering from a monthly low near 1.1354 and reaching a high around 1.1547.

EUR/USD pair remains 1.7% lower for 2026, having fallen from January’s peak at 1.2075 to a year-to-date low of 1.1325 in June.

EUR/USD exchange rate performance over 48h chart
Image: EUR/USD exchange rate performance over 48h chart

The latest 48-hour chart above shows the pair rising from below 1.1440 to above 1.1530, leaving it close to the upper end of its recent range. The daily chart also shows EUR/USD moving back above its 20-day moving average, although it remains close to the declining 50-day average.

ING believes the sharp change in Dollar momentum leaves the Euro better supported in the near term.

The Greenback came under pressure after the Federal Reserve delivered a more dovish message than markets had expected. Investors were left questioning whether policymakers would follow through on their inflation-fighting rhetoric with actual rate increases.

The US Dollar’s decline accelerated after US core PCE inflation rose only 0.1% in June and second-quarter growth undershot expectations.

Suspected Japanese intervention against the Yen added to the pressure by triggering a sharp fall in USD/JPY and spilling over into broader Dollar sentiment.

Positioning may also keep the move going.

ING estimates that speculative long-Dollar exposure against other major currencies was at its most stretched since January 2025, while leveraged funds held their largest EUR/USD short positions since 2021.

According to the bank, “there may still be room for further USD long-squeezing”, making it too early to call a firm bottom in the Dollar selloff.

Analysts at ING note EUR/USD broke through 1.1500 “with little resistance” and expects the level to attract buyers for a while longer.

The bank sees near-term risks tilted towards further Euro gains, although it is cautious about chasing a sustained move above 1.1600.

Such a break would probably require another material repricing lower in US rates, together with an easing in Middle East tensions.

EUR/USD Year-to-Date historical chart
Image: EUR/USD Year-to-Date historical chart

For now, ING expects buyers to continue emerging around 1.1500, with 1.1600 marking the more difficult test for the recovery.

Exchange Rates UK Research

Our currency coverage draws on live market data, official economic releases and published bank research.

Source link

2 08, 2026

Pound To Euro Forecast 2026–2028: Latest Survey Poll Shows GBP Easing From 1.17

By |2026-08-02T18:33:30+03:00August 2, 2026|Forex News, News|0 Comments

Exchange Rates UK Research’s latest August 2026 survey of major investment banks suggests the Pound to Euro exchange rate is trading above where most institutions believe it will settle over the medium term.

With GBP/EUR currently at 1.1694, close to its highest level in more than a year, the majority of banks expect the exchange rate to drift back towards 1.14-1.16 through 2027.

Only a handful of institutions forecast sterling strengthening beyond 1.19.

GBP/EUR exchange rate forecasts chart - survey results August 2026
Image: GBP/EUR exchange rate forecasts chart – survey results August 2026

Latest Survey Suggests Sterling’s Outperformance May Moderate

The latest Exchange Rates UK Research poll reveals a more balanced outlook than recent price action would suggest.

Bullish forecasts from Bank of America, UBS and Credit Agricole see GBP/EUR holding between 1.18 and 1.20, implying Pound Sterling can maintain most of its recent gains.

However, the majority of banks – including Citi, CIBC, Goldman Sachs, HSBC, ING, MUFG, Natixis, Nomura, Rabobank, SEB and Scotiabank – expect the pair to ease back into the 1.12-1.16 region over the next 12 to 24 months.

Overall, the survey average points to modest Pound Sterling weakness from current levels rather than another sustained leg higher.

That outlook follows a strong rally.

GBP to EUR exchange rate performance over last six months
Image: GBP to EUR exchange rate performance over last six months

GBP/EUR has climbed steadily over the past four months, rising from around 1.14 in March to almost 1.17, with July marking a third consecutive monthly gain.

The pair is now trading at its strongest levels since mid-2025 after advancing around 2.5% over the period.

GBP/EUR 5-year chart
Image: GBP/EUR 5-year chart

BoE Advantage Narrowing as ECB Turns More Hawkish

A recurring theme across the latest forecasts is that the interest-rate advantage which has underpinned sterling may begin to narrow.

The Bank of England kept Bank Rate unchanged at 3.75% this week, but the decision was accompanied by a three-way split on the Monetary Policy Committee and fresh warnings that energy-driven inflation risks remain elevated.

Meanwhile, the European Central Bank has also paused, but policymakers continue to signal that another interest-rate increase remains possible if higher energy prices feed through into broader inflation pressures.

Eurozone inflation unexpectedly accelerated to 2.9% in July, reinforcing expectations that the ECB could tighten policy again later this year.

This has reduced expectations that UK interest rates will remain significantly above those in the Eurozone for an extended period.

GBP/EUR Outlook: Consensus Favours Gradual Retreat Rather Than Sharp Reversal

The latest Exchange Rates UK Research survey suggests the pound remains fundamentally well supported, but that much of the recent good news may already be reflected in current exchange rates.

Rather than forecasting a sharp reversal, most banks expect GBP/EUR to gradually move back towards the mid-1.10s as monetary policy differences become less pronounced and Eurozone fundamentals improve.

For businesses and holidaymakers buying euros, today’s exchange rate remains close to the strongest seen for more than a year.

If the latest survey proves accurate, these levels could represent some of the most favourable buying opportunities before GBP/EUR settles back towards longer-term equilibrium.

Source link

2 08, 2026

Interest Rate Forecast: BOJ Eyes September Hike as Yen Intervention Pressures USDJPY

By |2026-08-02T14:32:29+03:00August 2, 2026|Forex News, News|0 Comments

However, if the pair continues to drop below the 157 level, it will open the door for a continued decline toward the 152 area. This level is marked by the red dotted support line.

But the RSI indicator shows an extremely oversold condition in the short term and indicates a rebound before the next drop. A recovery above 161.50 will suggest that the bottom has formed. This bottom may allow the pair to continue upside.

In Closing

The BOJ has opened the door to another interest rate hike. Rising producer prices, strong wage growth and higher inflation expectations support the tighter policy. The weak yen also increases imported inflation. In my view, the BOJ may raise the policy rate to 1.25% in September or October. It could delay the move if inflation eases or the yen continues to recover.

The higher Japanese interest rates could place further pressure on USDJPY. A continued decline below 157 may push the pair toward the 150-152 area. But the oversold conditions could trigger the short term rebound first. A recovery above 161.50 would indicate that the bottom is confirmed and the pair is ready to move higher again.

Read more: BOJ Rate Hike to 1.25% Puts Japanese Yen in Focus

Source link

1 08, 2026

EUR/USD Forecast: Chair Warsh ambiguity hits the US Dollar

By |2026-08-01T14:27:17+03:00August 1, 2026|Forex News, News|0 Comments

The EUR/USD pair closes July with modest gains near the 1.1500 mark, adding over 1.1% in the last trading week. Price action throughout the month was dull to say the least as investors remained clueless, although the pair managed to hit 1.1530 ahead of the close. The lack of action was compounded by persistent uncertainty, centered on developments in the Middle East and the United States (US) Federal Reserve’s (Fed ) monetary policy path.

Regarding the first, an escalation of the US-Iran war spurred US Dollar (USD) demand at the beginning of the week after continued tit-for-tat attacks around the Strait of Hormuz, which, by the way, is once again closed. Mood improved early in the week amid a pause in attacks and headlines suggesting a fresh round of negotiations.

Renewed war headlines, however, were quickly overshadowed by the US Fed monetary policy announcement on Wednesday. The USD plunged after the central bank decided to leave the benchmark rate unchanged, with the split vote leaving it at a range of 3.50%-3.75%. Three regional bank presidents dissented, preferring an immediate 25-basis-point (bps) rate hike: Cleveland’s Beth Hammack, Minneapolis’s Neel Kashkari, and Dallas’s Lorie Logan.

Chairman Kevin Warsh chickens out

The USD collapsed following the Fed’s decision as investors believed Chair Warsh had chickened out. He kept repeating his commitment to curb inflation and to price stability, but the Fed left rates unchanged for the fifth consecutive meeting.

Of course, he did not provide clear guidance on the future path of monetary policy, not actually a surprise. And he failed to specify how he intends to resolve five-year-long inflationary pressure despite affirming that there is no “soft” inflation target.

“We are on the job, we will deliver, we are focused like a laser on making sure we can do it, but the suggestion that we’re going to be able to do it with our magic wand is one I want to disabuse you and everyone else of,” Warsh said.

Market players did not take well to the myriad empty words and the lack of action. However, bets on a September rate hike have increased after the dust settled. According to the CME FedWatch Tool, the chances of a hike increased to 65% from 55% one week before the Federal Open Market Committee (FOMC) announcement.

Still, there’s a long way ahead of September, and loads could happen in the way. The focus will remain on data — inflation and employment figures — and Middle East developments.

Meanwhile, the US published the preliminary estimate of the Q2 Gross Domestic Product (GDP), which showed that the economy expanded at an annual rate of 1.5%, missing expectations and below the Q1 reading of 2.1%. Other details of the report showed that the GDP Price Index jumped to 6.3% in Q2 from 3.6% in Q1, while the quarterly core Personal Consumption Expenditures (PCE) Price Index, the Fed’s favorite inflation gauge, increased 3.3% on a yearly basis, matching the market expectation. In June, the core PCE Price Index ticked lower on a yearly basis, to 3.3% from 3.4% in May, still far above the Fed’s 2% goal.

Middle East crisis here to stay

US President Donald Trump said for the umpteenth time on Friday that the war is “going well” and that the US “keeps winning.” No strikes between Washington and Tehran were reported by the end of the week, a short truce that at least was enough to contain fears. Still, unrest leads the region as traffic through the Strait of Hormuz declined to the levels seen before the Memorandum of Understanding (MoU), while Kuwait and Egypt reported Iranian attacks early Friday.

On a positive note, US President Trump announced an historic agreement to secure the disarmament of Hamas, while a senior Hamas official confirmed it to CNN, contingent on Israel upholding its obligations. This is the first time Hamas has agreed to a specific plan to hand over weapons.

The song remains the same: the US demands Iran drops its nuclear program, while Iran requests full control of the critical sea passage. Neither side is willing to give up on those terms.

Euro finds support in data

Data coming from Europe provided support to the Euro: Germany and the Eurozone (EU) released the preliminary estimates of the Q2 GDP. Annualized growth in Germany rose 0.9%, modest yet better than the 0.4% posted in Q1. The EU figure printed at 1%, up from the previous 0.3%.

German inflation met expectations as the preliminary estimate of the July Harmonized Index of Consumer Prices printed at 2.8% YoY, higher than the 2.4% from June. The EU HICP in the same period resulted in 2.5%, in line with expectations and slightly above the previous 2.4%.

Still, financial markets price in roughly a 65% probability that the European Central Bank (ECB) will deliver a 25 bps rate hike at the September meeting. Again, too early to speculate about that.

Regardless, European data was encouraging enough to spook concerns, which ended up helping the Euro on its way north. It should not be a surprise, however, if the Greenback resumes its rally on the back of war-related fears.

What’s next in the docket

The first week of August will be a busy one. Germany will kick-start macroeconomic releases by publishing June Retail Sales, while the US will publish the ISM Manufacturing Purchasing Managers Index (PMI) on Monday. The ISM Services PMI will be out on Wednesday, while EU June Retail Sales are scheduled for Thursday.

S&P Global, alongside local banks, will release the final estimates of the July PMIs for major economies throughout the week.

Midweek, the focus will turn to employment as the US releases June JOLTS Job Openings, the July ADP Employment Change report, and July Challenger Job Cuts ahead of the July Nonfarm Payrolls (NFP) report scheduled for Friday. The US is expected to have added 91K new jobs in the month, up from the 57K added in June, while the Unemployment Rate is foreseen at 4.3%, up from the 4.2% posted in June.

EUR/USD Technical Outlook:

From a technical perspective, based on the daily chart, EUR/USD has partially recovered its bullish poise. The pair has run past a now mildly bullish 20-day Simple Moving Average (SMA) at 1.1430, although it remains below the 100-day and 200-day simple SMAs at 1.1568 and 1.1631, respectively, keeping the broader backdrop bearish despite the latest bounce. The 14-day Relative Strength Index (RSI) indicator turned lower but stands at 58, while the Momentum indicator holds flat above its midline, suggesting that buying interest has improved, though not enough to confirm a trend change.

Chart Analysis EUR/USD

In the weekly chart, EUR/USD maintains a mildly bearish near-term bias, holding below the 20-week SMA at 1.1565 while still trading above the 100- and 200-week SMAs at 1.1311 and 1.1032, respectively. Technical indicators have rotated higher, but remain below their midlines, reflecting the latest advance yet far from suggesting a bullish extension ahead.

On the topside, initial resistance is at the 100-day SMA near 1.1568, with the 200-day SMA at around 1.1631 as the next significant barrier if buyers extend the advance. On the downside, immediate support emerges at the 20-day SMA at 1.1424, where a break would expose a deeper pullback toward the June low at 1.1324.

(The technical analysis of this story was written with the help of an AI tool. Know more.)

Fed credibility questions underpin USD SSA spreads as EUR and GBP seen outperforming

According to TD Securities, recent price action has seen “US swap spreads have tightened, and the yield curve has steepened,” reshaping relative value across rates and credit markets. The bank argues that “questions around the Fed’s credibility are supportive for USD SSA G-spreads,” and, in this context, it “look[s] for front-end EUR and GBP to outperform vs USD” as investors reassess opportunities along the front end of major curves.

Source link

Go to Top