The main tag of Forex News Today Articles.
You can use the search box below to find what you need.
[wd_asp id=1]
1
04, 2025
Weekly Forex Forecast For DXY, EURUSD, GBPUSD, USDJPY, And XAUUSD (March 31-April 4, 2025)
The forex market is stuck in a sideways range, but a breakout could be on the horizon.
In today’s video, I’ll show you how I’m trading the DXY, EURUSD, GBPUSD, USDJPY, and XAUUSD this week.
Don’t miss it!
US Dollar Index (DXY) Forecast
Like most of the forex market, the DXY has been in a sideways range since early March, trading between 103.00 and 105.00.
However, the USD index has yet to test the 103.00 trend line from 2023 or the descending trend line at 105.00.
That tells me we could see recent highs and lows get swept before the next big move.
For now, I’m anticipating more sideways action until the DXY can prove it’s ready for a breakout.
EURUSD Forecast
EURUSD is also stuck in a sideways range between 1.0777 support and the 1.0900 resistance area.
The euro continues to hold below the 1.0900 region on a weekly closing basis, which aligns with a trend line from late 2022.
It’s tough to justify trading EURUSD while it’s range-bound between these two levels, especially without a clear signal.
 2")
GBPUSD Forecast
GBPUSD has struggled to gain momentum since March 5th after a sharp three-day rally.
While I think there’s potential for more upside, I wouldn’t want to go long without a proper test of 1.2830.
That level would clear out liquidity below recent lows and give bulls a clear invalidation point.
There’s also a chance we see a sweep of recent highs first to fully retest the 1.3050 resistance.
As always, it’s a waiting game to see which scenario plays out first.
 3")
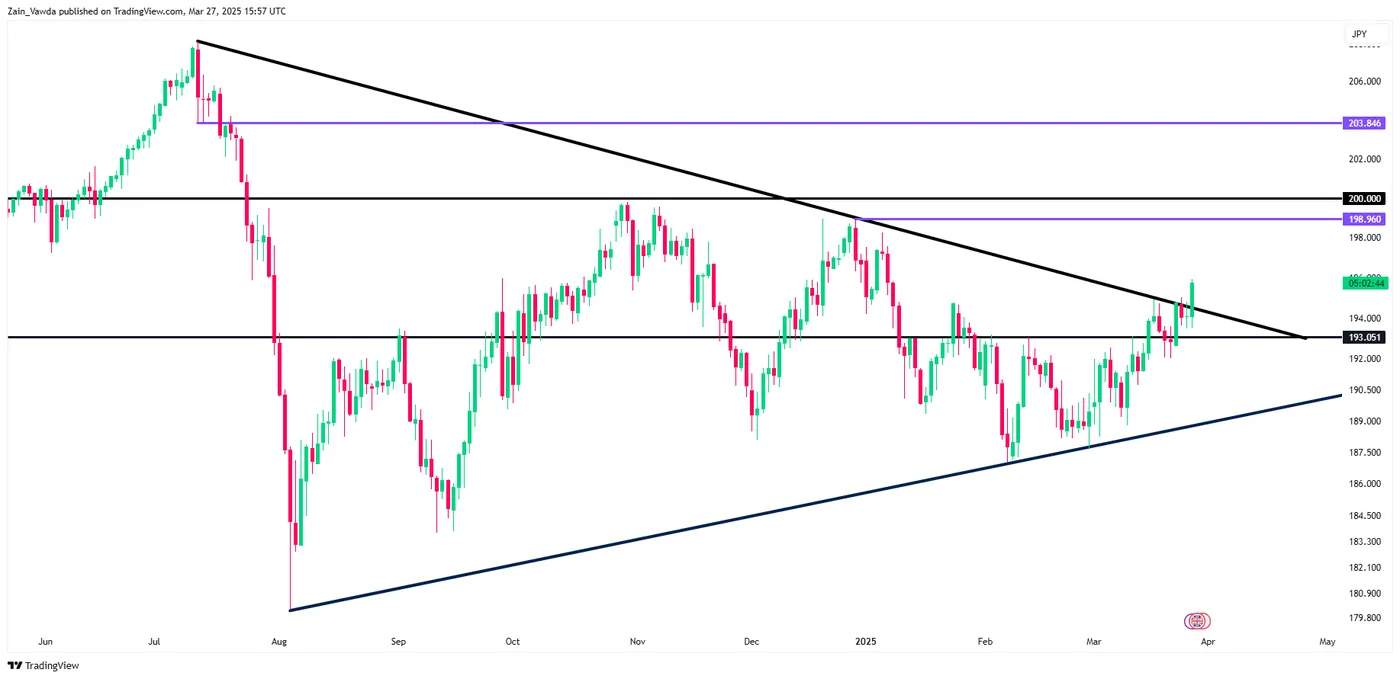
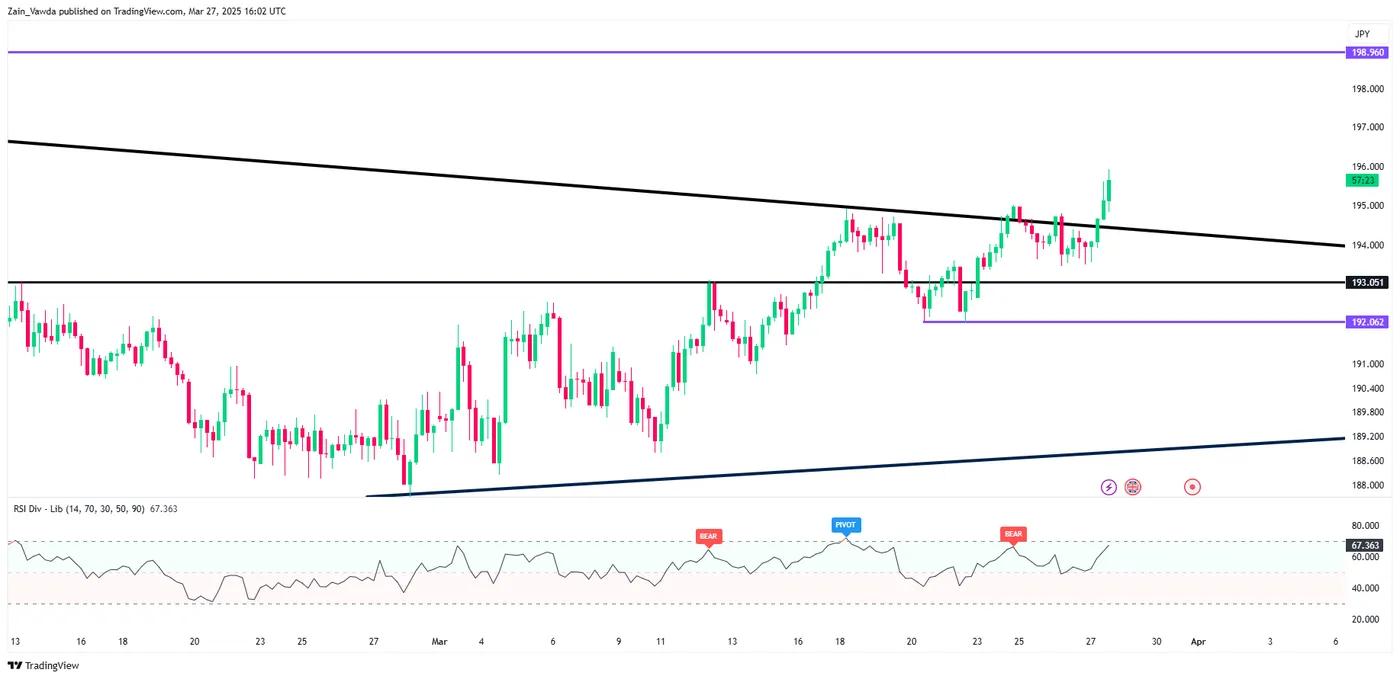
USDJPY Forecast
USDJPY has some of the cleanest levels in the forex market right now.
The pair recently broke below 148.64, but sellers couldn’t keep prices down.
The move back above 148.64 confirmed the sell-side fakeout and put 151.24 back in play.
For now, USDJPY is sideways, just like much of the forex market.
A sustained break above 151.24 would open the door to 154.80, while a break below 148.64 would expose the 146.60 lows again.
 4")
XAUUSD (Gold) Forecast
Gold is going parabolic again this week after breaking above the 2024 ascending channel.
Monday’s session confirmed the breakout with a retest of the level as new support.
Right now, XAUUSD bulls are in full control, so buying pullbacks seems like the best play for intraday traders.
However, if this breakout fails and gold drops back below $3,080 on the high time frames, we could see XAUUSD revisit $3,000 or even lower.
That would signal a failed breakout, which often leads to extended moves in the opposite direction.
But as long as $3,080 holds as support, there’s no reason to be bearish on gold.
 5")

")

")
")

")


