Copper price settled above $4.7500 level, increasing the efficiency of the suggested bullish trend, hitting 4.8500 level again.
The unionism of the main indicators to provide positive momentum by forming extra support at $4.5600 level, these factors will support renewing the bullish attempts, that target $4.9500 level reaching the next main target near 5.3200.
The expected trading range for today is between $4.6700 and 4.9500
There is the potential for choppy range trading on the last day of the month. The latest US job openings data will also be important while markets will be monitoring US political developments closely with the threat of a government shutdown on Wednesday.
UoB commented; “Based on the current momentum, any further advance is unlikely to threaten the major resistance at 1.3525. On the downside, support levels are at 1.3415 and 1.3395.”
According to Scotiabank; “we remain neutral in the absence of a break back above 1.35.”
As far as US politics is concerned, the immediate focus will be on the risk of a government shutdown with the current funding due to expire today.
A meeting between President Trump and congressional leaders failed to make headway amid deep divisions.
The implications of any shutdown could be more serious than usual given the labour-market impact.
Government workers are usually furloughed during a shutdown, but this time the Administration has pledged to fire workers and not re-hire those that are not considered essential.
There are also a huge number of Federal workers who will officially leave their jobs at the end of September after receiving a six-month redundancy package earlier in the year.
With jobs data watched very closely, any shutdown could also lead to Friday’s scheduled employment report being postponed.
MUFG commented; “As result, market participants are wary that a government shutdown could prove more disruptive this time around depending as well on how long it remains in place.”
According to Brown Brothers Harriman senior markets strategist Elias Haddad; “A prolonged shutdown (more than two weeks), increases the downside risk to growth and raises the likelihood of a more accommodative Fed.”
The latest UK data did not have a major impact with annual GDP growth revised to 1.4% from 1.2% due to historic revisions. There are, however, still expectations of tax increases in November.
Standard Chartered commented on the outlook; “The BOE is likely to enter a protracted pause and the focus will shift to the UK’s Autumn Budget (26 November). The UK’s deficit remains sizable but is likely to improve, easing fears of a fiscal crisis. However, a reliance on tax hikes could weigh on growth and cap GBP gains.”
Like this piece? Please share with your friends and colleagues:
International Money Transfer? Ask our resident FX expert a money transfer question or try John’s new, free, no-obligation personal service! ,where he helps every step of the way,
ensuring you get the best exchange rates on your currency requirements.
Read the full USD/JPY forecast, including chart setups and trade ideas.
As traders consider the BoJ’s views on the Tankan survey, attention is also turning to the AUD/USD as Aussie inflation and labor market data cloud the RBA’s policy outlook.
Ai Group Industry Index Dips, Spotlighting the Aussie Dollar
Turning focus to the AUD/USD pair, the Ai Group Industry Index fell from -13.9 in August to -16.0 in September, weighing on the Aussie dollar.
The Index provides insights into the economic outlook as survey respondents across the private sector answer questions about employment, new orders, and production.
A softer number could signal weaker demand and a cooling labor market. Rising unemployment may soften wage growth, curbing consumer spending. A pullback in spending may dampen inflation, supporting the case for an RBA rate cut in November.
The AUD/USD pair briefly climbed to $0.66183 before falling to $0.66042 after the softer data.
AUD/USD: Key Scenarios to Watch
Bearish AUD/USD Scenario: Dovish RBA chatter and rising trade friction may push AUD/USD toward $0.655.
Bullish AUD/USD Scenario: Hawkish RBA comments and easing trade tensions could send AUD/USD toward $0.665.
See our full AUD/USD analysis for detailed trends and trade setups.
US Labor Market Data and the Interest Rate Differential
Amid rising uncertainty about a November RBA rate cut, US labor market data could provide greater clarity on Fed policy this week.
A marked increase in nonfarm payrolls may temper bets on an October Fed rate cut. A more hawkish Fed rate path could widen the US-Aussie interest rate differential, favoring the US dollar and pushing AUD/USD toward the 50-day EMA ($0.65556).
On the other hand, a lower print may fuel speculation about multiple Fed rate cuts in the fourth quarter, narrowing the rate differential. A more dovish Fed policy stance could send AUD/USD toward $0.665.
The US dollar has fallen after initially trying to recover against the Japanese yen. It is sitting on top of the 200-day EMA, so we’ll see if that holds. It could end up being a buying opportunity. A move above the 149 yen level would be confirmation that there are plenty of buyers here, but we’ll just have to wait and see how that plays out.
A breakdown below the 50-day EMA opens up a move back down to the 146-yen level. I do think choppiness is the order of the day, but really at this point in time, the Japanese yen, despite the fact that it has recovered the last couple of days, is not a currency I want to own.
AUD/USD Technical Analysis
The Australian dollar has broken higher again and now finds itself above the 0.66 level, perhaps making its way towards the 0.67 level over time. This is an interesting market because it has underperformed most of its colleagues against the US dollar. But at this point, maybe it’s finally starting to get a little bit more sustainable in its move higher. It is worth noting that the Australians kept their interest rate at the same level in the early hours of the day. So maybe that’s part of what it is. They just aren’t cutting as they stay at 3.6%.
All things being equal though, I am a little bit leery of getting aggressive until we can clear the top of the candlestick from last Wednesday, which isn’t too far away. It’s somewhere right around 0.6630. I think above there, then you have a little bit more confirmation. Otherwise, we may spend some time consolidating in this general vicinity.
For a look at all of today’s economic events, check out our economic calendar.
The Pound to US Dollar (GBP/USD) exchange rate was muted on Tuesday as the US released its latest JOLTs job openings and the UK published its latest GDP reading.
At the time of writing, GBP/USD was trading at approximately $1.3444, virtually unchanged from the start of Tuesday’s session.
The US Dollar (USD) came under pressure on Tuesday, slipping against several major peers despite the release of stronger-than-expected labour market data.
August’s JOLTs job openings surprised to the upside, rising from a upwardly revised 7.208 million to 7.227 million, slightly above the 7.2 million forecast.
However, the upbeat figures failed to translate into meaningful support for the ‘Greenback’.
Investor caution surrounding the risk of a potential US government shutdown kept USD exchange rates on the back foot throughout Tuesday’s European session.
The Pound (GBP) traded in a subdued manner on Tuesday, showing little clear direction against its major peers.
Save on Your GBP/USD Transfer
Get better rates and lower fees on your next international money transfer.
Compare TorFX with top UK banks in seconds and see how much you could save.
Sterling received only limited support from the release of the UK’s latest GDP data, which indicated a slower-than-expected pace of economic contraction.
The year-on-year growth figure for Q2 2025 fell from 1.7% to 1.4%, slightly outperforming forecasts that had predicted a drop to 1.2%.
Although the reading suggested some resilience in the UK economy, it was insufficient to spark a meaningful rally in the Pound.
As such, GBP exchange rates remained largely contained, weighed down by ongoing concerns over the broader economic outlook.
GBP/USD Forecasts: PMIs in Focus
Looking ahead to Wednesday’s European session, the GBP/USD exchange rate is likely to be influenced by the latest manufacturing PMI releases from both the US and the UK.
In the US, the ISM manufacturing PMI is expected to show a modest uptick, though it is still forecast to remain in contraction territory (a figure below 50).
If the data meets expectations, it could weigh on the US Dollar and limit its mid-week gains.
For the Pound, the UK will release its S&P Global manufacturing PMI.
While this report typically carries less influence than the UK’s services index, the sector is also forecast to remain firmly in contraction.
A weaker-than-expected reading could underscore ongoing challenges in UK manufacturing, potentially placing pressure on Sterling during the mid-week European session.
Like this piece? Please share with your friends and colleagues:
International Money Transfer? Ask our resident FX expert a money transfer question or try John’s new, free, no-obligation personal service! ,where he helps every step of the way,
ensuring you get the best exchange rates on your currency requirements.
Important DisclaimersThe content provided on the website includes general news and publications, our personal analysis and opinions, and contents provided by third parties, which are intended for educational and research purposes only. It does not constitute, and should not be read as, any recommendation or advice to take any action whatsoever, including to make any investment or buy any product. When making any financial decision, you should perform your own due diligence checks, apply your own discretion and consult your competent advisors. The content of the website is not personally directed to you, and we does not take into account your financial situation or needs.The information contained in this website is not necessarily provided in real-time nor is it necessarily accurate. Prices provided herein may be provided by market makers and not by exchanges.Any trading or other financial decision you make shall be at your full responsibility, and you must not rely on any information provided through the website. FX Empire does not provide any warranty regarding any of the information contained in the website, and shall bear no responsibility for any trading losses you might incur as a result of using any information contained in the website.The website may include advertisements and other promotional contents, and FX Empire may receive compensation from third parties in connection with the content. FX Empire does not endorse any third party or recommends using any third party’s services, and does not assume responsibility for your use of any such third party’s website or services.FX Empire and its employees, officers, subsidiaries and associates, are not liable nor shall they be held liable for any loss or damage resulting from your use of the website or reliance on the information provided on this website.Risk DisclaimersThis website includes information about cryptocurrencies, contracts for difference (CFDs) and other financial instruments, and about brokers, exchanges and other entities trading in such instruments. Both cryptocurrencies and CFDs are complex instruments and come with a high risk of losing money. You should carefully consider whether you understand how these instruments work and whether you can afford to take the high risk of losing your money.FX Empire encourages you to perform your own research before making any investment decision, and to avoid investing in any financial instrument which you do not fully understand how it works and what are the risks involved.
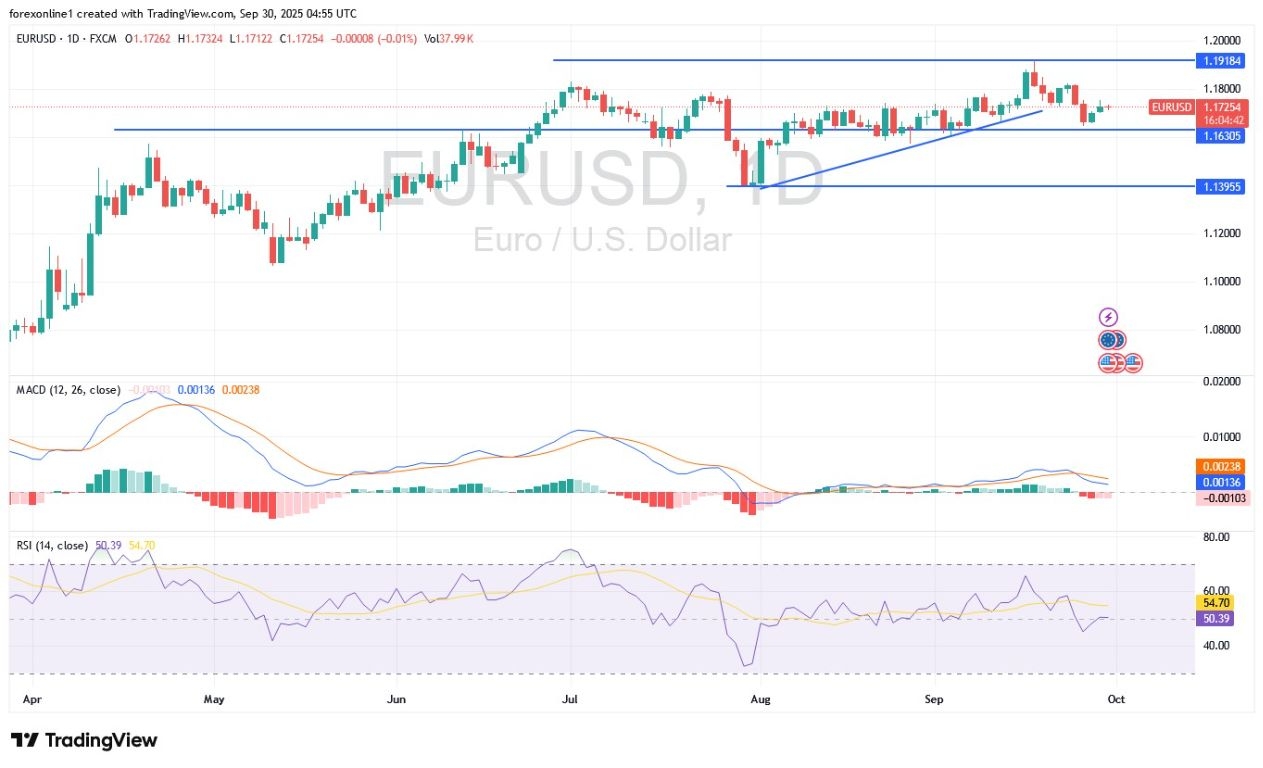
Support points for the EURUSD today: 1.1680 – 1.1600 – 1.1540.
Resistance points for the EURUSD today: 1.1760 – 1.1820 – 1.1900.
EUR/USD Trading Signals:
Buy the EURUSD from the support level of 1.1600, target 1.1760, and stop 1.1520.
Sell the EURUSD from the resistance level of 1.1820, target 1.1600, and stop 1.1900.
Technical Analysis of EUR/USD Today:
Based on recent performance across reliable trading platforms, the EUR/USD pair is undergoing a corrective decline towards a broken support area, following a sharp drop from its high of 1.1822. The Euro/Dollar pair appears to be testing key resistance levels that align with Fibonacci retracement levels, forming a potential clustering area where sellers may be waiting for an opportunity to reinforce the downtrend.
The Euro/Dollar price is currently hovering around the 38.2% Fibonacci retracement level at 1.1755, which represents the first major resistance level in this correction. Any further drop may target the 50% Fibonacci level at 1.17545, while strong buying pressure could push the EUR/USD toward the 61.8% level at 1.17553. This last area also coincides with the former broken support zone, which may now act as a dynamic resistance area.
Therefore, if the Fibonacci resistance levels hold and the EUR/USD pair fails to consolidate at current levels, the pair may resume its decline towards the low of 1.1646 or target lower levels. Conversely, a break above the 61.8% Fibonacci level could signal a larger correction towards the psychological level of 1.1800. The moving average indicator shows that the 100-period simple moving average has fallen below the 200-period simple moving average, confirming the prevailing downtrend. This bearish crossover suggests that the decline may continue, and the two dynamic levels may act as additional resistance in the event of any attempt to rise.
However, price momentum indicators are showing some signs of recovery. The Stochastic indicator has risen from oversold territory and is currently indicating an uptrend, suggesting that buying pressure may emerge in the near term. The indicator still has room to rise before reaching overbought territory, suggesting that the correction may continue. The Relative Strength Index (RSI) also reflects the current recovery attempt, having risen from severe oversold levels. The index remains below the central level, but it appears to be gaining momentum, which may indicate that buyers are beginning to intervene at these levels.
Trading Tips:
Keep in mind that the EUR/USD exchange rate may be influenced by the preliminary Eurozone Consumer Price Index (CPI) data, in addition to key US labor market indicators ahead of the Non-Farm Payrolls (NFP) announcement on Friday.
EUR/USD in a volatile position
The Euro’s upward momentum appears to be increasingly fragile at this stage. The US Dollar started the new week on the back foot, allowing the British Pound and the Euro to stabilize and recover some of their previous losses. However, this weakness comes ahead of the release of important US economic data, including the US ISM Manufacturing PMI and the private sector jobs report on Friday; any better-than-expected data will bolster the US Dollar’s rise.
The EUR/USD exchange rate saw a slight increase from Thursday’s low of 1.1650 to 1.1718 yesterday. The exchange rate has returned to its 9-day exponential moving average, but continued weakness is expected as long as it remains below it. In short, the euro’s strength is expected to be short-lived, as gains will attract sellers and lead to new declines.
The daily chart shows diminishing expectations for the Euro/Dollar: last week’s sell-off surpassed the ascending support line, signaling the end of the September rally.
Recently, US Treasury yields have risen in response to strong US economic data and signals from the Federal Reserve, fueling the dollar’s rise and the euro’s decline. According to forex trading experts, the September Federal Reserve meeting and positive US economic data have contributed to the euro against the dollar remaining within the 1.14-1.18 range since May.
According to the economic calendar, US GDP rose to 3.8% in the second quarter, the highest growth rate in two years. This level of economic growth does not indicate a need for the Federal Reserve to cut interest rates, raising questions about previous market expectations of a rate cut at every meeting this year.
As rate-cut expectations diminish, the US Dollar’s price is rising against other major currencies.
The Pound to Dollar (GBP/USD) exchange rate outlook hinges on jobs data and politics. ING sees a move above 1.35 if US employment figures disappoint, while UoB warns that only a breach of 1.3445 would confirm stability. MUFG stresses that Friday’s payrolls report could extend the dollar rebound if labour-market strength forces a hawkish shift in Fed expectations.
GBP/USD Forecasts: Recovery from 7-Week Lows
The Pound to Dollar (GBP/USD) exchange rate dipped to 7-week lows just below 1.3330 last week before a recovery to 1.3440 on Monday.
UoB commented; “Although downward momentum is starting to slow, we will maintain the same view as long as 1.3445 holds.
It added; “A breach of 1.3445 would indicate that the weakness in GBP from more than a week ago has stabilised.”
ING noted the importance of US jobs data; “So far, support has held at 1.3300 for cable. And US jobs data will help determine whether we end the week over 1.35.”
There will be labour-market releases from Tuesday to Friday, culminating in the pivotal labour-market report.
Save on Your GBP/USD Transfer
Get better rates and lower fees on your next international money transfer.
Compare TorFX with top UK banks in seconds and see how much you could save.
The data will frame the debate surrounding inflation, unemployment and labour markets.
Rabobank commented; “This week will be important for shoring up market judgements about where the balance of risks lays between the price stability mandate and the employment mandate. 2.7% inflation is quite a bit higher than the 2% target, but the Fed has already cut interest rates four times – including a 50bp cut in September last year.”
It added; “Does this suggest that – like the household sector – the FOMC is also more sensitive to labour market deterioration than they are to stubbornly high inflation?”
According to MUFG; “The release of the latest nonfarm payrolls report for September at the end of the week will be important in determining whether the US dollar’s recent rebound will extend further in the near-term.”
It added; “if employment growth picks up helping to close the divergence with stronger economic growth, then it could trigger a bigger hawkish repricing of Fed rate cut expectations and extend the US dollar’s recent rebound.”
US political developments will also be important this week with government funding due to expire at the end of Tuesday.
President Trump is due to meet with Republican and Democrat congressional leaders on Monday in an attempt to prevent a shutdown.
According to ING; “One additional event risk this week is a US government shutdown on Tuesday evening. That’s probably a mild dollar negative if it happens, but it would look unlikely to last long if it did occur.”
ING also looks at the potential political drivers for the Pound with the Labour Party conference in Liverpool; “If sterling can survive that party conference unscathed, then presumably more rhetoric from Bank of England hawks later in the week – including Governor Andrew Bailey – could provide sterling with a little more support.”
Like this piece? Please share with your friends and colleagues:
International Money Transfer? Ask our resident FX expert a money transfer question or try John’s new, free, no-obligation personal service! ,where he helps every step of the way,
ensuring you get the best exchange rates on your currency requirements.
The USD/JPY forecast remains bearish as the BOJ tilts closer to a rate hike.
The risk of a US government shutdown and higher JGB yields support the bearish narrative in USD/JPY.
Markets are now watching the JOLTS job opening data, along with key speeches, for further impetus.
The Japanese yen gained solid ground on Tuesday, pushing the USD/JPY price towards 148.00 handle as markets anticipate the Bank of Japan edging closer to a rate hike, with heightened political uncertainty in Washington threatening the delay of US data releases.
–Are you interested to learn more about ECN brokers? Check our detailed guide-
The BOJ’s September policy meeting revealed that board members were divided, but many reiterated the need for a rate hike sooner, from 0.50% to 0.75%. Rising wage growth and sticky inflation, along with a volatile government bond market, continue to pressure the central bank to act quickly. The 2-year JGB yields hit 0.935%, the highest level since 2008. Weak auction demand triggered speculation about a tighter BOJ policy.
The hawkish shift in BOJ stands in contrast with the US Fed, where markets are pricing in two more rate cuts by the end of 2025. The divergence is giving more strength to the USD/JPY sellers, especially after the growing risk of a US government shutdown. Any delay in the release of US data, such as the NFP, could further erode the dollar’s sentiment, with investors heavily relying on the JOLTs jobs opening data in the meantime.
Japan’s domestic data remains mixed, with retail sales showing the most significant decline since 2021, while industrial production fell for the second consecutive month. However, investors continue to ignore the signs of economic weakness, focusing mainly on the BOJ’s gradual retreat from ultra-loose monetary policy. The safe haven reinforces the narrative, with the yen gaining amid geopolitical tensions and US fiscal uncertainty.
USD/JPY Key Events Ahead:
The significant events due today include:
US JOLTS job openings
US CB Consumer Confidence
Meanwhile, President Trump’s speech, along with Fed member Goolsbee, can also provide impetus to the market.
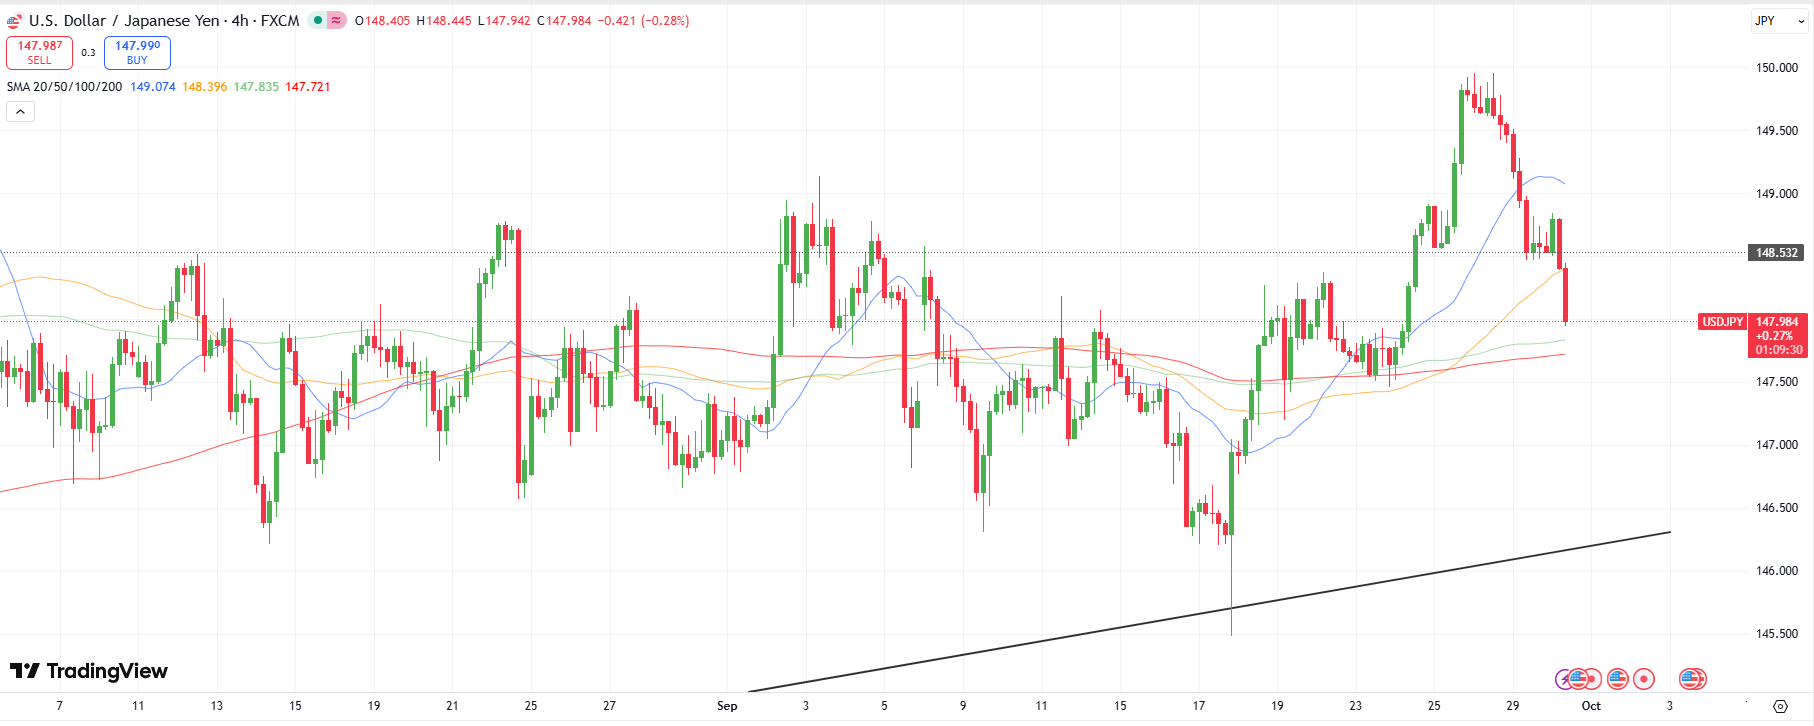
USD/JPY Technical Forecast: Sellers Aiming for 200-MA
USD/JPY 4-hour chart
The 4-hour chart for the USD/JPY shows a growing bearish pressure as the price formed a top near 150.00 and fell below the 20-period MA. The price is now looking to test the confluence of 100- and 200-period MAs around 147.75. A sustained breakout of this level could initiate a deeper correction towards 147.00 and 146.500.
–Are you interested to learn more about making money in forex? Check our detailed guide-
Alternatively, if the price manages to sustain above the 148.00 mark, it could try recapturing the 50-period MA at 148.40 ahead of the 20-period MA near 149.00.
Looking to trade forex now? Invest at eToro!
67% of retail investor accounts lose money when trading CFDs with this provider. You should consider whether you can afford to take the high risk of losing your money.
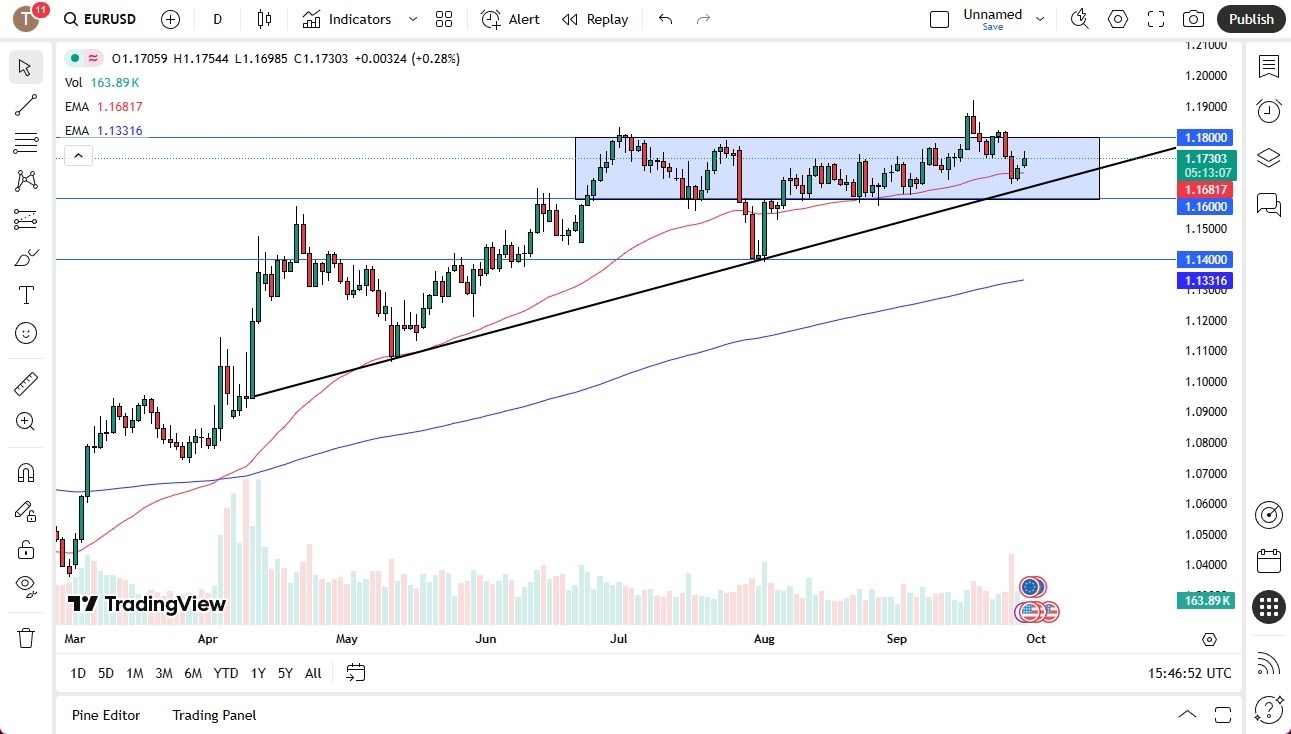
The euro rallied a bit against the US dollar during the trading session on Monday, but it does look like it is struggling to hang on to a certain portion of those gains.
This is a market that I believe is in a major state of flux at the moment and therefore needs to figure out what it is going to be doing for the longer term before we can put significant money to work.
After all, we have been sideways for a while, and despite the fact that we tried to break out a couple of weeks ago, the reality is that we just couldn’t hang onto those gains.
Trend Continues or Not?
At this point, the only question that I’m interested in is whether or not the trend continues or whether or not it doesn’t. Sooner or later, we have to make a decision as to whether or not we are going to continue the uptrend, or if we are going to fall apart. After all, the market is certainly one that isn’t showing a lot of strength, despite the fact that the FOMC cut interest rates recently. In fact, after the press conference, the euro has fallen quite a bit, all things considered. I suspect this is because the Federal Reserve isn’t panicking, and therefore people were worried that they are not going to cut interest rates fast enough.
Interest rates in the United States have been rising as bonds have been selling off, so thereby it makes the United States dollar a bit more attractive. Underneath current trading, we have the 50 Day EMA, a trend line, and then finally the 1.16 level all offering support. This is an area that needs to hold for the euro, or we could see significant selling. If we were to turn around and break above the 1.18 level, then it’s possible that we could go looking at the 1.20 level, but this is not an overly bullish market at the moment. In fact, I think it’s very neutral and asks a lot of questions as to where we go next.
Christopher Lewis has been trading Forex and has over 20 years experience in financial markets. Chris has been a regular contributor to Daily Forex since the early days of the site. He writes about Forex for several online publications, including FX Empire, Investing.com, and his own site, aptly named The Trader Guy. Chris favours technical analysis methods to identify his trades and likes to trade equity indices and commodities as well as Forex. He favours a longer-term trading style, and his trades often last for days or weeks.