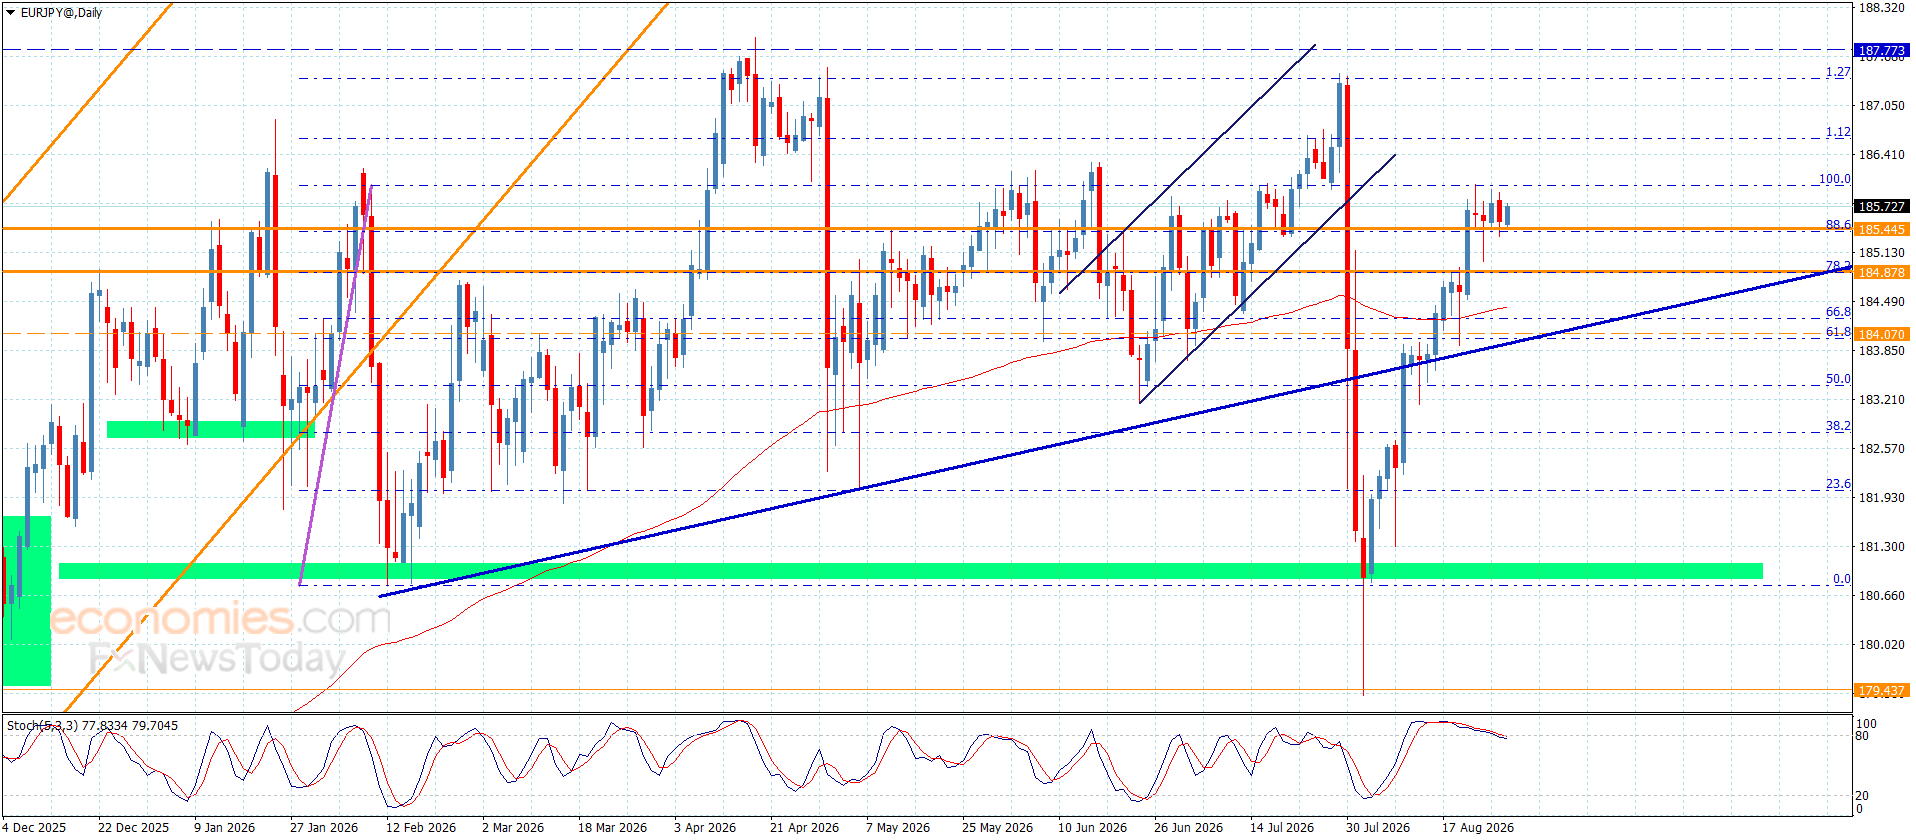
The EURJPY pair resisted the negative pressure that comes from stochastic exit from the overbought level, to settle above the initial support at 184.80 level, to rally higher and settle near 185.70 level.
Note that breaching 186.05 barrier and holding above it is important to confirm its readiness to resume the bullish trend by reaching 186.65 initially reaching 187.30, while the failure to breach this level will increase the chances of forming new corrective waves, to force it suffer some losses by reaching the initial support near 184.80.
The expected trading range for today is between 185.80 and 186.05
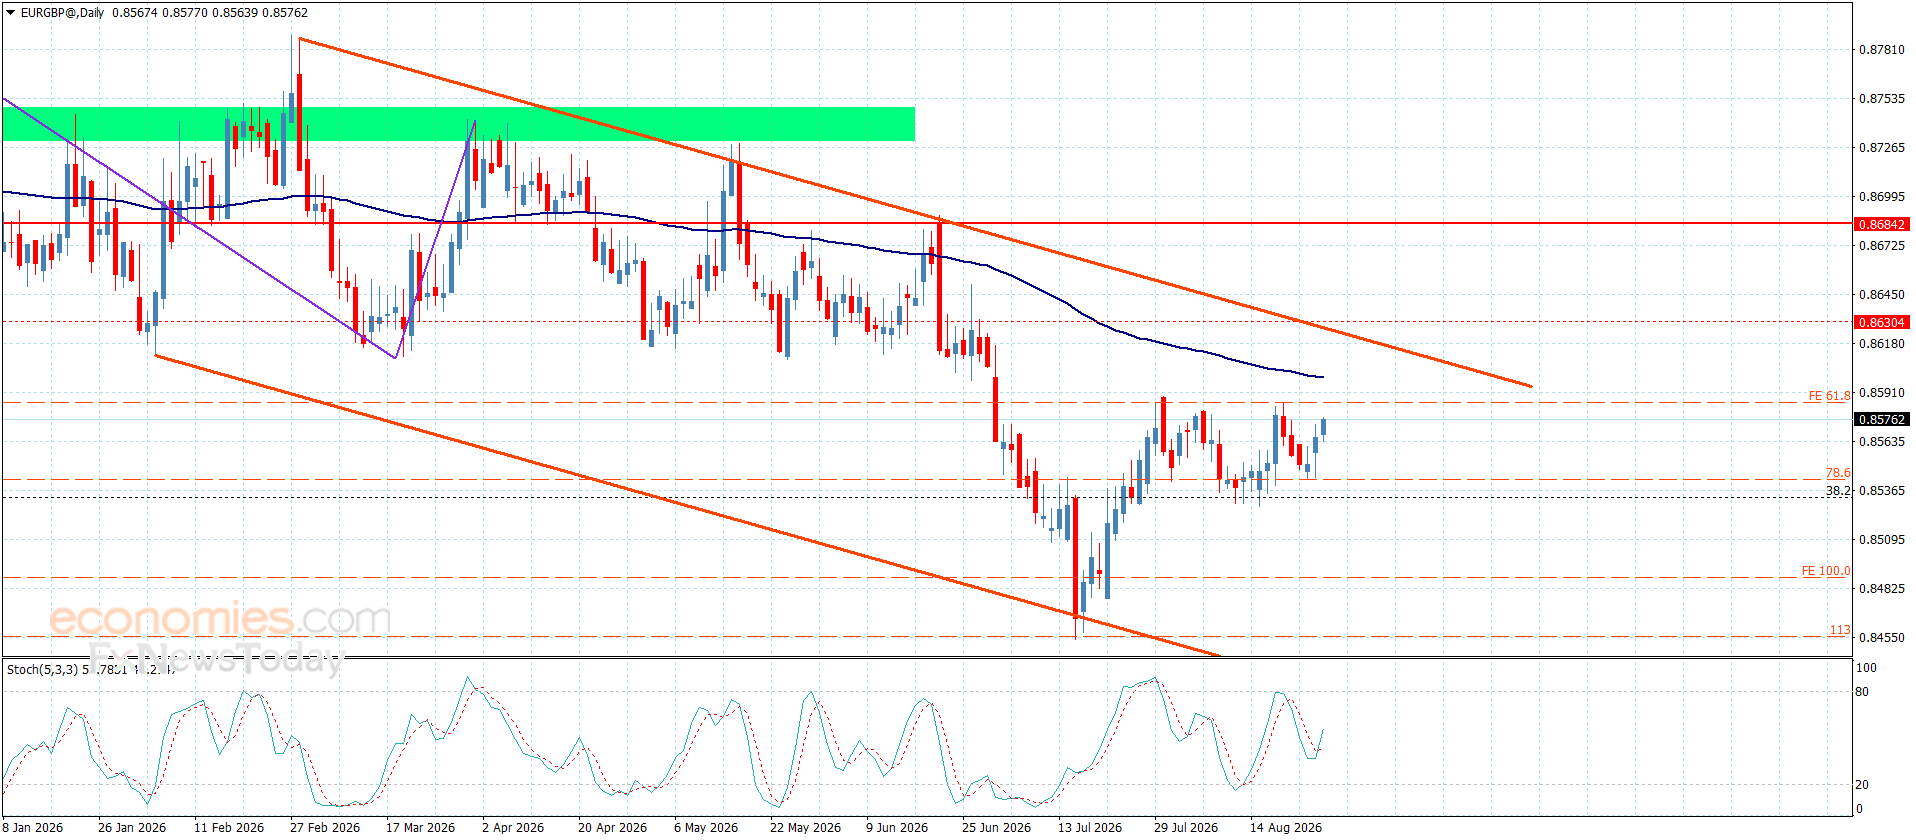
The EURGBP is affected by the continuation of the main indicators, which forces it to delay the bearish trend by its stability above the extra support at 0.8532 level, forming some bullish corrective waves, approaching the barrier at 0.8585.
Note that the stability of the trading within the bearish channel’s levels that appear in the above image and forming additional barriers by the moving average 55 stability near 0.8600 makes us keep the bearish scenario, to keep waiting for gathering extra negative momentum to reach 0.8555, then repeat the pressure on the additional support to find an exit for resuming the main bearish trend.
The expected trading range for today is between 0.8555 and 0.8590
When a currency pair fails to sustain a breakout after six months of upward momentum, the reversal often exposes a structural mismatch between conviction and positioning. GBP/USD has completed a textbook head-and-shoulders pattern and broken below the critical neckline, triggering institutional repositioning away from sterling as accumulated long positions face genuine downside vulnerability. This technical invalidation masks a deeper market assumption: that dollar strength persists on economic data confirmation alone—a vulnerability that central bank communications from Jackson Hole could rapidly overturn.
Some analysts might see this as nothing more than the usual ebb and flow of the Forex market, but could it be that something more significant is going on here with the GBP/USD?
Institutional Positioning and Recent Catalyst
Yesterday’s US Dollar-related high-level economic data releases came in exactly as were widely expected – a 0.2% month-on-month increase in the PCE and Preliminary GDP showing growth at 1.5%. Despite the lack of surprise, it seemed to be the case that getting the data safely out of the way was the catalyst for some institutional positioning. The US Dollar gained as a result, and this suggests that the path of least resistance in a currency pair such as GBP/USD is now switching to bearish rather than bullish.
It is also worth noting that the biggest moves in the Forex market have historically tended to happen on Thursdays.
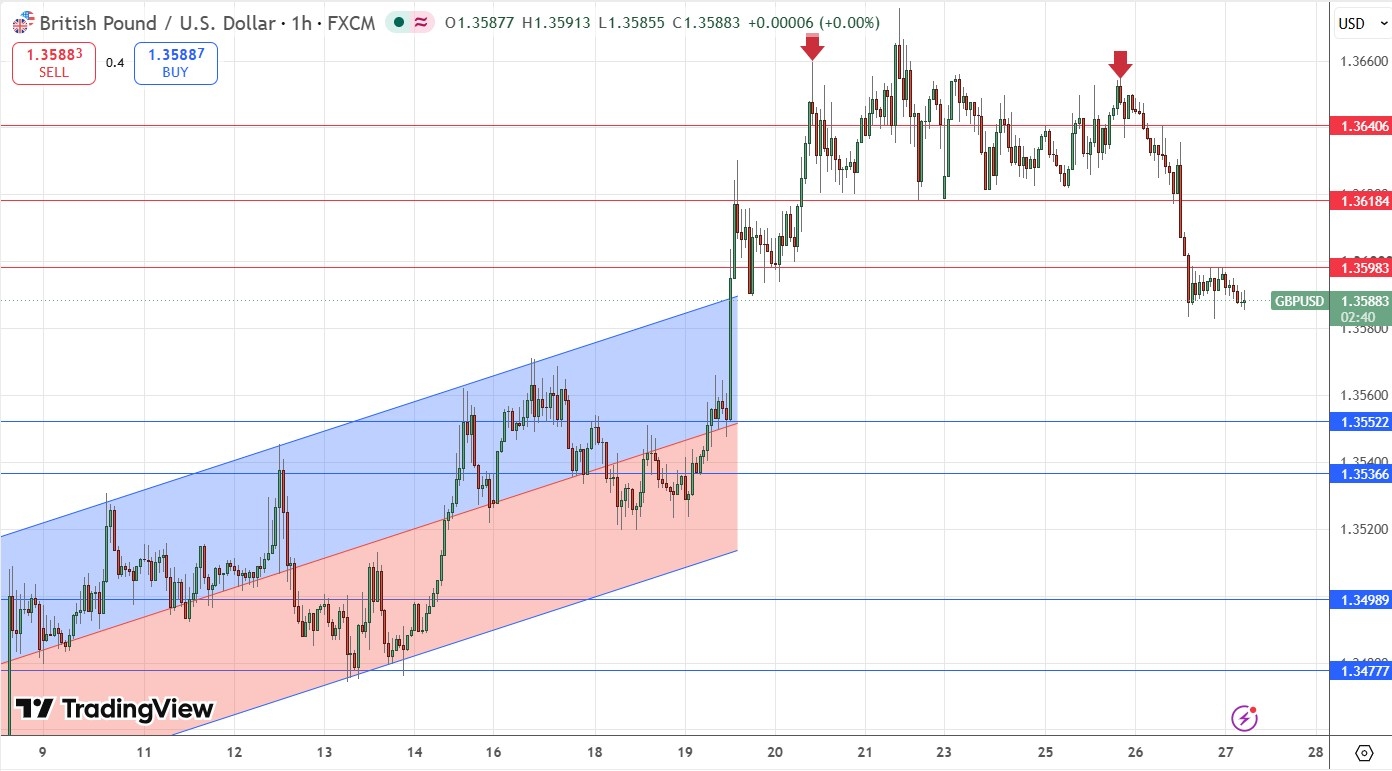
Finally, the price is moving firmly lower after repeatedly testing and eventually failing to break out of the top of its long-term range, with a new 6-month high briefly made, and the price now looking as if it is going to traverse that range in a downwards direction. This might give a strong reward to risk ratio opportunity to short traders.
A few days ago, the technical picture was looking very bullish, and the price was threatening to break well above the 1.3650 area to go on to make fresh 6-month highs. It then began to look as if a bearish head and shoulders chart pattern was forming, but the neckline held. We now see a crucial lower high developed and the price finally pushed below the obvious neckline area near 1.3600, so it may be that this head and shoulders pattern finally completed after all. Both that and the repeated failures to exceed the high earlier are bearish signs of exhaustion amongst buyers.
Turning to horizontal support and resistance, the price action has printed new resistance levels, and the one that is holding now and easily absorbing attempts at buying is very confluent with the round number at 1.3600. This suggests that the first part of the London session today is likely to see a move lower. The former support level at 1.3618, which held cleanly as support, has now flipped very cleanly to become new resistance, and that is one of the most bearish signs you can see in the Forex market.
I have not marked it as a defined level, but support might well start to be felt at 1.3565 next.
GBP/USD H1 Price Chart Showing Shoulders
Behavioral Blind Spot: Jackson Hole Volatility Risk
The problem with technical analysis is that it tends to work in the absence of other disruptive factors which might appear from time to time: put simply, news about something which materially affects the perceived valuation of either currency in a currency pair. So, what might affect the British Pound or US Dollar that would upend consideration of technical factors? Most obviously, some form of surprise from relevant central bankers at this weekend’s Jackson Hole Symposium, or even very hawkish or dovish comments from the Fed Chair or more than a single FOMC member, might shift the market’s attitude to the US Dollar materially.
It is challenging to think of a similar risk to the British Pound. Some kind of European flare-up over Russia and Ukraine could hurt the Pound and might also produce a flow into the US Dollar as a safe haven when European currencies take a knock.
Alternative Bullish Scenario
Although technical and sentimental factors suggest the next major price movement will be lower, how might an alternative bullish scenario play out? There is a long-term bullish trend here, even though it is not very strong, but it has persisted over many months and could still provide a residual which will see prices moving higher again. Although the current bearish move looks serious, what if this is just a bearish retracement?
I see the most likely bullish scenario as being a move lower to 1.3565 / 1.3550 which then produces a strong bullish bounce, sucking in longs who push the price upwards to make a new 6-month high price, or at least back above the level at 1.3600 which looks like it has potential to be today’s pivotal point.
GBP/USD is worth watching because it has failed to break to a new long-term high, is showing bearish price action, and has a long way to fall while remaining within its dominant range, suggesting there could be a good opportunity to get involved on the short side. Alternatively, the pair may surprise if the long-term bullish trend reasserts itself and produces a fresh high within the next few days. Sentiment on the US Dollar and any surprises at Jackson Hole at the end of this week may prove crucial.
The US dollar initially fell against the Japanese yen during the trading session here on Wednesday, as we are looking at a situation where traders are watching the Bank of Japan, and the carry trade.
USD/JPY
The US dollar initially fell against the Japanese yen during the trading session here on Wednesday but then turned around to show signs of life as traders continue to see a lot of volatility in this pair, as well as many others.
Ultimately, the carry trade is still very much in play here, and with the Bank of Japan intervening multiple times, we have seen a little bit of suppression of price discovery. But ultimately, this is a market that is trying to get back to the 160 yen level, an area where we have not only seen resistance previously multiple times going in the past, but we also have the 50-day EMA in the same region.
Carry Trade and Key Moving Averages
Short-term pullbacks at this point in time are likely to test the uptrend line that we have been in for some time, with the 200-day EMA sitting just below there to offer support, all things being equal. USD/JPY is a market that I will remain long of. I’ve been long in for months, and I’m actually buying little micro positions on each dip to build my carry trade portfolio.
If we can get above the 160 yen level on a daily close, then I think it opens up the possibility of a challenge of the 162 yen level, an area that I think will remain important from previous action. And then you start to worry about intervention again.
Nonetheless, the carry trade is a very real thing, and the Japanese can only get so tight. The speech at Jackson Hole on Friday from Kevin Warsh could be the next big mover here.
Christopher Lewis is a technical analyst and market commentator at DailyForex with more than two decades of trading experience in Forex and other leveraged markets. Based in Columbus, Ohio, he specializes in chart-based analysis of major currency pairs, stock indices, commodities, and energy markets, focusing on clear support and resistance levels, trend structure, and risk management. Christopher produces daily written and video analysis for traders who rely on technical setups to navigate volatile market conditions
As seen on:Pairs Of Aces Podcast,The Trader Guy, FXEmpire
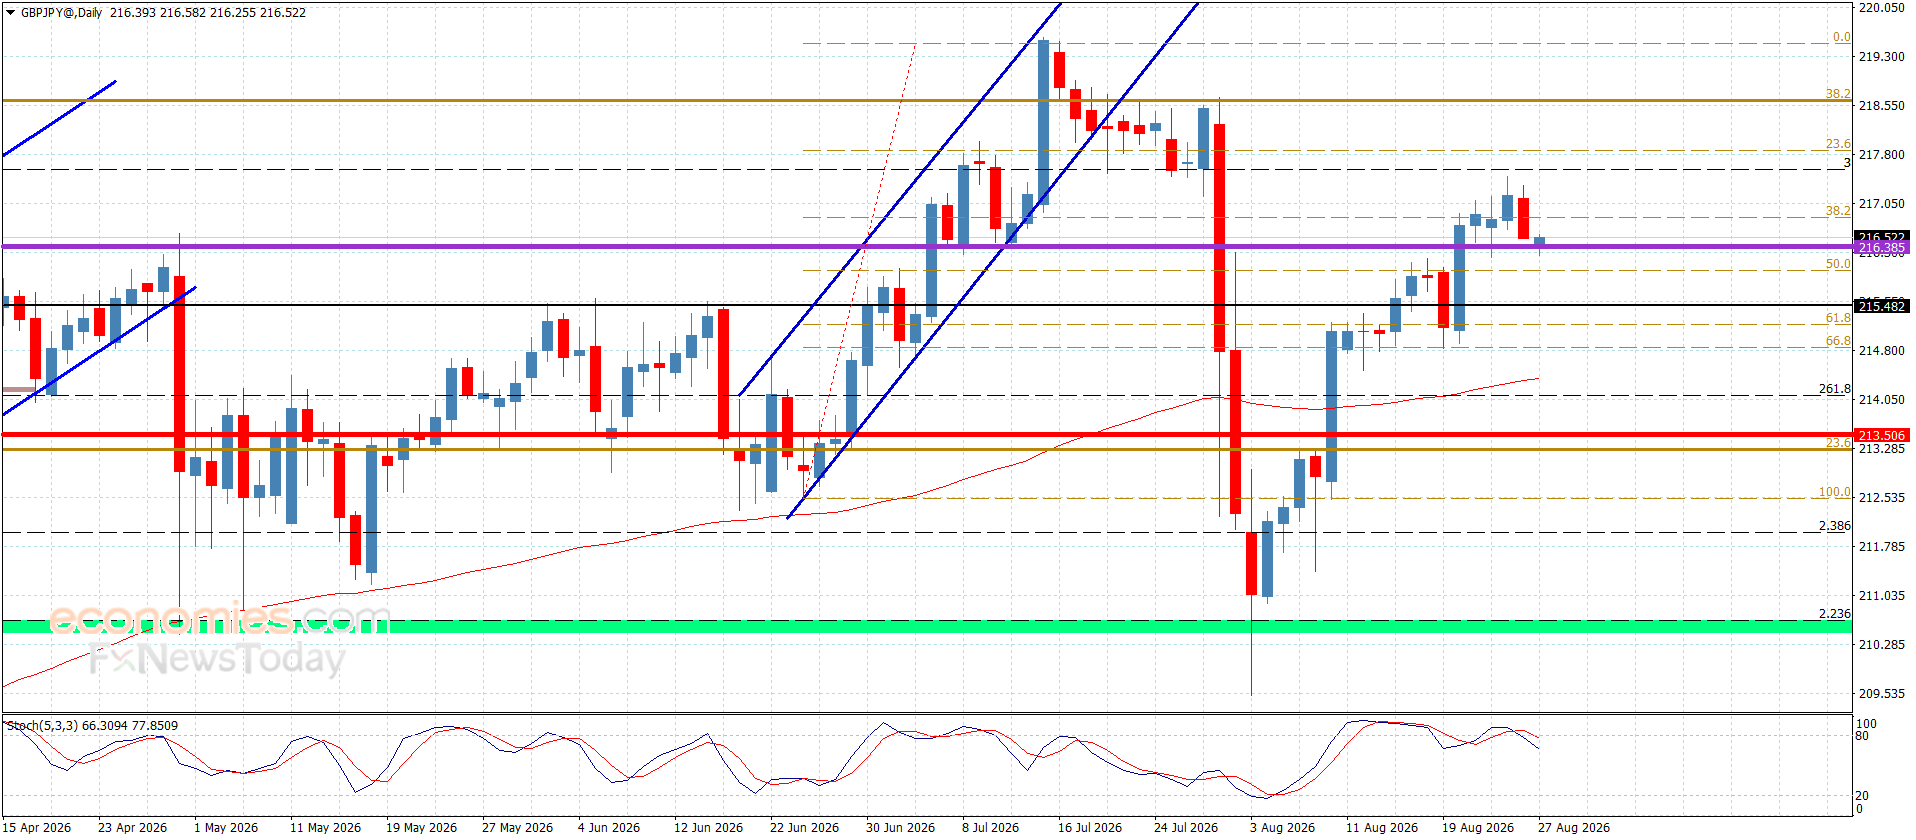
The GBPJPY pair faced some bearish pressures due to its stability below 21.85 besides stochastic exit from the overbought levels, which forces it to form some corrective trading by facing the initial support near 216.35.
The price needs extra bullish momentum, which allows it to settle above the current support, to confirm its readiness to activate the bullish trend by targeting 217.15, repeating the pressure to find an exit for recording extra gains in the upcoming period.
The expected trading range for today is between 216.10 and 217.85
EUR/JPY depreciates after registering modest gains, trading around 185.60 during the European hours on Wednesday. The technical analysis of a daily chart indicates that the currency cross is remaining within the ascending channel pattern, signaling an ongoing bullish bias.
The EUR/JPY cross is keeping a constructive bullish tone as it holds above both the nine- and 50-period Exponential Moving Averages (EMAs). The currency cross is advancing away from its mid-180s base while short-term averages stay stacked above the longer one, which hints at persistent upward pressure.
The 14-day Relative Strength Index (RSI) at 57.38 sits in positive territory but shy of overbought conditions, suggesting room for additional gains while upside momentum remains moderate rather than stretched. The EUR/JPY cross may rise toward the all-time high of 187.95 set on April 17, followed by the upper boundary of the ascending channel around 188.20.
On the downside, the EUR/JPY cross tests the immediate support around the lower boundary of the ascending channel, aligned with the nine-day EMA at 185.19 and the 50-day EMA at 184.72. A break below this confluence support zone may cause the bearish reversal, potentially pressing the currency cross down toward its nine-month low of 179.37, recorded on August 3.
EUR/JPY: Daily Chart
(The technical analysis of this story was written with the help of an AI tool. Know more.)
Euro Price Today
The table below shows the percentage change of Euro (EUR) against listed major currencies today. Euro was the weakest against the Australian Dollar.
USD
EUR
GBP
JPY
CAD
AUD
NZD
CHF
USD
0.06%
0.18%
-0.10%
0.20%
-0.24%
0.33%
0.30%
EUR
-0.06%
0.12%
-0.15%
0.19%
-0.29%
0.27%
0.24%
GBP
-0.18%
-0.12%
-0.30%
0.06%
-0.40%
0.16%
0.13%
JPY
0.10%
0.15%
0.30%
0.31%
-0.13%
0.46%
0.40%
CAD
-0.20%
-0.19%
-0.06%
-0.31%
-0.44%
0.16%
0.09%
AUD
0.24%
0.29%
0.40%
0.13%
0.44%
0.60%
0.53%
NZD
-0.33%
-0.27%
-0.16%
-0.46%
-0.16%
-0.60%
-0.06%
CHF
-0.30%
-0.24%
-0.13%
-0.40%
-0.09%
-0.53%
0.06%
The heat map shows percentage changes of major currencies against each other. The base currency is picked from the left column, while the quote currency is picked from the top row. For example, if you pick the Euro from the left column and move along the horizontal line to the US Dollar, the percentage change displayed in the box will represent EUR (base)/USD (quote).
The Pound US Dollar (GBP/USD) exchange rate weakened on Wednesday as investors assessed the latest batch of US economic data.
At the time of writing, GBP/USD was trading at around $1.3605, down roughly 0.3% from Wednesday’s opening levels.
The US Dollar (USD) gained ground against most of its major counterparts on Wednesday after the release of the latest US core PCE price index.
The Federal Reserve’s preferred gauge of underlying inflation showed price growth remained unchanged at 3.3% in July, leaving it close to the two-year high of 3.4% recorded in May.
The lack of further progress in bringing inflation towards the Fed’s 2% target encouraged investors to increase their expectations for additional monetary tightening later this year, providing a boost to the ‘Greenback’.
The US Dollar also benefited from stronger-than-anticipated durable goods orders, with the latest figures showing a significantly larger increase in demand than economists had forecast.
The Pound (GBP) struggled on Wednesday as the announcement of a 4% increase in the UK’s energy price cap renewed concerns over pressure on household finances.
Save on Your GBP/USD Transfer
Get better rates and lower fees on your next international money transfer.
Compare TorFX with top UK banks in seconds and see how much you could save.
Although the rise had been largely expected after sustained disruption to energy supplies in the Gulf, investors remained wary that higher household bills could weigh on consumer spending and undermine the UK’s economic recovery.
There are also concerns that rising utility costs could feed through into inflation, creating another headache for the Bank of England (BoE) and potentially strengthening the case for further interest rate increases before the end of the year.
Near-Term GBP/USD Forecast: Fed Chair to Take Centre Stage at Jackson Hole
Looking towards the remainder of the week, attention will turn firmly to the Federal Reserve’s annual Jackson Hole symposium and any clues it may provide over the bank’s future policy direction.
New Fed Chair Kevin Warsh has so far favoured limiting forward guidance from the central bank. However, persistent inflation and renewed volatility in US bond markets could encourage him to offer greater insight into the Fed’s plans.
Investors may therefore remain cautious ahead of Warsh’s speech on Friday, potentially keeping the Pound to US Dollar (GBP/USD) exchange rate relatively subdued.
With the UK economic calendar offering little of note in the meantime, Sterling is likely to take its direction from broader currency market trends on Thursday.
Like this piece? Please share with your friends and colleagues:
International Money Transfer? Ask our resident FX expert a money transfer question or try John’s new, free, no-obligation personal service! ,where he helps every step of the way,
ensuring you get the best exchange rates on your currency requirements.
The USD/JPY pair continues to face strong resistance at the 20-day exponential moving average (EMA), as of the latest trading session, with the yen maintaining its recent strength against the dollar. This technical barrier has repeatedly capped upside attempts, keeping the pair within a tight range and signaling that sellers remain in control in the near term.
Why the 20-Day EMA Matters for USD/JPY
The 20-day EMA is a widely watched short-term trend indicator that traders use to gauge momentum and potential support or resistance levels. In the current USD/JPY setup, the pair has consistently failed to close above this moving average, indicating that the recent bearish momentum is still intact. As of this week, the 20-day EMA sits just above the current price, and each rally toward that level has been met with fresh selling pressure, reinforcing its role as a key barrier.
This technical pattern suggests that unless there is a decisive break above the 20-day EMA, the pair is likely to remain under pressure. A sustained move above this level could signal a shift in sentiment, but until then, traders are treating it as a sell zone. The repeated rejection at this moving average also reflects broader market dynamics, including the interest rate differential between the U.S. and Japan and the safe-haven demand for the yen amid global uncertainties.
Market Context and Broader Implications
The yen’s strength comes against a backdrop of shifting expectations for monetary policy. The Bank of Japan has signaled a gradual normalization of its ultra-loose policy, which has supported the yen. Meanwhile, the Federal Reserve’s path on interest rates remains uncertain, with market participants closely watching U.S. economic data for clues. These fundamental factors are aligning with the technical picture, as the yen benefits from a narrowing rate differential.
For traders, the 20-day EMA is not just a technical level but a reflection of the market’s current risk appetite. A failure to break above it could lead to further downside, with the next support levels likely to be tested. Conversely, a breakout would open the door for a retest of higher resistance zones. The ongoing tug-of-war between these forces is keeping the pair range-bound, and the resolution of this technical standoff will likely set the tone for the coming weeks.
What to Watch Next
Key levels to monitor include the recent swing lows and the psychological 150.00 mark, which has acted as a support zone in the past. On the upside, a close above the 20-day EMA would be the first sign of bullish momentum, followed by the 50-day EMA as the next hurdle. Fundamental catalysts, such as U.S. inflation data or comments from central bank officials, could also trigger a breakout or breakdown.
Given the current technical and fundamental alignment, the path of least resistance appears to be lower, but traders should remain flexible. The 20-day EMA will continue to be a critical level to watch, and a decisive move beyond it will likely define the next trend.
Conclusion
In summary, the USD/JPY pair is currently constrained by the 20-day EMA, which has proven to be a formidable barrier. The yen’s strength, driven by monetary policy expectations and safe-haven flows, is keeping the pair under pressure. Traders should monitor this level closely, as a break above or below could signal the next significant move. As always, combining technical analysis with fundamental context is essential for making informed trading decisions.
FAQs
Q1: What is the 20-day EMA and why is it important for USD/JPY? The 20-day exponential moving average is a short-term trend indicator that smooths price data over the past 20 days, giving more weight to recent prices. For USD/JPY, it is currently acting as a resistance level, meaning the pair has struggled to rise above it, indicating bearish momentum.
Q2: What could cause a breakout above the 20-day EMA? A breakout could be triggered by a shift in fundamental factors, such as a surprise change in U.S. or Japanese monetary policy, or a significant economic data release that alters market sentiment. A decisive close above the 20-day EMA would be the first technical confirmation of a bullish reversal.
Q3: How long can the 20-day EMA continue to cap the upside? There is no set timeframe. The barrier will remain effective as long as sellers defend it. However, the longer the price stays below the EMA, the more likely a breakout becomes, as accumulation often occurs before a significant move. Traders should watch for volume and momentum indicators for clues.
EUR/USD is holding near 1.1670 as ING keeps 1.17 for September and 1.18 year-end, with US policy risks still weighing on the Dollar.
The Euro to Dollar (EUR/USD) exchange rate is holding around 1.1670 on Wednesday after a strong late-August advance carried the pair through several resistance levels that had frustrated Euro bulls earlier this month.
EUR/USD was quoted at 1.1669 early in the European session, having gained around 2.45% over the past month and reached a high of 1.1711 during the latest rally.
Currency analysts at ING remain reluctant to call a bottom in the broader Dollar decline.
“Most paths seem to lead to a weaker dollar, but Kevin Warsh’s speech on Friday could prove supportive,” ING’s Chris Turner said.
The bank believes positioning may still have further to adjust after the Dollar’s strong run earlier in the summer.
“There may still be room for further USD long-squeezing, and we remain reluctant to call the bottom in this dollar selloff just yet,” Turner added.
That view has gained some support from the wider market backdrop.
The Dollar index was hovering close to a three-month low on Wednesday after US Treasury measures aimed at limiting pressure on long-term bond yields added another source of uncertainty around the Greenback.
Reuters reported on Wednesday that EUR/USD was around 1.1661 as traders waited for US PCE inflation and Warsh’s Jackson Hole address, with Standard Chartered also warning that attempts to push US rates lower could create another Dollar headwind.
The one-month chart shows the scale of the change, with EUR/USD climbing from below 1.1400 in late July to above 1.1700 before consolidating around 1.1670.
Euro (EUR) Positioning Still Leaves Room for Buyers
ING also sees the futures market as relatively supportive for the Euro rather than dangerously crowded.
Asset managers and leveraged funds have been buying Euro contracts, although Turner stresses that the overall positions remain fairly modest.
“Speculators look quite underweight the euro,” he said, noting that the available positioning data also pre-dated last week’s sharp EUR/USD breakout.
That leaves scope for further buying if US rate expectations or confidence in the Dollar soften again.
The European data backdrop has meanwhile improved.
ING had expected Germany’s August Ifo survey to continue recovering, and Tuesday’s release was stronger than forecast, with the business climate index rising to 88.8 from 86.7 against expectations near 87.2.
As we noted in our earlier ING EUR/USD forecast, the bank’s 1.18 year-end call originally rested heavily on softer US employment data reducing the case for further Fed tightening.
The latest move has brought spot much closer to that destination.
Near-Term EUR/USD Forecast: 1.1660/70 Is the Immediate Line to Watch
ING’s technical reference point is particularly timely because EUR/USD is sitting almost directly on top of it.
“We do not really see the need for EUR/USD to come back sharply under support at 1.1660/70 today,” Turner said, although he warned that last week’s breakout area could come back into play if risk assets suffer a broader setback.
That support zone now separates a fairly orderly consolidation from a more meaningful reversal of the recent Euro rally.
There is also an interesting contrast with our recent MUFG EUR/USD analysis, when the 1.1630 area was still acting as resistance and MUFG warned that the Euro looked rich relative to short-term fundamentals.
EUR/USD has since broken above that level and held there.
ING nevertheless sees Friday’s Jackson Hole speech as a genuine risk to the bullish picture.
“The speech could be a hawkish event risk for the dollar,” Turner said, with Warsh expected to reinforce the Fed’s inflation-fighting credentials after his July press conference unsettled the Treasury market.
Before then, traders face July PCE inflation, with the US Bureau of Economic Analysis due to publish the Fed’s preferred inflation measures later on Wednesday.
ING Keeps 1.18 Year-End Target
ING has not been tempted to raise its forecasts simply because spot has moved rapidly higher.
“At present, we are happy with our current forecasts for EUR/USD at 1.17 end September and 1.18 for end year – but will be reviewing those this week,” Turner said.
With EUR/USD already near 1.1670, the 1.17 September target is now effectively within reach.
The more interesting question is whether softer US policy expectations, improving European data and relatively light Euro positioning can carry the pair towards 1.18 without first producing a deeper correction.
Our euro to dollar forecast for th short-term is 1.1660/70 is the level that should tell us whether the latest breakout is being consolidated or beginning to unwind.
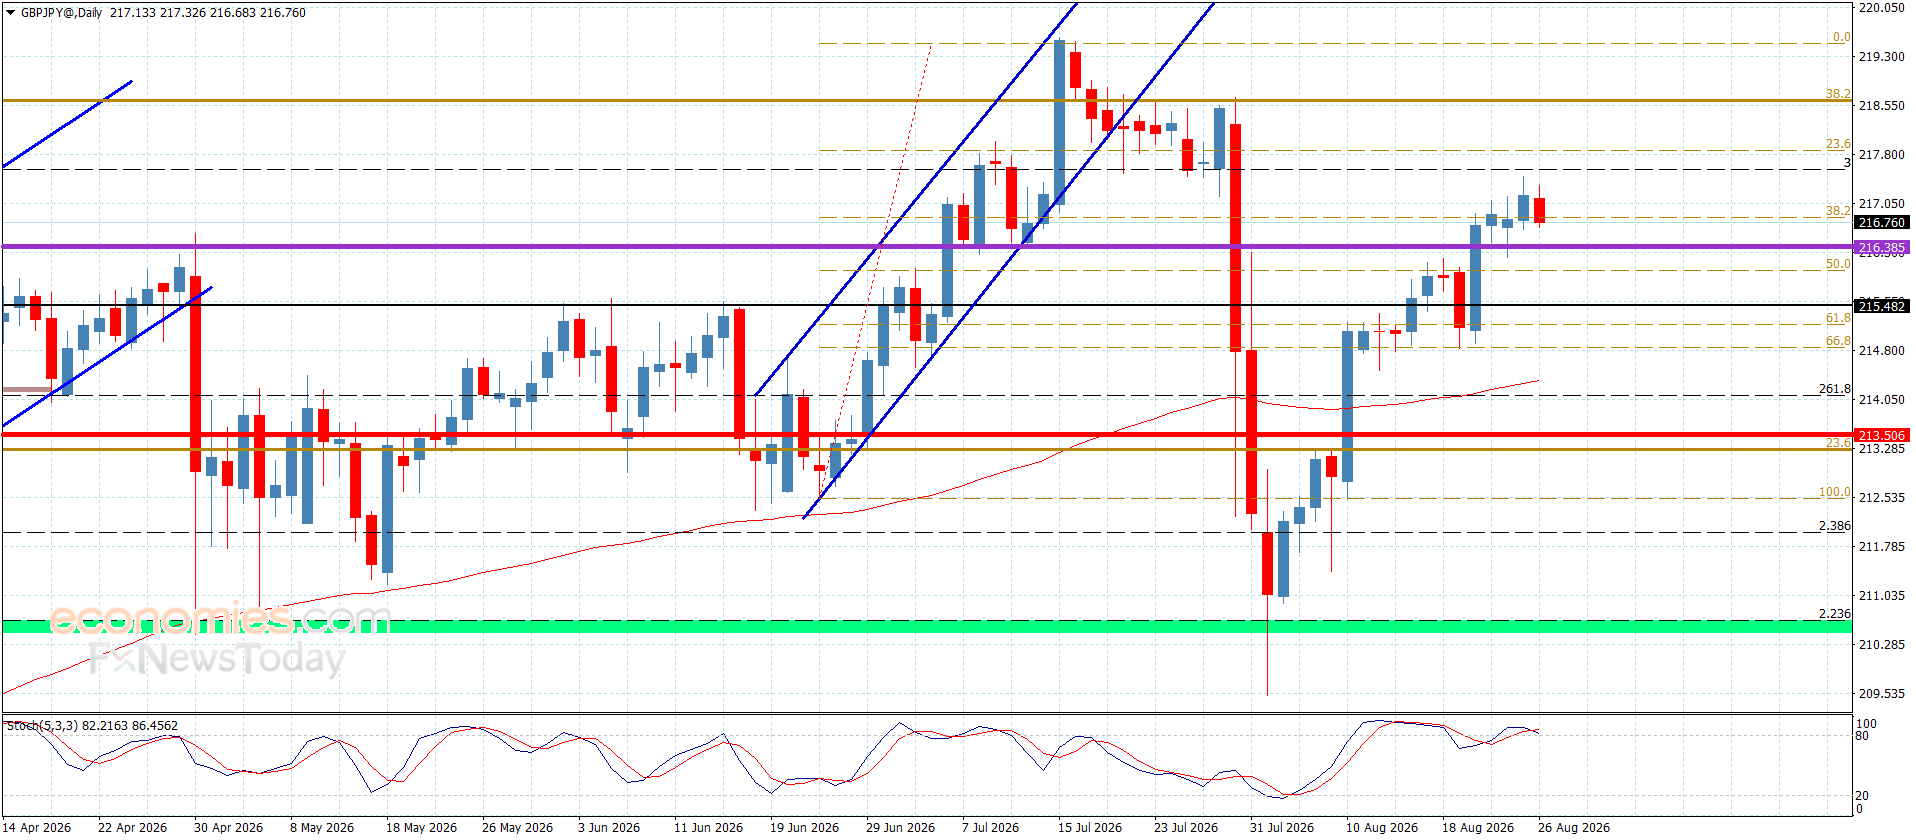
The pair’s price failed to reach the resistance barrier near 217.85, while it is currently reacting to the attempt of the Stochastic indicator to exit the overbought zone, forcing the pair to move in mixed sideways trading and fluctuate around 216.75.
We emphasize the importance of maintaining trading above 216.35 during the current period, as this would allow the pair to renew its bullish attempts and push toward the aforementioned resistance barrier. A breakout above this level would confirm its transition into a new positive phase, extending the move directly toward 218.35 and 218.65. On the other hand, slipping below 216.35 would force the pair to activate the bearish corrective scenario, targeting 215.55 initially.
The expected trading range for today is between 216.50 and 217.85