In October 2024, BlackRock’s stock, the world’s largest asset manager, recorded a milestone in its history by surpassing the $1,000 per share barrier for the first time.
The stock not only achieved this historic milestone, but also continued its record brilliance and remarkable performance, reaching unprecedented levels in November and December of 2024.
However, the stock experienced a slight decline at the beginning of 2025 trading sessions due to correction activities and profit-taking, coinciding with investors’ aversion to risk before the inauguration of the elected U.S. President “Donald Trump” on January 20.
The Exceptional Rise of BlackRock’s Stock Embodies the Company’s Strength and Its Premium Position
Driven by the rise in managed assets to unprecedented levels, which surprised global markets and enhanced its reputation as the world’s largest asset manager.
Throughout 2024, BlackRock’s managed assets recorded a series of record levels, driven by strong cash flows into the company’s funds, especially funds focused on sustainable investment.
This trend reflects the increasing interest of global investors in investing in assets that adhere to Environmental, Social, and Governance (ESG) standards, a field in which BlackRock has led in innovation and expanding products.
Additionally, technology played a vital role in boosting market confidence in the company, as BlackRock continued to invest in developing the “Aladdin” platform, which is a leading analytical tool for risk management and portfolio analysis.
The company also benefited from expansion into emerging markets, focusing its strategy on providing integrated investment solutions to meet the needs of major institutions.
These factors, along with the recovery of global markets and increasing investor appetite for risk, contributed to pushing the stock towards achieving unprecedented levels, making it a focal point for investors around the world.
As investors enter 2025 with high expectations, the main question remains: Can BlackRock’s stock maintain this strong performance or even achieve further rises to new historical levels?
About BlackRock
-
Company Establishment and Headquarters
BlackRock was founded in 1988 by a group of financial experts led by “Larry Fink,” and it is today considered the world’s largest asset management company. The company’s headquarters are located in New York City, United States.
-
Business Scope
BlackRock focuses on providing investment management and risk management services to institutional clients and individuals around the world.
The company manages a diverse range of financial instruments, including equities, bonds, and Exchange-Traded Funds (ETFs), among which its iShares brand is one of the most well-known in this field.
-
Managed Assets
By 2024, BlackRock’s managed assets surpassed the $10 trillion mark, reflecting its dominant strength in the financial sector and its ability to attract massive financial flows from various global markets.
-
Technological Innovation
The Aladdin platform is one of the company’s most prominent achievements, an integrated system for risk management and portfolio analysis.
This tool is used by over 200 financial institutions, enhancing BlackRock’s position as a leader in providing advanced technological solutions.
-
Company Leadership
Larry Fink serves as the CEO, and he is renowned for guiding BlackRock towards global expansion and innovation. Under his leadership, the company has become a key player in shaping the future of investment and risk management.
Who Is Larry Fink
Larry Fink is the CEO and founder of BlackRock, the world’s largest asset manager. Born on November 2, 1952, in Los Angeles, California, he studied political science at the University of California, Los Angeles before obtaining an MBA from UCLA.
He began his career at First Boston Bank, where he worked on developing the mortgage-backed securities market, then founded BlackRock in 1988. Under his leadership, BlackRock transformed from a small company into a financial empire managing over $10 trillion in assets, and is a leading company in financial innovation, including the development of the Aladdin platform and Exchange-Traded Funds.
Fink is considered one of the biggest advocates for sustainable investment and social responsibility (ESG), encouraging companies and investors to focus on environmental and social standards in their strategies.
Thanks to his vision, Larry Fink’s name appears on lists of the most influential figures in the world. Additionally, BlackRock is skillfully managed, guiding the company towards strategic expansions in global markets, making him one of the foremost financial leaders of the 21st century.
Top BlackRock Products
-
Exchange-Traded Funds (ETFs)
iShares is among the most prominent brands offered by BlackRock, encompassing a range of ETFs that allow investors to access a variety of assets, including equities, bonds, and emerging markets.
These funds provide opportunities for diversification and achieving stable returns across multiple markets.
-
Mutual Funds
BlackRock offers a wide range of mutual funds that include various investment strategies, including investments in equities, bonds, alternative assets, and sustainable products.
These funds allow investors to allocate their portfolios according to their financial goals and potential risks.
-
Sustainable Investment (ESG)
BlackRock is a leading company in sustainable investment, offering many funds that focus on Environmental, Social, and Governance (ESG) standards.
These products meet the needs of investors seeking to make a positive social and environmental impact through their investments.
-
Real Estate Investment
BlackRock’s real estate funds allow investors to invest in diverse real estate assets worldwide.
These products include global real estate funds and investments in tangible assets, providing diversification opportunities for investors.
-
Aladdin Platform
Aladdin (Asset, Liability, Debt and Derivative Investment Network) is an integrated system for risk management and portfolio analysis, developed and managed by BlackRock.
It is considered one of the company’s key technological assets and is widely used by financial institutions and investors worldwide.
-
Actively Managed Funds
BlackRock also offers actively managed funds, where a professional management team makes investment decisions based on thorough market analysis.
These funds aim to achieve performance that outperforms benchmark indices.
-
Bond Investment
BlackRock provides investment strategies in bonds, including government bonds, high-yield bonds, short-term and long-term bonds, as well as emerging market bonds.
These products enable investors to diversify their investments and achieve steady returns.
-
Alternative Investment
BlackRock offers alternative investments, including private markets, private equity, commodities, and other alternative assets.
These products help investors diversify their portfolios and achieve non-traditional returns.
-
Digital Currency Funds (Bitcoin ETFs)
As part of its expansion into the digital asset market, BlackRock introduced a Bitcoin ETF, allowing investors to trade Bitcoin within a regulated financial framework.
This fund is one of BlackRock’s most prominent products in the digital currency sector, providing investors the opportunity to access the world’s largest cryptocurrency within traditional investment frameworks.
Managed Asset Volume
At the beginning of 2024, BlackRock managed assets valued at $9.1 trillion. By the third quarter of the same year, these assets had risen to $11.48 trillion, reflecting an increase of $2.38 trillion.
This growth represents an approximately 26% increase during the first nine months of 2024.
This increase is attributed to strong investment inflows, with investors adding $221 billion to BlackRock’s assets during the third quarter of 2024.
Additionally, private markets contributed to this growth, reflecting the diversification of investment strategies adopted by the company.
These figures demonstrate BlackRock’s ability to attract investments and maintain investor confidence, enhancing its position as the world’s largest asset manager.
Aladdin Platform
Aladdin (Asset, Liability, Debt and Derivative Investment Network) is an integrated system for risk management and portfolio analysis, developed and managed by BlackRock.
It is considered one of the company’s key technological assets and is widely used by financial institutions and investors worldwide.
Key Features of Aladdin
- Risk Management: Helps institutions measure and understand risks related to investment portfolios, including market volatility, credit risk, and operational risk.
- Data Analysis: Provides advanced analytical tools to process large volumes of financial data and extract strategic insights.
- Portfolio Management: Assists asset managers in allocating assets within portfolios and optimizing investment strategies based on their goals and market constraints.
- Regulatory Compliance: Provides tools to ensure compliance with local and international investment laws and regulations.
- Communication and Integration: Functions as a unified platform integrating different departments of the institution, from risk management to portfolio management, facilitating comprehensive and swift decision-making.
Importance of Aladdin in the Financial Market
- Used by over 200 financial institutions, including banks, hedge funds, and pension funds.
- Allows users to have a comprehensive view of risks across different asset types and global markets.
- Represents a significant revenue source for BlackRock, as it is offered as a software service to other companies.
Future of Aladdin
With the continuous evolution in financial technology and the increasing demand for tools that integrate artificial intelligence and advanced analytics, Aladdin is expected to remain at the forefront of risk management and investment analysis platforms, further enhancing BlackRock’s position as a leading company in this field.
BlackRock Bitcoin Fund
The BlackRock Bitcoin Fund is an investment product offered by BlackRock, the world’s largest asset manager, targeting investment in Bitcoin.
This fund aims to provide an easy and secure way for traditional investors to gain direct exposure to Bitcoin’s price without the need to own or manage the digital currency directly.
Key Information about the Fund
- Fund Launch:
- BlackRock announced its intention to launch a Bitcoin fund in June 2023, a step that garnered wide attention due to the company’s size and influence in global financial markets.
- The fund received initial approval from the U.S. Securities and Exchange Commission (SEC) in January 2024 after a series of previous rejected attempts by other companies.
- Mechanism:
- The fund tracks the immediate performance of Bitcoin’s price, meaning its price reflects Bitcoin’s actual market value.
- The fund manages assets related to Bitcoin in an institutional and secure manner using trusted parties to custody digital assets.
- Main Objective:
- Facilitate institutional and individual investors’ access to the digital currency market without needing to handle the challenges of storing and managing digital assets themselves.
- Expand institutional adoption of digital currencies as recognized asset classes.
- Importance of the Fund:
- Enhances the legitimacy of digital currencies as investment assets and increases their attractiveness to traditional investors.
- Represents a turning point in integrating digital currencies with the traditional financial system.
- Impact of the Fund:
- BlackRock’s announcement of the fund helped boost Bitcoin and other digital currencies’ prices, increasing confidence in the digital market.
- The market saw increased interest from major financial institutions as a result of this move.
BlackRock Q3 2024 Earnings
| Key Q3 Financial Results |
Value |
Change Compared to Q3 2023 |
| Revenue |
$5.20 billion |
Up by 15% |
| Net Income |
$1.63 billion |
Up by 1.7% |
| Profit Margin |
31% |
Down from 36% |
| Earnings Per Share |
$11.02 |
Up from $10.75 |
The decline in profit margin is attributed to increased expenses.
Brief Analyses and Forecasts for BlackRock’s Stock:
- BlackRock Stock Forecast This Week: The stock is retesting the support area between $1,000 to $950.
- BlackRock Stock Forecast in January: The stock is likely to incur a monthly loss, the first since April 2024, due to the correction cycle and profit-taking.
- BlackRock Stock Forecast in 2025: If BlackRock’s stock surpasses the $1,100 barrier, the next target will be $1,500 by the end of 2025, for the first time in history.
Key Price Milestones for BlackRock Stock
- October 1999: BlackRock’s stock reached its all-time low at $7.63.
- December 2024: BlackRock’s stock reached its all-time high at $1,082.45.
- October 1999: BlackRock’s stock reached its all-time closing low at $9.31.
- December 2024: BlackRock’s stock reached its all-time closing high at $1,065.26.
Best Performance of BlackRock Stock in History
- 2009: Best annual performance ever for BlackRock’s stock, up by 77%.
- Q2 2009: Best quarterly performance ever for BlackRock’s stock, up by 35%.
- March 2009: Best monthly performance ever for BlackRock’s stock, up by 35%.
Worst Performance of BlackRock Stock in History
- 2008: Worst annual performance ever for BlackRock’s stock, down by 37%.
- Q2 2010: Worst quarterly performance ever for BlackRock’s stock, down by 34%.
- October 2008: Worst monthly performance ever for BlackRock’s stock, down by 32%.
Key Events in BlackRock Stock History
- October 1999: BlackRock’s stock started trading on Wall Street at $8.55.
- November 1999: BlackRock’s stock traded above $10 for the first time ever.
- June 2000: BlackRock’s stock surpassed $20 for the first time in history.
- January 2005: BlackRock’s stock traded above $50 for the first time ever.
- February 2006: BlackRock’s stock surpassed $100 for the first time in history.
- April 2013: BlackRock’s stock traded above $200 for the first time ever.
- August 2016: BlackRock’s stock surpassed $300 for the first time in history.
- October 2017: BlackRock’s stock traded above $400 for the first time ever.
- February 2020: BlackRock’s stock surpassed $500 for the first time in history.
- October 2024: BlackRock’s stock traded above $1,000 for the first time ever.
BlackRock Stock Forecasts for 2025
- JP Morgan Bank: The bank expects BlackRock’s stock to reach $1,250 by the end of 2025.
- Goldman Sachs: The group expects BlackRock’s stock to reach $1,350 by the end of 2025.
- Morgan Stanley: The group expects BlackRock’s stock to reach $1,260 by the end of 2025.
- Citigroup: The group expects BlackRock’s stock to reach $1,450 by the end of 2025.
- Coin Codex: The site expects BlackRock’s stock to reach $1,210 by the end of 2025.
- Coin United: The site expects BlackRock’s stock to reach $1,400 by the end of 2025.
Factors Affecting BlackRock Stock Forecasts
Factors affecting BlackRock’s stock forecasts in 2025:-
-
Global Financial Market Performance
- Since BlackRock manages massive assets across various financial markets, fluctuations in markets, whether in stocks, bonds, or commodities, significantly impact its financial performance and thus its stock price.
- The rise or fall of global markets in 2025, such as stocks or government bonds, can have a direct impact on the profits the company generates.
-
Interest Rates
- Interest rate policies by central banks, especially the U.S. Federal Reserve, are a key factor.
- Raising interest rates may lead to a decline in the value of assets managed by BlackRock, while lowering rates may boost market growth.
-
Economic Trends
- Global economic forecasts for 2025, such as economic growth in the United States, Europe, and China, have a direct impact on financial markets.
- The overall economic condition, whether in a recession or recovery phase, affects BlackRock’s future profits.
-
Asset Management and Inflow Flows
- Investment inflows managed by the company from clients are fundamental factors. If BlackRock can attract new funds into its funds, it enhances its profits and stock price.
-
Company Earnings and Future Expectations
- Any announcement of strong earnings or exceeding expectations will have a positive impact on the price, while any decline in earnings may lead to a price drop.
-
Developments in Cryptocurrency Markets
- With BlackRock’s continued interest in dealing with digital assets like Bitcoin, any changes in regulations or openness to these assets may drive up the stock price in the future.
-
Shifts in American Politics
- Policies of the elected U.S. President, such as tariff plans or other economic orientations, can affect financial markets in general, impacting BlackRock’s performance.
-
Technological Developments and Innovation
- If BlackRock can innovate financial solutions or expand its technologies like artificial intelligence and financial robotics, it can enhance its market position and thus its stock price.
-
Competition in the Asset Management Industry
- Competition from companies like Fidelity, Vanguard, and Morgan Stanley may affect BlackRock’s market share and consequently its financial performance.
-
Investments in Global Infrastructure
- BlackRock’s success in investing more assets in large infrastructure projects could increase its future profits and positively impact the stock price.
Top FAQs About BlackRock
Is BlackRock Stock Price Appropriate for Investment?
BlackRock’s stock is currently trading around $1,000. In light of most forecasts indicating an upward trend in 2025, we believe that levels between $850 and $750 are appropriate for investment, with a target above $1,200 in 2025 and approaching $2,000 by the end of 2026.
How to Invest in BlackRock?
Investing in BlackRock is one of the most prominent opportunities that investors in the technology sector are interested in. Here are some common ways to invest in BlackRock:
- Buying Stocks Directly:
Buying BlackRock shares (BLK) on the stock exchange is the most straightforward way to invest. BlackRock is listed on the New York Stock Exchange, and its shares can be purchased through a trading account at financial brokerage firms.
Be aware of the market fluctuations associated with BlackRock’s shares, as they often experience sharp price volatility.
- Investing via Exchange-Traded Funds (ETFs):
Investing in BlackRock indirectly through ETFs or mutual funds that include BlackRock shares within their portfolios is possible.
This type of investment helps diversify the portfolio and reduce risks associated with owning a single stock.
- Long-Term Investment:
Some investors prefer to hold BlackRock shares long-term to benefit from the company’s potential growth in the future.
Long-term investment strategies are based on the belief that the company will continue leading the technology sector.
- Stock Speculation:
Investors can also use speculation or day trading strategies to take advantage of daily fluctuations in BlackRock’s stock price.
However, this type of trading requires expertise and a good understanding of the market due to the high risks involved.
Investment Tips for BlackRock:
- Long-Term Planning: BlackRock is a leading company but may experience performance volatility. Therefore, experts recommend thinking about long-term investment.
- Market Analysis: Follow BlackRock’s financial performance, quarterly reports, and developments in the financial services and asset management sector.
- Portfolio Diversification: Do not put all funds in one stock, even if it’s BlackRock’s stock, but distribute investments across multiple stocks and sectors.
Will BlackRock’s Stock Reach $1,500 in 2025?
In light of recent developments in other global markets, especially after Donald Trump’s victory in the U.S. elections, it is not entirely out of the question for BlackRock’s stock to rise to $1,500 by the end of 2025.
Is BlackRock Price Expected to Rise in 2025?
Yes, the rise of BlackRock’s stock is expected to continue next year, as most major institutions, banks, and experts are confident that BlackRock’s stock is in a rising market.
Technical Analysis of BlackRock Stock (BlackRock Inc) – BLK
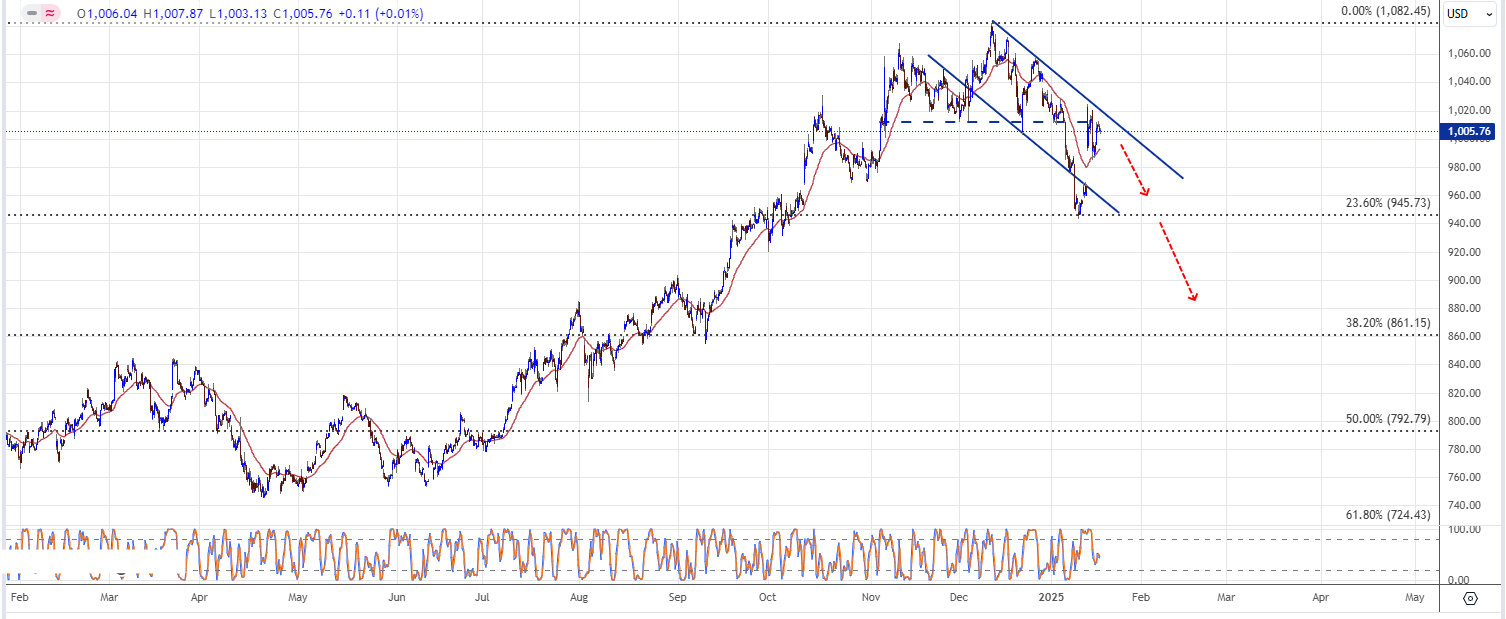
BlackRock’s stock began an upward wave in the last quarter of 2022 from the $503.12 area and reached historic record levels, recently hitting $1,082.45. From there, the stock started to decline, undergoing a downward correction of the aforementioned rise. We observe that the price tested the first correction level, 23.6% Fibonacci at $945.73, and bounced up from there in an attempt to compensate for some recent losses.
The price is stabilizing below the 50-day exponential moving average, which forms a strong resistance against the price, while the Stochastic indicator loses its positive momentum significantly, enhancing the chances of facing more negative pressures. It is noted that breaking the mentioned corrective level will force the price to undergo further downward correction, heading towards visiting the $861.15 areas after surpassing the first corrective level.
In studying the instant timeframes, we find that the price completed a head and shoulders pattern, encouraging the stock to decline and perform the proposed downward correction. It is noted that the price managed to achieve the full target of this pattern, meeting the first corrective level, which led to recent gains and a recovery in the instant term before determining its next short and medium-term fate.

On the other hand, we observe that there is a descending channel organizing the downward corrective wave. Movement within it, according to the proposed scenario in the following chart, indicates opportunities to surpass the $945.73 level and perform further downward correction in the short term.

In summary, we indicate that the expected trend for the upcoming period is downward based on the negative technical factors mentioned above. However, it should be considered that breaking the $1,015.00 and then $1,035.00 levels will stop the downward correction and lead the price to resume the main upward trend again, aiming to achieve additional gains and record new historic levels surpassing the $1,082.45 barrier.
Correction and Resistance Levels
- 50-day Exponential Moving Average: Forms a strong resistance against the price.
- 23.6% Fibonacci Correction Level: A corrective level at $945.73.
- Future Support Levels: Visiting areas of $861.15 after surpassing the first corrective level.
- Future Target Levels: Levels of $1,015.00 and then $1,035.00 to stop the downward correction and resume the upward trend.
Negative Technical Indicators
- Stochastic Indicator: Shows a significant loss of positive momentum, enhancing the chances of facing more negative pressures.
Head and Shoulders Pattern
In studying the instant timeframes, we find that the price completed a head and shoulders pattern, encouraging the stock to decline and perform the proposed downward correction. It is noted that the price managed to achieve the full target of this pattern, meeting the first corrective level, which led to recent gains and a recovery in the instant term before determining its next short and medium-term fate.
Descending Channel for Corrective Wave
On the other hand, we observe that there is a descending channel organizing the downward corrective wave. Movement within it, according to the proposed scenario in the following chart, indicates opportunities to surpass the $945.73 level and perform further downward correction in the short term.
Summary
In summary, we indicate that the expected trend for the upcoming period is downward based on the negative technical factors mentioned above. However, it should be considered that breaking the $1,015.00 and then $1,035.00 levels will stop the downward correction and lead the price to resume the main upward trend again, aiming to achieve additional gains and record new historic levels surpassing the $1,082.45 barrier.
Conversely, it is crucial to note that failing to confirm the breach of $78.90 and a downward rebound breaking the $74.60 level will force the price to turn downward, incurring new losses that could reach areas of $63.40 in the short term.


")