The main tag of Forex News Today Articles.
You can use the search box below to find what you need.
[wd_asp id=1]
4
05, 2026

EUR/JPY Price Forecast: Surging Near 184.00 After Trimming Recent Losses – What Next?
The main tag of Forex News Today Articles.
You can use the search box below to find what you need.
[wd_asp id=1]
The Euro to Pound Sterling (EUR/GBP) exchange rate held steady at 0.8637, with the pair consolidating as markets digest central bank signals from both the European Central Bank and Bank of England.
MUFG notes that, barring a sharp fall in energy prices, both the ECB and BoE are set to raise interest rates in the coming months, with tightening expectations now largely priced into markets.
“Without a dramatic reversal in energy prices… both the BoE and the ECB will be hiking rates.”
The bank highlights that UK rate expectations have shifted significantly, with markets now pricing between two and three hikes this year, while ECB guidance has been more explicit regarding a near-term move.
MUFG expects limited divergence between the two central banks, suggesting that EUR/GBP is likely to remain rangebound in the near term.
However, the bank sees a modest upside risk for the pair, reflecting slightly stronger signalling from the ECB.
“There was little yesterday to suggest much in the way of policy divergence… and hence, EUR/GBP range trading looks set to continue.”
MUFG expects the Euro to Pound Sterling exchange rate (EUR/GBP) to trade in a narrow range near current levels in the near term, with a modest upside bias towards higher levels, supported by clearer ECB rate hike signals.

EUR/GBP — Key Rate Highlights:
Current Rate: 0.863736 (04 May 2026, 08:00 UTC)
Daily Move: +0.04% (+0.000355)
Latest Close: 0.863737 (01 May)
May Range: 0.861981 – 0.863890
May Performance: +0.17%
12-Month Range: 0.840670 – 0.886524
Recent Trend: EUR/GBP edging higher in early May, following a broader downtrend seen through April
Disclaimer: For information only, not investment advice. This EUR to GBP forecast summarises and interprets third-party research; views expressed are those of the original source and may not fully reflect the source’s complete analysis. Neither the source nor we accept liability for reliance on this interpretation.
Exchange Rates UK Research’s latest April-May 2026 poll of major investment banks shows the pound-to-dollar exchange rate is expected to average around 1.33–1.34 in Q2 this year, below the current spot near 1.3576, with forecasts ranging widely from 1.27 on the downside to 1.40–1.45 on the upside over the longer term.
The data highlights a market where the central view points to limited near-term upside, but with a growing divergence in expectations beyond that.
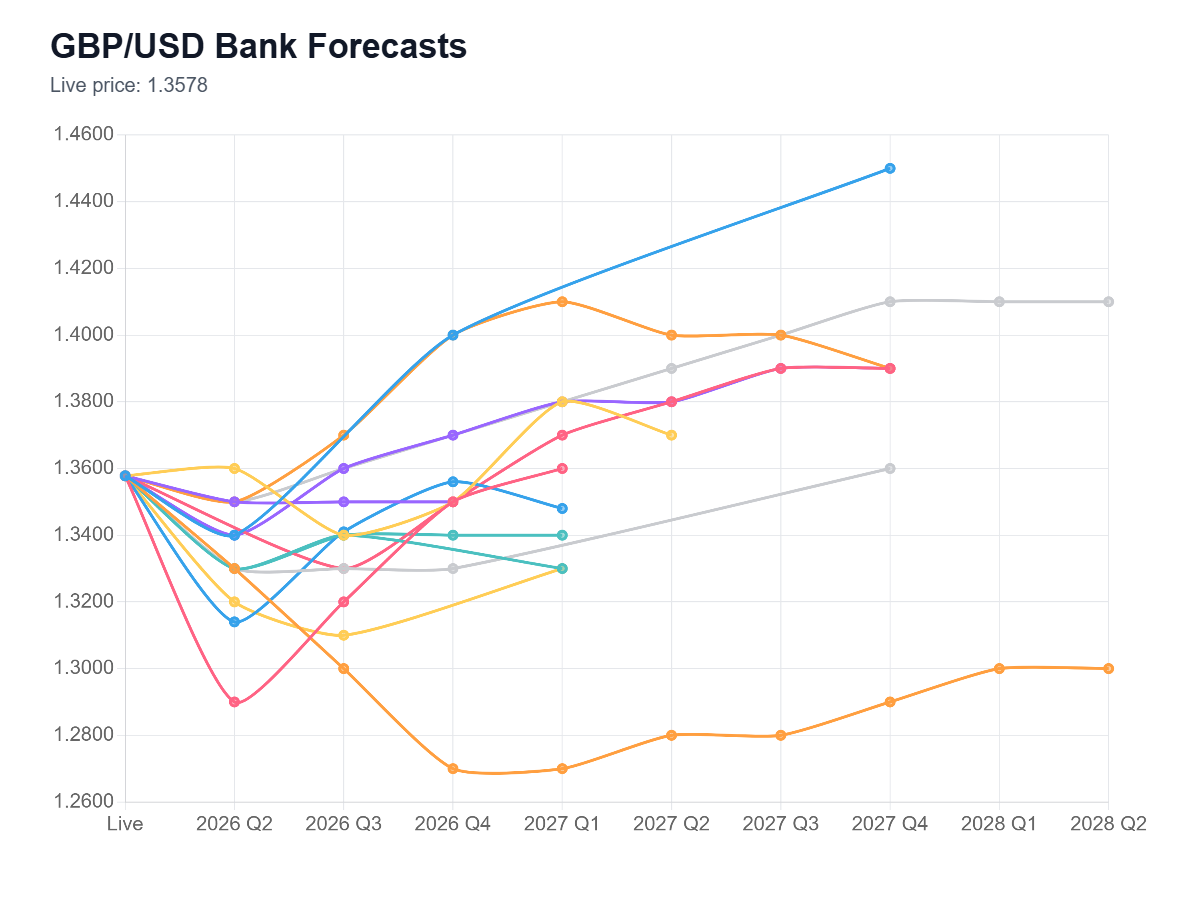
The clustering of pound sterling forecasts in the low-to-mid 1.30s suggests most banks believe GBP/USD is already trading near the upper end of its near-term range.
This follows a strong April performance, with the pair rising over 2% and briefly testing the mid-1.36s before losing momentum into early May.
Many institutions, including Goldman Sachs, ING and SEB, anchor their projections around these levels, reinforcing the idea of a broadly rangebound market.
Near-term expectations therefore point to sideways movement or a modest drift lower, rather than a sustained breakout higher.
Forecast split reflects rising macro uncertainty
While the average forecast is relatively stable, the range of projections is notably wide.
On the upside, banks such as RBC, Westpac and ABN AMRO see GBP/USD climbing back towards 1.40 and beyond over time.
On the downside, Citi and CIBC expect a move towards the high-1.20s, reflecting concerns about the UK outlook.
This divergence reflects an increasingly uncertain macro backdrop.
Geopolitical tensions, particularly the Iran conflict, have been a key driver, with shifts in oil prices and risk sentiment influencing demand for the US dollar as a safe haven.
At the same time, the Bank of England is balancing persistent inflation pressures against slowing growth, leaving policy finely poised and adding to currency volatility.
UK-specific risks are also building, with rising energy costs and weaker growth expectations weighing on sentiment towards sterling.
The latest Exchange Rates UK Research poll suggests GBP/USD is likely to remain anchored around the mid-1.30s in the near term.
However, the widening spread of forecasts indicates that this stability may not last.
With central bank policy, inflation dynamics and geopolitical risks all in flux, future moves are increasingly likely to be driven by external shocks.
For now, the consensus points to a steady range.
But the breadth of forecasts suggests the next decisive move, higher or lower, could be more significant than the average implies.
The BOJ must now determine whether it should defend the growth or the price stability. The pressure has been increasing as Japanese government bond yields are highest in decades.
The currency intervention in Japan also demonstrates the severity of the situation. The authority reportedly intervened and purchased the yen when USDJPY hit 160. According to BOJ data, it was possible that the authorities used as much as 5.48 trillion yen, or approximately $35 billion in the process. However, intervention may not be sufficient. The effect can be short-lived without raising the rates or concerted policy intervention.
The weakness of the yen is due to the fact that U.S. rates are significantly higher than Japanese rates. After the intervention, the pair returned to the area around 155. This is an indication that the policy differences between the Fed and the BOJ are wide in the market.
The threat of a second intervention is extremely high in case USDJPY returns to 160. Japan has intervened in holidays in the past, such as Golden Week in 2024. Traders are wary of history. But the intervention can only cause short term pullbacks unless the BOJ proceeds with a rate hike.
The primary trend is now based on two forces. A hike in BOJ would favor the yen and drive USDJPY down. However, a hawkish Fed may limit this move. If U.S. inflation remains strong and the oil prices are high, the USDJPY can continue to move rather than initiate a downward trend.
The daily chart for USDJPY shows constructive bullish price action during the past two years. However, the pair rejected the strong resistance at the 160 level due to intervention.
Despite this failure at 160, the pair only dropped to 155.50, which keeps the bullish trend active. As long as the pair remains above the 150 level, the overall price structure will still remain positive.
The pair can drop further during the next week, but the immediate support remains at the 154 level at the 200-day SMA. However, a recovery above 162 will indicate a strong rally in the pair, with further weakness in the Japanese yen.
The Australian dollar has broken to a fresh new high against the Japanese yen during the early part of Monday, and this is one of my favorite yen-denominated pairs, as the Australian dollar has been so healthy, and the carry is pretty strong with this one. You get paid fairly well at the end of every day. I think short-term pullbacks offer buying opportunities. I don’t see why this thing doesn’t go to the 116 Yen level unless we get some type of massive shock to the system, which could happen in the Middle East. It doesn’t seem to be going that great, but as things stand right now, I like buying and holding this. I think the Aussie has some distance to cover against the Japanese yen soon.
BitcoinWorld
EUR/GBP Price Forecast Steadies Above 0.8650 as ECB and BoE Decisions Loom – Expert Analysis
The EUR/GBP price forecast remains steady above the 0.8650 mark as traders turn their attention to upcoming policy decisions from the European Central Bank (ECB) and the Bank of England (BoE). This pair, which measures the euro against the British pound, has held a narrow range for several sessions. Market participants now await clear directional signals from two of the world’s most influential central banks.
The EUR/GBP price forecast shows the pair consolidating above the key psychological level of 0.8650. This zone has acted as strong support since early March. Technical analysts point to the 50-day moving average as a critical near-term barrier near 0.8680. A break above this level could open the door toward the 0.8720 resistance area. Conversely, a drop below 0.8630 would signal a bearish shift. The Relative Strength Index (RSI) sits near 50, indicating neutral momentum. Traders watch these levels closely for breakout opportunities.
The European Central Bank’s upcoming meeting heavily influences the EUR/GBP price forecast. Market expectations lean toward a hold on interest rates. However, any hawkish commentary on inflation or growth could lift the euro. ECB President Christine Lagarde’s tone will be crucial. If she signals a potential rate cut later in the year, the euro may weaken. This would push EUR/GBP below the 0.8650 support. On the other hand, a steady stance supports the current range. Investors also monitor eurozone economic data, including GDP and PMI figures, for further clues.
The Bank of England’s policy decision adds another layer of complexity to the EUR/GBP price forecast. The BoE faces a delicate balancing act between controlling inflation and supporting a slowing economy. Analysts widely expect the BoE to hold rates at 5.25%. Any surprise move could trigger significant volatility. A dovish BoE, hinting at rate cuts, would likely weaken the pound. This scenario would push EUR/GBP higher. Conversely, a hawkish hold would strengthen the pound, pulling the pair lower. The market prices in a 60% chance of a hold, with the rest leaning toward a cut.
Beyond central bank decisions, broader macroeconomic factors shape the EUR/GBP price forecast. The UK economy faces persistent inflation, though it has eased from double-digit highs. Meanwhile, the eurozone struggles with stagnant growth. These contrasting conditions create a tug-of-war for the pair. Recent UK retail sales data showed a slight improvement, supporting the pound. However, eurozone industrial production remains weak. Traders also watch geopolitical developments, including trade tensions and energy prices. Any escalation could boost safe-haven demand for the pound, pressuring EUR/GBP lower.
From a technical perspective, the EUR/GBP price forecast hinges on several key levels. The 0.8650 support zone is reinforced by the 100-day moving average. Above it, the 0.8680–0.8700 resistance band is a major hurdle. A daily close above 0.8700 would signal a bullish breakout. Below 0.8650, the next support lies at 0.8600, followed by the 200-day moving average at 0.8570. Volume analysis shows declining activity, suggesting a potential breakout soon. The Bollinger Bands have narrowed, indicating low volatility. This often precedes a sharp move.
Market analysts offer varied views on the EUR/GBP price forecast. Jane Foley, senior FX strategist at Rabobank, notes that the pair is likely to remain range-bound until the ECB and BoE meetings. She emphasizes that any deviation from expected policy could trigger a 1–2% move. Meanwhile, ING analysts highlight the importance of wage data in the UK. Rising wages could keep inflation sticky, forcing the BoE to maintain a hawkish stance. This would favor the pound. Conversely, weaker eurozone data could push the ECB toward a more accommodative stance, weighing on the euro.
Historical data provides additional context for the EUR/GBP price forecast. The pair has shown a tendency to weaken in April, with an average decline of 0.5% over the past decade. However, this pattern is not deterministic. In 2023, EUR/GBP rose 1.2% in April. Traders should consider this alongside current fundamentals. The pair also reacts strongly to UK budget announcements and eurozone inflation releases. The upcoming UK Spring Statement could add volatility. Any fiscal surprises may shift the BoE’s policy path.
Global risk sentiment plays a role in the EUR/GBP price forecast. The pound often behaves as a risk-on currency, while the euro is more neutral. During periods of market stress, investors may sell both currencies for the US dollar. However, relative strength between the two can shift. Recent tensions in the Middle East have increased risk aversion, slightly supporting the pound. A resolution could boost the euro. Traders should monitor equity markets and bond yields for clues. A rally in global stocks typically benefits the pound more than the euro.
Interest rate differentials between the eurozone and the UK directly affect the EUR/GBP price forecast. Currently, the UK base rate stands at 5.25%, compared to the ECB’s 4.50%. This 75-basis-point gap favors the pound. However, expectations of future cuts narrow this advantage. The carry trade, where investors borrow in low-yield currencies to invest in high-yield ones, could shift. If the ECB cuts rates faster than the BoE, the euro weakens. If the BoE cuts first, the pound weakens. Forward markets price in a 50-basis-point cut from both central banks by year-end.
| Central Bank | Current Rate | Expected Year-End Rate |
|---|---|---|
| ECB | 4.50% | 4.00% |
| BoE | 5.25% | 4.75% |
The EUR/GBP price forecast remains steady above 0.8650, with the ECB and BoE decisions as the primary catalysts. Technical levels suggest a range-bound market, but any policy surprise could trigger a breakout. Traders should watch the 0.8680 resistance and 0.8630 support for directional cues. The broader macroeconomic backdrop, including inflation, growth, and risk sentiment, will also shape the pair’s trajectory. As always, staying informed and using proper risk management is essential in these uncertain times.
Q1: What is the current EUR/GBP price forecast?
The EUR/GBP price forecast shows the pair steady above 0.8650, with key support at this level and resistance near 0.8680. The market awaits ECB and BoE decisions for direction.
Q2: How does the ECB decision affect EUR/GBP?
The ECB’s policy stance directly impacts the euro. A hawkish hold supports the euro, while a dovish signal weakens it, influencing the EUR/GBP price forecast.
Q3: What are the key technical levels for EUR/GBP?
Key support levels are 0.8650, 0.8630, and 0.8600. Key resistance levels are 0.8680, 0.8700, and 0.8720. These levels guide the EUR/GBP price forecast.
Q4: Will the BoE cut rates in 2025?
Market expectations suggest a 50-basis-point cut by year-end. However, the exact timing depends on inflation and wage data. This uncertainty affects the EUR/GBP price forecast.
Q5: What is the best strategy for trading EUR/GBP now?
A range-trading strategy near 0.8650–0.8680 may work until a breakout occurs. Use stop-losses below support or above resistance. Monitor central bank news for volatility.
This post EUR/GBP Price Forecast Steadies Above 0.8650 as ECB and BoE Decisions Loom – Expert Analysis first appeared on BitcoinWorld.
The Pound to Dollar (GBP/USD) exchange rate eased to 1.3576, with the pair consolidating after a recent rally as quieter holiday trading conditions limited volatility.
Scotiabank notes that the British Pound Sterling remains supported by a relatively hawkish Bank of England stance, with Governor Bailey signalling an “active hold” on policy.
“Yield spreads (UK-US) are supportive… offering fundamental upside for the GBP.”
The bank highlights that UK-US yield differentials remain near multi-year highs, underpinning the pound and suggesting scope for further gains, particularly as markets are only lightly pricing tightening at the June BoE meeting.
Scotiabank adds that improving sentiment and fading geopolitical concerns could allow sterling to extend its recovery, although UK political uncertainty remains a lingering risk ahead of upcoming local elections.
Scotiabank expects the Pound to Dollar exchange rate (GBP/USD) to trend higher towards the 1.38 area in the near-term, supported by favourable yield spreads and a constructive policy backdrop.
Technical signals are also supportive, with momentum indicators strengthening and the pair clearing key retracement levels.
“Bullish… we note the absence of any material resistance ahead of the January high in the mid/upper-1.38s.”
In the near term, Scotiabank sees the Pound top US Dollar exchange rate (GBP/USD) trading within a 1.3550 to 1.3650 range before attempting further upside.
GBP/USD — Key Rate Highlights:
Current Rate: 1.357600 (01 May 2026, 22:29 UTC)
Daily Move: -0.19% (-0.002630)
Latest Close: 1.357600 (01 May)
May Range: 1.356880 – 1.365781
May Performance: -0.19%
12-Month Range: 1.301020 – 1.385827
Recent Trend: GBP/USD easing slightly after strong April gains, with early May showing mild consolidation
Disclaimer: For information only, not investment advice. This GBP to USD forecast summarises and interprets third-party research; views expressed are those of the original source and may not fully reflect the source’s complete analysis. Neither the source nor we accept liability for reliance on this interpretation.
The Dollar to Yen (USD/JPY) exchange rate traded at 157.07, holding below recent highs after failing to sustain gains above the 160 level amid intervention risks and shifting policy expectations.
Rabobank notes that the Japanese Yen remains one of the weakest G10 performers this year, with the currency still widely used as a funding currency for carry trades.
“The JPY has remained a poor performer in the year to date, with the JPY struggling to throw off its funding currency reputation.”
The bank highlights that while intervention may slow moves, it is unlikely to reverse the broader trend unless supported by fundamentals, suggesting any pullbacks could attract renewed buying interest.
Rabobank expects the outlook to gradually shift in favour of the yen, supported by structural changes in Japan’s economy, a more hawkish Bank of Japan and expectations for Federal Reserve rate cuts later this year.
Rabobank forecasts the Dollar to Yen exchange rate (USD/JPY) will fall to 158 over the next 3 months and to 145 over a 12-month horizon, assuming further BoJ tightening and a more accommodative Fed policy stance.
The bank adds that geopolitical risks, particularly the energy shock linked to the Strait of Hormuz, may delay yen recovery in the near term but should not derail the broader trend.
“On the assumption that the timeframe for the gradual re-opening of the Strait of Hormuz will be in the weeks ahead, rather than in several months’ time, we are sticking with our forecast of USD/JPY ending the year at lower levels.”
The near-term dollar forecast took a hit yesterday on the back of the Japanese intervention and hawkish-leaning ECB and BoE meetings. But the US dollar need not fall too far from here. If anything, I am expecting a swift recovery especially against currencies of economies that rely on oil imports. Crude prices have resumed higher after yesterday’s drop halted a sharp rally. But with the Strait of Hormuz still shut, this should keep crude prices elevated and undermine the EUR/USD forecast.
The move higher in EUR/USD off the back of chatter around a June hike from the European Central Bank felt a touch overdone to me. If anything, it had more to do with dollar softness in the wake of the intervention drama in USD/JPY than genuine euro strength. That leaves the breakout looking a bit vulnerable.
The broader backdrop in the eurozone isn’t exactly reassuring. The data flow has started to lean in a stagflationary direction—growth is losing momentum while inflation expectations remain sticky. You can see that in the slump in Germany’s consumer sentiment and softer business surveys across the bloc. Add in elevated energy costs, and it’s not hard to see why the outlook feels a bit fragile.
In normal circumstances, rising rate expectations would give the currency a decent lift. But this isn’t a normal cycle. If the European Central Bank tightens into a weakening growth backdrop, it risks doing more harm than good. That’s not exactly a recipe for sustained euro strength, even if the market starts leaning towards a more hawkish path.
From a tactical point of view, I’m watching that 1.1750 area on the EUR/USD chart quite closely. If the pair struggles to hold above there it could unwind fairly quickly. A move back through 1.1670 wouldn’t surprise in that scenario. That said, given the strength we’ve seen intraday, I’d want clearer signs of buyers getting caught out before leaning too heavily into that view.
Among the data highlights will be the ISM Services PMI on Tuesday. This is one of the most important gauges of US economic activity, covering the largest part of the economy: services. It’s widely tracked because it can shift expectations for growth and Fed policy, and as it is forward-looking. Through its employment component it offers some pre-NFP leading indication, too.
Speaking of US Nonfarm Payrolls, this will be released on Friday, May 8. The report is the headline event of the week and typically the biggest market mover. The current narrative of low-hire, low-fire has kept the US stock markets ticking along nicely, with investors not yet too concerned about the inflationary implications of the energy shock on the world economy. Following last month’s big surprise of 178K, are we going to see another surprise? A strong print will be bearish for the EUR/USD forecast, while a weak number should provide it support.

— Written by Fawad Razaqzada, Market Analyst
Follow Fawad on Twitter @Trader_F_R


