The GBPJPY pair activated the bearish correctional track, due to its reach below 194.60 level, affected by stochastic exit from the overbought level, which forces it to suffer some losses by reaching 193.90.
Depending on the key support extension on 193.35 level, to increase the chances for activating the bullish track, to step above 194.60 then targeting 195.70 level, while breaking the support will force it suffer extra losses that might extend to 192.65 reaching to the moving average 55.
The expected trading range for today is between 193.35 and 195.00
Trend forecast: Bullish
Do you need help in trading decisions? Do you want to learn how to start trading?
Join Economies.com VIP Club and benefit from over 15 years of market analysis expertise and get:
Full coverage of commodities such as gold, oil, silver, and more
Full coverage of all major forex currency pairs
Full coverage of key global indices and stocks
Full coverage of major cryptocurrencies and meme coins
Accurate analysis and daily updated price forecasts
Exclusive and breaking news
Reliable trading ranges for effective risk management
Comprehensive educational materials, competitions and prizes!
Innovative tools to enhance your trading performance
Special Offer: Subscribe to the Economies.com VIP channel and get also a free subscription to a trusted trading signals channel provided by Best Trading Signal.
The EURJPY pair is affected by the negative pressures, due to its repeated stability below the resistance at 164.90, forming several bearish waves, approaching from the initial support at 163.35 level.
The suggested scenario depends on the stability of the current support, to expect activating the bullish track, which might target 164.20 and 164.90 level gradually, while breaking the support and holding below it will increase the chances for resuming the decline, and 162.40 level represents the next target of the bearish track.
The expected trading range for today is between 163.30 and 164.90
Trend forecast: Bullish
Do you need help in trading decisions? Do you want to learn how to start trading?
Join Economies.com VIP Club and benefit from over 15 years of market analysis expertise and get:
Full coverage of commodities such as gold, oil, silver, and more
Full coverage of all major forex currency pairs
Full coverage of key global indices and stocks
Full coverage of major cryptocurrencies and meme coins
Accurate analysis and daily updated price forecasts
Exclusive and breaking news
Reliable trading ranges for effective risk management
Comprehensive educational materials, competitions and prizes!
Innovative tools to enhance your trading performance
Special Offer: Subscribe to the Economies.com VIP channel and get also a free subscription to a trusted trading signals channel provided by Best Trading Signal.
During the trading session on Tuesday, we have seen the British Pound rallies significantly against the US dollar, gaining roughly 0.8% by the time New York came on board.
That being said, it’s also worth looking at the longer-term charts of the GBP/USD pair, as we have just formed 3 shooting stars on the weekly chart in a row.
As far as technical analysis is concerned, it really doesn’t get a whole lot more bearish than that.
That being said, the market will do what the market will do, and technical analysis is only good for so much. After all, if it all worked 100% of the time, then people would all be wealthy trading in the Forex markets. That being said though, it does suggest that there is a lot of selling pressure above, so I think the upside at this point in time is probably somewhat limited.
Furthermore, there are a lot of reasons to ask whether or not the risk appetite out there would continue to go higher. After all, even though we’ve had some movement between the Americans and the Chinese, the reality is that we are still in a “wait and see” mode.
Overhead Resistance
We have those 3 shooting stars on the weekly chart, but I also see a lot of resistance near the 1.34 level. This is an area that’s been important multiple times in the past, and therefore think you need to pay close attention to after all, longer-term charts can guide the way, as larger positions are certainly placed around these areas, but we also have to keep in mind that you must be flexible enough to take the other trade if you do in fact that signal.
For example, the market were to break above the 1.35 level, then it’s obvious that the sellers have been run over, and that the market should probably go higher. On a break lower from here, the 50 Day EMA sits right around the 1.31 level, and is rising. That could be a little bit of dynamic support, but ultimately, I think we can even drop all the way down to the 1.30 level.
Christopher Lewis has been trading Forex and has over 20 years experience in financial markets. Chris has been a regular contributor to Daily Forex since the early days of the site. He writes about Forex for several online publications, including FX Empire, Investing.com, and his own site, aptly named The Trader Guy. Chris favours technical analysis methods to identify his trades and likes to trade equity indices and commodities as well as Forex. He favours a longer-term trading style, and his trades often last for days or weeks.
Important DisclaimersThe content provided on the website includes general news and publications, our personal analysis and opinions, and contents provided by third parties, which are intended for educational and research purposes only. It does not constitute, and should not be read as, any recommendation or advice to take any action whatsoever, including to make any investment or buy any product. When making any financial decision, you should perform your own due diligence checks, apply your own discretion and consult your competent advisors. The content of the website is not personally directed to you, and we does not take into account your financial situation or needs.The information contained in this website is not necessarily provided in real-time nor is it necessarily accurate. Prices provided herein may be provided by market makers and not by exchanges.Any trading or other financial decision you make shall be at your full responsibility, and you must not rely on any information provided through the website. FX Empire does not provide any warranty regarding any of the information contained in the website, and shall bear no responsibility for any trading losses you might incur as a result of using any information contained in the website.The website may include advertisements and other promotional contents, and FX Empire may receive compensation from third parties in connection with the content. FX Empire does not endorse any third party or recommends using any third party’s services, and does not assume responsibility for your use of any such third party’s website or services.FX Empire and its employees, officers, subsidiaries and associates, are not liable nor shall they be held liable for any loss or damage resulting from your use of the website or reliance on the information provided on this website.Risk DisclaimersThis website includes information about cryptocurrencies, contracts for difference (CFDs) and other financial instruments, and about brokers, exchanges and other entities trading in such instruments. Both cryptocurrencies and CFDs are complex instruments and come with a high risk of losing money. You should carefully consider whether you understand how these instruments work and whether you can afford to take the high risk of losing your money.FX Empire encourages you to perform your own research before making any investment decision, and to avoid investing in any financial instrument which you do not fully understand how it works and what are the risks involved.
GBP/JPY retraces to near 194.45 from the four-month high of 196.50 as the Japanese Yen outperforms.
BoJ’s Uchida expressed confidence in more interest rate hikes ahead.
The UK economy is expected to have grown strongly by 0.6% in the January-March period.
The GBP/JPY pair corrects to near 194.45 during European trading hours on Wednesday from its four-month high of 196.40 posted earlier in the day. The cross retraces sharply as the Japanese Yen (JPY) strengthens across the board after comments from Bank of Japan (BoJ) Deputy Governor Shinichi Uchida indicated that hopes of further interest rate hikes are still alive despite global economic uncertainty in the wake of tariffs announced by United States (US) President Donald Trump.
Japanese Yen PRICE Today
The table below shows the percentage change of Japanese Yen (JPY) against listed major currencies today. Japanese Yen was the strongest against the Australian Dollar.
USD
EUR
GBP
JPY
CAD
AUD
NZD
CHF
USD
-0.32%
-0.21%
-0.98%
-0.00%
0.04%
-0.12%
-0.41%
EUR
0.32%
0.12%
-0.66%
0.32%
0.36%
0.18%
-0.09%
GBP
0.21%
-0.12%
-0.80%
0.20%
0.24%
0.06%
-0.21%
JPY
0.98%
0.66%
0.80%
0.98%
1.02%
0.84%
0.56%
CAD
0.00%
-0.32%
-0.20%
-0.98%
0.04%
-0.12%
-0.40%
AUD
-0.04%
-0.36%
-0.24%
-1.02%
-0.04%
-0.16%
-0.45%
NZD
0.12%
-0.18%
-0.06%
-0.84%
0.12%
0.16%
-0.28%
CHF
0.41%
0.09%
0.21%
-0.56%
0.40%
0.45%
0.28%
The heat map shows percentage changes of major currencies against each other. The base currency is picked from the left column, while the quote currency is picked from the top row. For example, if you pick the Japanese Yen from the left column and move along the horizontal line to the US Dollar, the percentage change displayed in the box will represent JPY (base)/USD (quote).
Japan’s underlying inflation and medium- to long-term inflation expectations are likely to temporarily stagnate. But even during that period, wages are expected to continue rising as Japan’s job market is very tight, Uchida said on Tuesday, Reuters reported.
Meanwhile, the Pound Sterling (GBP) trades calmly ahead of the flash United Kingdom (UK) Q1 Gross Domestic Product (GDP) data, which will be released on Thursday. The UK economy is estimated to have expanded at a robust pace of 0.6%, compared to 0.1% growth seen in the last quarter of 2024.
On the monetary policy front, the Bank of England (BoE) is expected to reduce interest rates further as the UK labor market has cooled down. The Office for National Statistics (ONS) reported that the ILO Unemployment Rate accelerated to 4.5%, as expected, from 4.4% in the three months ending February. In the same period, the economy added 112K fresh workers, significantly lower than the prior release of 206K.
GBP/JPY struggles to extend its upside above the horizontal resistance plotted from the March 27 high of 196.00. However, the outlook of the cross is still bullish as the 20-day Exponential Moving Average (EMA) slopes higher, which trades around 192.32.
The 14-day Relative Strength Index (RSI) retraces to near 60.00 from 67.00. A fresh bullish momentum would emerge if the RSI holds above the 60.00 level.
The pair could extend its upside to near the January 7 high of 198.26 and the psychological level of 200.00 after breaking above the four-month high of 196.40.
On the flip side, a downside move by the pair below the May 6 low of 190.33 will expose it to the March 11 low of 188.80, followed by the February 7 low of 187.00.
GBP/JPY daily chart
Economic Indicator
Gross Domestic Product (QoQ)
The Gross Domestic Product (GDP), released by the Office for National Statistics on a monthly and quarterly basis, is a measure of the total value of all goods and services produced in the UK during a given period. The GDP is considered as the main measure of UK economic activity. The QoQ reading compares economic activity in the reference quarter to the previous quarter. Generally, a rise in this indicator is bullish for the Pound Sterling (GBP), while a low reading is seen as bearish.
GBP/USD benefited from the broad-based US Dollar (USD) weakness on Tuesday and gained nearly 1% on the day. The pair preserves its bullish momentum and trades at a fresh weekly high near 1.3350 in the European session on Wednesday.
April inflation data from the US weighed on the USD on Tuesday, opening the door for a leg higher in GBP/USD during the American trading hours. The US Bureau of Labor Statistics reported that annual inflation, as measured by the change in the Consumer Price Index (CPI), edged lower to 2.3% in April from 2.4% in March. Read more…
GBP/USD primary count suggests a wave (C) bottom amid BoE’s hawkish tone
The GBP/USD 1-hour chart presents a compelling Elliott Wave structure, suggesting the potential completion of a corrective Wave (C) at the recent low near the 1.3140 region. According to the primary count, this could mark a significant inflection point, indicating that the pair may have bottomed out and is beginning a new impulsive rally.
This bullish shift coincides with macroeconomic commentary from Huw Pill, the Chief Economist at the Bank of England, who on Tuesday expressed concerns about inflationary pressures in the UK. Speaking at a London School of Economics conference, Pill emphasized. Read more…
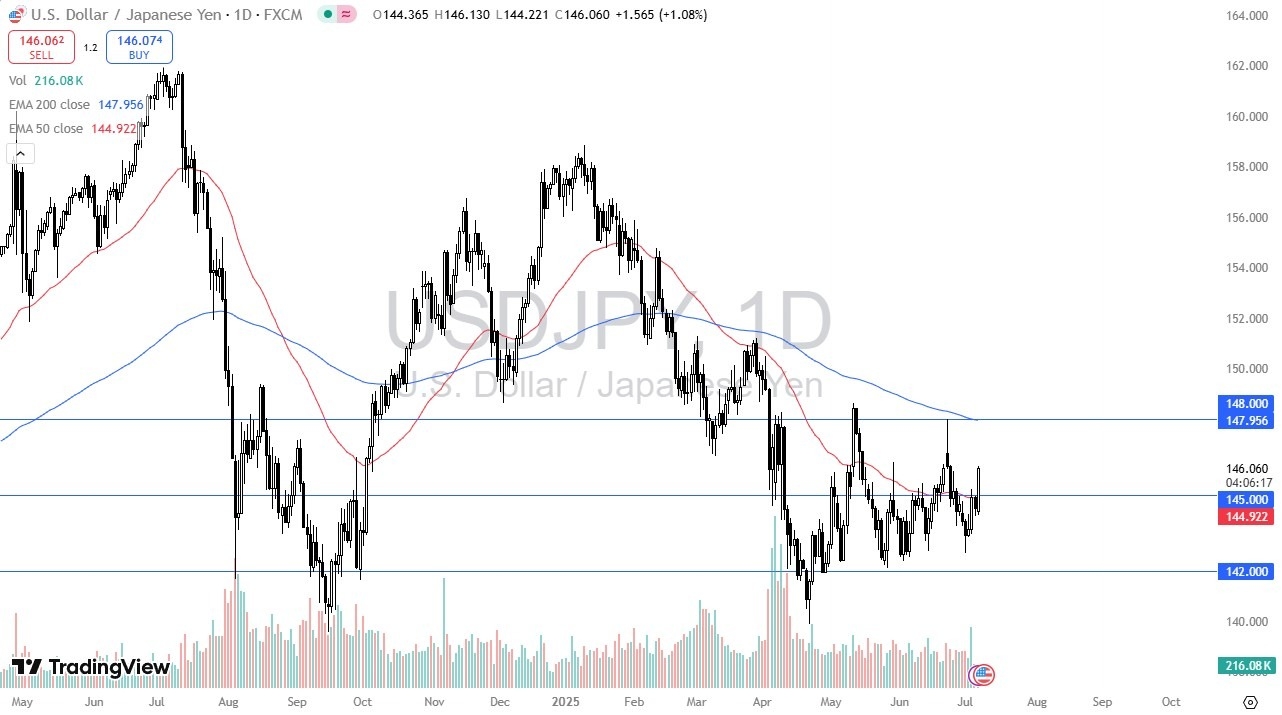
Looking at the US dollar against the Japanese yen, we did pull back just a bit during the trading session here on Tuesday, as the market may have gotten a little bit ahead of itself on Monday.
At this point in time though, short-term pullback should end up being a buying opportunity in this currency pair, as the Japanese yen itself is being sold off against most things.
It’s also worth noting that speculators are net long, but commercials, the so-called smart money, is short three to one in the Japanese yen in the futures market. So that’s an extraordinarily bearish sign for the Japanese yen for this pair. The US dollar pulled back against most things. So, when you look around the horn here against the Japanese yen, most currencies had a very good day.
Despite the USD Dropping, this is About the Yen
So, this is a Japanese yen weakness type of story. The US dollar was sold off pretty drastically. So that’s the only reason this chart looks the way it does. Ultimately though, I think you’ve got a situation where traders will continue to look at this through the prism of a market that needs to sort out a lot of questions when it comes to risk appetite as is the main driver of this market, but you do get paid to hang on to it at the end of the day. And I do think that we are going to try to get 150 yen.
The 200 day EMA sits just below there. So, it’s possible that it could be a bit of a significant barrier. All things being equal, short-term pullbacks, I do think offer plenty of support near the 50 day EMA as well as the 145 yen level underneath offer in support. I am bullish in this pair. think we just made a major double bottom. We’ll have to wait and see if I’m right. But when you look at the longer term charts, you can see that it’s actually not even a double bottom. It’s a triple bottom that’s held at 140 yen. So that’s something to consider.
Christopher Lewis has been trading Forex and has over 20 years experience in financial markets. Chris has been a regular contributor to Daily Forex since the early days of the site. He writes about Forex for several online publications, including FX Empire, Investing.com, and his own site, aptly named The Trader Guy. Chris favours technical analysis methods to identify his trades and likes to trade equity indices and commodities as well as Forex. He favours a longer-term trading style, and his trades often last for days or weeks.
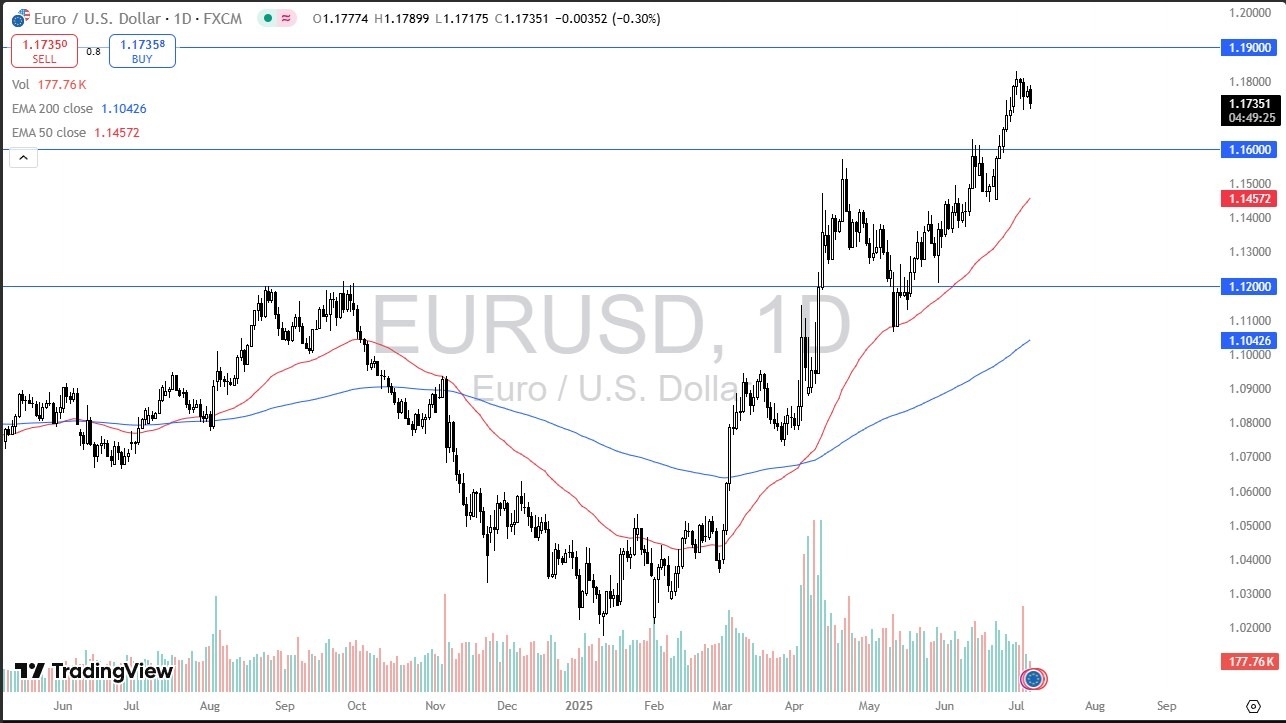
During the session on Tuesday, we saw a significant bounce from the crucial 50 Day EMA, an indicator that a lot of people will look at as potential support.
The fact that we bounced from there, and perhaps even more importantly the 1.11 level, suggest that there is still a certain amount of life left in the Euro still.
That being said, I am watching an area above to see if we get more selling pressure, because when I look at the longer-term charts it seems as if the momentum is starting to swing a little bit more favorably for the US dollar, although there are a lot of different things happening at the same time.
Technical Analysis
The technical analysis for this EUR/USD pair remains bullish, and the fact that we bounce from the 50 Day EMA is something worth noting. However, it would be foolish not to notice the fact that we just broke down through a 100 pips support range in the form of the area between 1.12 and 1.13. This is a market that got a little ahead of itself, and it is worth noting that the 1.12 level was the top of a massive consolidation range that we have been in previously. Because of this, if we do continue to fall from here, we may simply reenter the previous consolidation range as we’ve seen this market have a “throw over” to the downside, so one to the upside makes a certain amount of sense as well.
The size of the candlestick is reasonably strong, but when you look at it through the prism of what happened during the previous 24 hours, it still lacks true conviction. The one thing that does go for it is of course the fact that we bounce from the EMA, and of course the fact that the Euro has been bullish for the last couple of months. Ultimately though, I think we are about to see a lot of noisy behavior because the United States and Europe still do not have a trade agreement, which could cause some issues for the EU itself.
Christopher Lewis has been trading Forex and has over 20 years experience in financial markets. Chris has been a regular contributor to Daily Forex since the early days of the site. He writes about Forex for several online publications, including FX Empire, Investing.com, and his own site, aptly named The Trader Guy. Chris favours technical analysis methods to identify his trades and likes to trade equity indices and commodities as well as Forex. He favours a longer-term trading style, and his trades often last for days or weeks.
The British pound initially pulled back a bit against the Japanese yen, but it has found support at the 195 yen level.
This is an area that is a large round psychologically significant figure and an area that I think you probably would expect to see a little bit of noise regardless.
The shape of the candle is rather impressive, and it does suggest that we have further upward pressure.
At the end of the session, we are closing, at least it looks like we will, at the very top of the range of the day. At this point, I suspect that if we continue to see more risk on behavior, the market will likely try to get to the 198 yen level, possibly even the 200 yen level. Short-term pullbacks, I think at this juncture continue to offer value. And you should keep in the back of your mind that commercial traders are net short of the Japanese yen in the futures market, which gives us an idea as to how the big money might be targeting this market.
Swap Matters Over the Long Term
But also, it’s worth noting that this is a market that pays you at the end of every day to hold on to it. So, there is a reason to pay close attention to that. The 200 yen level is probably a major ceiling, and I don’t necessarily think we break through that easily, but this is a chart that looks like it wants to try to go back there and test that area. Underneath, we have significant support near the 193.50 yen level, and then again at the 200 day EMA, which is close to the 192 yen level. Ultimately, I am bullish, and I do think that short-term pullbacks offer short-term buying opportunities.
Christopher Lewis has been trading Forex and has over 20 years experience in financial markets. Chris has been a regular contributor to Daily Forex since the early days of the site. He writes about Forex for several online publications, including FX Empire, Investing.com, and his own site, aptly named The Trader Guy. Chris favours technical analysis methods to identify his trades and likes to trade equity indices and commodities as well as Forex. He favours a longer-term trading style, and his trades often last for days or weeks.
Platinum price forced to provide slow sideways trading, due to the continuation of the main indicators’ contradiction, to keep its fluctuation near the $991.00 level, while the continuation of forming sold barrier at $1005.00 level will increase the chances for activating the negative track, to attack the moving average 55 at $965.00, then press on the support at $950.00.
While regaining the bullish bias requires forming a strong bullish rally, to surpass 61.8% Fibonacci correction level at to confirm its readiness to record new gains that begin at $1027.00, to confirm its readiness to record new gains that begin at $ 1027.00 and $1040.00.
The expected trading range for today is between $965.00 and $ 1000.00
Trend forecast: Bearish
Do you need help in trading decisions? Do you want to learn how to start trading?
Join Economies.com VIP Club and benefit from over 15 years of market analysis expertise and get:
Full coverage of commodities such as gold, oil, silver, and more
Full coverage of all major forex currency pairs
Full coverage of key global indices and stocks
Full coverage of major cryptocurrencies and meme coins
Accurate analysis and daily updated price forecasts
Exclusive and breaking news
Reliable trading ranges for effective risk management
Comprehensive educational materials, competitions and prizes!
Innovative tools to enhance your trading performance
Special Offer: Subscribe to the Economies.com VIP channel and get also a free subscription to a trusted trading signals channel provided by Best Trading Signal.