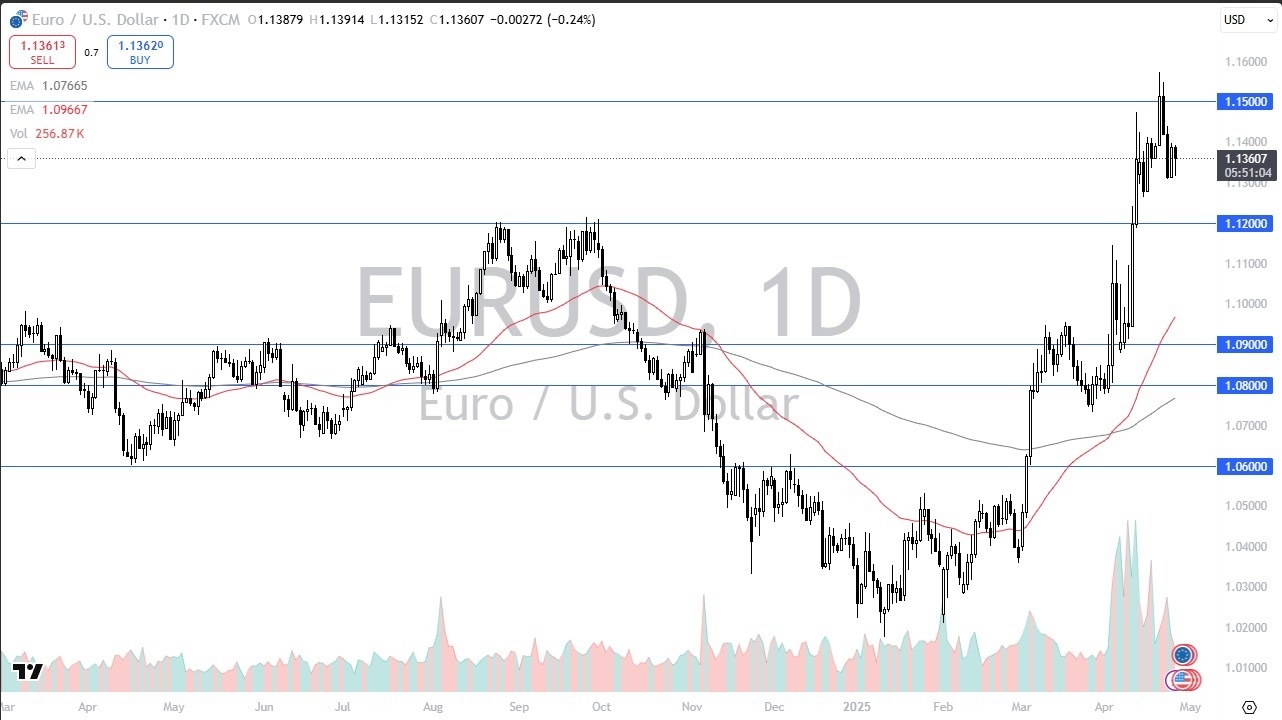
In my daily analysis of the EUR/USD pair, I continue to focus on the 1.03 level below.
This is an area that has acted as support on both Monday and Tuesday, and it’s also an area that’s been important multiple times in the past.
As things stand right now, think you got a situation where rally still have to be looked at with suspicion, as the European Union is most certainly lagging the United States.
Side note, it’s worth noting that the European Union has roughly the same size economy that it had 20 years ago, while the United States has doubled its economy. This is a thing that tells you everything you need to know.
Technical Analysis
I believe that the technical analysis for this market is still very negative, but that doesn’t necessarily mean that you want to short market at extremely low levels. In fact, I would like to see a bit of a bounce so that I can start fading again. This is how I traded in this EUR/USD market for about 2 months now, and so far, it’s worked out quite nicely. The 50 Day EMA is near the 1.0425 level and is dropping. I think that more likely than not will end up being an area that a lot of sellers will enter.
What I need to see is a higher and a long wick to the upside showing signs of exhaustion. As far as buying is concerned, I have no interest in doing so, at least not until we break above the 1.06 level. The level of 1.06 is roughly where the 200 Day EMA is currently sitting at. It’s not until we break above all of that that I think you have a situation where the euro starts to take off to the upside for a sustainable move. Anything between now and then is probably just going to be in the vein of an opportunity to “pick up cheap US dollars.”
The GBPJPY pair succeeded to activate the bullish track, taking advantage of the stability of the major support at 187.00 to form many bullish waves by reaching the previously targeted barrier at 189.50.
Also, resuming the bullish attack this morning and recording additional gains by reaching 191.25 confirm its regain to the bullish bias, to expect getting positive momentum by stochastic to reach 192.30 level soon, followed by attempting to test the MA55 at 193.55.
The expected trading range for today is between 189.70 and 192.30
EUR/JPY soars to near 159.60 amid a notable weakness in the Japanese Yen.
BoJ Ueda warned that food prices could rise and impact inflation expectations.
ECB Galhau cautioned that Trump’s tariffs would have negative impacts on the Eurozone.
The EUR/JPY pair extends its winning spell for the third trading day on Wednesday. The pair strengthens as the Japanese Yen (JPY) weakens across the board despite firm market speculation that the Bank of Japan (BoJ) will continue raising interest rates.
Japanese Yen PRICE Today
The table below shows the percentage change of Japanese Yen (JPY) against listed major currencies today. Japanese Yen was the strongest against the Australian Dollar.
USD
EUR
GBP
JPY
CAD
AUD
NZD
CHF
USD
0.37%
0.43%
1.16%
0.32%
0.77%
0.73%
0.20%
EUR
-0.37%
0.06%
0.78%
-0.05%
0.38%
0.34%
-0.18%
GBP
-0.43%
-0.06%
0.71%
-0.12%
0.32%
0.29%
-0.24%
JPY
-1.16%
-0.78%
-0.71%
-0.80%
-0.36%
-0.41%
-0.93%
CAD
-0.32%
0.05%
0.12%
0.80%
0.45%
0.40%
-0.12%
AUD
-0.77%
-0.38%
-0.32%
0.36%
-0.45%
-0.04%
-0.57%
NZD
-0.73%
-0.34%
-0.29%
0.41%
-0.40%
0.04%
-0.53%
CHF
-0.20%
0.18%
0.24%
0.93%
0.12%
0.57%
0.53%
The heat map shows percentage changes of major currencies against each other. The base currency is picked from the left column, while the quote currency is picked from the top row. For example, if you pick the Japanese Yen from the left column and move along the horizontal line to the US Dollar, the percentage change displayed in the box will represent JPY (base)/USD (quote).
The BoJ raised its key borrowing rates by 25 basis points (bps) to 0.5% in the January policy meeting as inflationary pressures remain well above the 2% target for longer. BoJ officials have also guided a hawkish monetary policy outlook on the assumption that wages would continue to grow.
Earlier in the day, BoJ Governor Kazuo Ueda warned that “food prices may continue to remain high” and will impact “people’s mindsets and price expectations”, Reuters report.
Meanwhile, the Euro (EUR) outperforms its peers despite deepening fears of potential tariffs by United States (US) President Donald Trump on the Eurozone. Donald Trump is poised to announce reciprocal tariffs sooner and market participants expect that Eurozone will face higher levies on auto. The European Union (EU) charges 10% tariffs on imports of automobiles from the US and pays 2.5% import duty for domestic autos supplied to them.
In European trading hours, European Central Bank (ECB) policymaker and Bank of France head Francois Villeroy de Galhau warned that Trump’s trade policies would most likely have a “negative impact on the economy.”
EUR/JPY bounces back strongly after revisiting the four-month low around 156.00. The asset retraces to near the 20-day Exponential Moving Average (EMA), which trades around 159.80. The 14-day Relative Strength Index (RSI) returns into the 40.00-60.00 range, which indicates that the bearish momentum has ended for now.
Going forward, a decisive move by the pair above the February 5 high of 160.30 would open doors for the February 3 high of 160.84, followed by the January 30 high of 161.80.
On the flip side, a downside move by the cross below the February 10 low of 155.67 would expose it to the August 5 low of 154.40 and 7 December 2023 low of 153.17.
EUR/JPY daily chart
Euro FAQs
The Euro is the currency for the 19 European Union countries that belong to the Eurozone. It is the second most heavily traded currency in the world behind the US Dollar. In 2022, it accounted for 31% of all foreign exchange transactions, with an average daily turnover of over $2.2 trillion a day. EUR/USD is the most heavily traded currency pair in the world, accounting for an estimated 30% off all transactions, followed by EUR/JPY (4%), EUR/GBP (3%) and EUR/AUD (2%).
The European Central Bank (ECB) in Frankfurt, Germany, is the reserve bank for the Eurozone. The ECB sets interest rates and manages monetary policy. The ECB’s primary mandate is to maintain price stability, which means either controlling inflation or stimulating growth. Its primary tool is the raising or lowering of interest rates. Relatively high interest rates – or the expectation of higher rates – will usually benefit the Euro and vice versa. The ECB Governing Council makes monetary policy decisions at meetings held eight times a year. Decisions are made by heads of the Eurozone national banks and six permanent members, including the President of the ECB, Christine Lagarde.
Eurozone inflation data, measured by the Harmonized Index of Consumer Prices (HICP), is an important econometric for the Euro. If inflation rises more than expected, especially if above the ECB’s 2% target, it obliges the ECB to raise interest rates to bring it back under control. Relatively high interest rates compared to its counterparts will usually benefit the Euro, as it makes the region more attractive as a place for global investors to park their money.
Data releases gauge the health of the economy and can impact on the Euro. Indicators such as GDP, Manufacturing and Services PMIs, employment, and consumer sentiment surveys can all influence the direction of the single currency. A strong economy is good for the Euro. Not only does it attract more foreign investment but it may encourage the ECB to put up interest rates, which will directly strengthen the Euro. Otherwise, if economic data is weak, the Euro is likely to fall. Economic data for the four largest economies in the euro area (Germany, France, Italy and Spain) are especially significant, as they account for 75% of the Eurozone’s economy.
Another significant data release for the Euro is the Trade Balance. This indicator measures the difference between what a country earns from its exports and what it spends on imports over a given period. If a country produces highly sought after exports then its currency will gain in value purely from the extra demand created from foreign buyers seeking to purchase these goods. Therefore, a positive net Trade Balance strengthens a currency and vice versa for a negative balance.
GBP/USD holds near 1.2450 after posting strong gains on Tuesday.
The technical picture highlights sellers’ hesitancy in the near term.
The US economic calendar will feature January inflation data.
Following the bearish action seen at the beginning of the week, GBP/USD reversed its direction on Tuesday and gained more than 0.6%. Ahead of the key January inflation data from the US, the pair holds above key technical area.
British Pound PRICE This week
The table below shows the percentage change of British Pound (GBP) against listed major currencies this week. British Pound was the strongest against the Japanese Yen.
USD
EUR
GBP
JPY
CAD
AUD
NZD
CHF
USD
-0.41%
-0.37%
1.46%
0.16%
-0.06%
0.37%
0.14%
EUR
0.41%
0.11%
1.99%
0.69%
0.35%
0.87%
0.64%
GBP
0.37%
-0.11%
1.72%
0.55%
0.24%
0.76%
0.52%
JPY
-1.46%
-1.99%
-1.72%
-1.32%
-1.43%
-1.07%
-1.28%
CAD
-0.16%
-0.69%
-0.55%
1.32%
-0.19%
0.18%
-0.04%
AUD
0.06%
-0.35%
-0.24%
1.43%
0.19%
0.52%
0.28%
NZD
-0.37%
-0.87%
-0.76%
1.07%
-0.18%
-0.52%
-0.24%
CHF
-0.14%
-0.64%
-0.52%
1.28%
0.04%
-0.28%
0.24%
The heat map shows percentage changes of major currencies against each other. The base currency is picked from the left column, while the quote currency is picked from the top row. For example, if you pick the British Pound from the left column and move along the horizontal line to the US Dollar, the percentage change displayed in the box will represent GBP (base)/USD (quote).
The US Dollar (USD) came under selling pressure on Tuesday, allowing GBP/USD gain traction. The lack of fresh headlines surrounding US President Donald Trump’s trade policy and Federal Reserve (Fed) Chairman Jerome Powell’s hesitancy to offer fresh insight into the policy outlook helped market mood improve in the American session.
On the first day of his congressional testimony on the semi-annual Monetary Policy Report, Powell repeated that they do not need to be in a hurry to adjust the monetary policy. He added that it’s not for the Fed to comment on tariffs and explained that they will follow incoming data to assess the effects of the trade policy.
In the second half of the day, January Consumer Price Index (CPI) data from the US will be watched closely by market participants. On a monthly basis, the core CPI, which excludes volatile food and energy prices, is forecast to rise 0.3%. A stronger increase than expected could support the USD with the initial reaction and cause GBP/USD to turn south. Conversely, a soft monthly core inflation reading of 0.2% or lower could have the opposite impact on the pair’s action.
Early Thursday, the UK’s Office for National Statistics (ONS) will publish the Gross Domestic Product (GDP) data for the fourth quarter.
GBP/USD Technical Analysis
GBP/USD holds comfortably above the ascending trend line and the 200-period and the 100-period Simple Moving Averages (SMA), reflecting the bullish bias. Additionally, the Relative Strength Index (RSI) indicator on the 4-hour chart stays above 50.
In case GBP/USD confirms 1.2450 (Fibonacci 50% retracement of the latest downtrend) as support, it could target 1.2500 (round level, static level) and 1.2530 (Fibonacci 61.8% retracement) next. On the downside, supports could be seen at 1.2415 (100-period SMA) and 1.2380-1.2370 (200-period SMA, Fibonacci 38.2% retracement, ascending trend line).
Pound Sterling FAQs
The Pound Sterling (GBP) is the oldest currency in the world (886 AD) and the official currency of the United Kingdom. It is the fourth most traded unit for foreign exchange (FX) in the world, accounting for 12% of all transactions, averaging $630 billion a day, according to 2022 data. Its key trading pairs are GBP/USD, also known as ‘Cable’, which accounts for 11% of FX, GBP/JPY, or the ‘Dragon’ as it is known by traders (3%), and EUR/GBP (2%). The Pound Sterling is issued by the Bank of England (BoE).
The single most important factor influencing the value of the Pound Sterling is monetary policy decided by the Bank of England. The BoE bases its decisions on whether it has achieved its primary goal of “price stability” – a steady inflation rate of around 2%. Its primary tool for achieving this is the adjustment of interest rates. When inflation is too high, the BoE will try to rein it in by raising interest rates, making it more expensive for people and businesses to access credit. This is generally positive for GBP, as higher interest rates make the UK a more attractive place for global investors to park their money. When inflation falls too low it is a sign economic growth is slowing. In this scenario, the BoE will consider lowering interest rates to cheapen credit so businesses will borrow more to invest in growth-generating projects.
Data releases gauge the health of the economy and can impact the value of the Pound Sterling. Indicators such as GDP, Manufacturing and Services PMIs, and employment can all influence the direction of the GBP. A strong economy is good for Sterling. Not only does it attract more foreign investment but it may encourage the BoE to put up interest rates, which will directly strengthen GBP. Otherwise, if economic data is weak, the Pound Sterling is likely to fall.
Another significant data release for the Pound Sterling is the Trade Balance. This indicator measures the difference between what a country earns from its exports and what it spends on imports over a given period. If a country produces highly sought-after exports, its currency will benefit purely from the extra demand created from foreign buyers seeking to purchase these goods. Therefore, a positive net Trade Balance strengthens a currency and vice versa for a negative balance.
EUR/USD trades in the positive territory above 1.0350 on Wednesday.
January inflation data from the US will be watched closely by market participants.
The near-term technical outlook points to a bullish tilt.
EUR/USD gained traction in the second half of the day on Tuesday and rose more than 0.5%. The pair trades marginally higher on the day above 1.0350 in the European session on Wednesday and the technical outlook points to a buildup of bullish momentum.
Euro PRICE This week
The table below shows the percentage change of Euro (EUR) against listed major currencies this week. Euro was the strongest against the Japanese Yen.
USD
EUR
GBP
JPY
CAD
AUD
NZD
CHF
USD
-0.39%
-0.36%
1.44%
0.12%
-0.08%
0.36%
0.24%
EUR
0.39%
0.10%
1.97%
0.62%
0.30%
0.84%
0.70%
GBP
0.36%
-0.10%
1.70%
0.49%
0.20%
0.74%
0.60%
JPY
-1.44%
-1.97%
-1.70%
-1.35%
-1.44%
-1.07%
-1.17%
CAD
-0.12%
-0.62%
-0.49%
1.35%
-0.17%
0.21%
0.08%
AUD
0.08%
-0.30%
-0.20%
1.44%
0.17%
0.54%
0.38%
NZD
-0.36%
-0.84%
-0.74%
1.07%
-0.21%
-0.54%
-0.13%
CHF
-0.24%
-0.70%
-0.60%
1.17%
-0.08%
-0.38%
0.13%
The heat map shows percentage changes of major currencies against each other. The base currency is picked from the left column, while the quote currency is picked from the top row. For example, if you pick the Euro from the left column and move along the horizontal line to the US Dollar, the percentage change displayed in the box will represent EUR (base)/USD (quote).
In the absence of high-impact data releases, the modest improvement seen in market mood made it difficult for the US Dollar (USD) to find demand on Tuesday, helping EUR/USD push higher. Meanwhile, Federal Reserve (Fed) Chairman Jerome Powell refrained from providing any fresh hints regarding the policy outlook.
While testifying on the semi-annual Monetary Policy Report before the Senate Banking Committee on Tuesday, Powell reiterated that they do not need to be in a hurry to adjust the monetary policy. “The US is economy strong overall; inflation is closer to 2% goal but still somewhat elevated,” he added.
Later in the day, the US Bureau of Labor Statistics will publish the Consumer Price Index (CPI) data for January. Markets expect the core CPI, which excludes volatile food and energy prices, to rise 0.3% on a monthly basis. A print above the market consensus could weigh on risk mood and boost the USD with the immediate reaction, forcing EUR/USD to reverse its direction. On the other hand, a softer-than-forecast monthly core inflation reading could allow the pair to build on Tuesday’s gains.
Powell will testify before the House Financial Services Committee on Wednesday but he is likely to read the same exact statement from the first day of his testimony.
EUR/USD Technical Analysis
The Relative Strength Index (RSI) indicator rose to 60 and EUR/USD closed the last three 4-hour candles above the 200-period Simple Moving Average (SMA), reflecting an increasing buyer interest.
EUR/USD could face stiff resistance at 1.0390-1.0400 (100-period SMA, Fibonacci 50% retracement of the latest downtrend) ahead of 1.0440 (Fibonacci 61.8% retracement) and 1.0500-1.0510 (round level, Fibonacci 78.6% retracement).
On the downside, first support area could be spotted at 1.0290-1.0300 (Fibonacci 23.6% retracement of the latest downtrend, round level) before 1.0250 (static level) and 1.0200 (round level, static level).
Euro FAQs
The Euro is the currency for the 19 European Union countries that belong to the Eurozone. It is the second most heavily traded currency in the world behind the US Dollar. In 2022, it accounted for 31% of all foreign exchange transactions, with an average daily turnover of over $2.2 trillion a day. EUR/USD is the most heavily traded currency pair in the world, accounting for an estimated 30% off all transactions, followed by EUR/JPY (4%), EUR/GBP (3%) and EUR/AUD (2%).
The European Central Bank (ECB) in Frankfurt, Germany, is the reserve bank for the Eurozone. The ECB sets interest rates and manages monetary policy. The ECB’s primary mandate is to maintain price stability, which means either controlling inflation or stimulating growth. Its primary tool is the raising or lowering of interest rates. Relatively high interest rates – or the expectation of higher rates – will usually benefit the Euro and vice versa. The ECB Governing Council makes monetary policy decisions at meetings held eight times a year. Decisions are made by heads of the Eurozone national banks and six permanent members, including the President of the ECB, Christine Lagarde.
Eurozone inflation data, measured by the Harmonized Index of Consumer Prices (HICP), is an important econometric for the Euro. If inflation rises more than expected, especially if above the ECB’s 2% target, it obliges the ECB to raise interest rates to bring it back under control. Relatively high interest rates compared to its counterparts will usually benefit the Euro, as it makes the region more attractive as a place for global investors to park their money.
Data releases gauge the health of the economy and can impact on the Euro. Indicators such as GDP, Manufacturing and Services PMIs, employment, and consumer sentiment surveys can all influence the direction of the single currency. A strong economy is good for the Euro. Not only does it attract more foreign investment but it may encourage the ECB to put up interest rates, which will directly strengthen the Euro. Otherwise, if economic data is weak, the Euro is likely to fall. Economic data for the four largest economies in the euro area (Germany, France, Italy and Spain) are especially significant, as they account for 75% of the Eurozone’s economy.
Another significant data release for the Euro is the Trade Balance. This indicator measures the difference between what a country earns from its exports and what it spends on imports over a given period. If a country produces highly sought after exports then its currency will gain in value purely from the extra demand created from foreign buyers seeking to purchase these goods. Therefore, a positive net Trade Balance strengthens a currency and vice versa for a negative balance.
GBP/JPY gains ground to around 191.20 in Wednesday’s early European session.
The cross keeps the negative outlook below the 100-period EMA with the bearish RSI indicator.
The initial support level is seen at 187.70; the key upside barrier to watch is 193.50.
The GBP/JPY cross trades in positive territory near 191.20 during the early European session on Wednesday. The Japanese Yen (JPY) weakens amid the concern that US President Donald Trump’s no-exemption taxes on commodity imports could jeopardize Japan’s economic recovery.
Early Wednesday, Japan’s Finance Minister, Katsunobu Kato, noted that he will assess the impact of US tariffs on the Japanese economy and respond appropriately.
Technically, the bearish outlook of GBP/JPY remains in place as the cross remains capped below the key 100-day Exponential Moving Average (EMA) on the daily chart. Furthermore, the downward momentum is supported by the Relative Strength Index (RSI), which is located below the midline near 47.45, suggesting that the path of least resistance is to the downside.
The lower limit of the Bollinger Band at 187.70 acts as an initial support level for the cross. A decisive break below the mentioned level could expose the 187.05-187.00 region, representing the low of February 7 and the psychological mark. Further south, the next contention level is seen at 184.37, the low of September 13, 2024.
On the bright side, the key resistance level for GBP/JPY emerges near 193.50, the 100-day EMA. Sustained trading above this level could pave the way to 195.15, the upper boundary of the Bollinger Band. The additional upside filter to watch is 197.41, the high of January 6.
GBP/JPY daily chart
Japanese Yen FAQs
The Japanese Yen (JPY) is one of the world’s most traded currencies. Its value is broadly determined by the performance of the Japanese economy, but more specifically by the Bank of Japan’s policy, the differential between Japanese and US bond yields, or risk sentiment among traders, among other factors.
One of the Bank of Japan’s mandates is currency control, so its moves are key for the Yen. The BoJ has directly intervened in currency markets sometimes, generally to lower the value of the Yen, although it refrains from doing it often due to political concerns of its main trading partners. The BoJ ultra-loose monetary policy between 2013 and 2024 caused the Yen to depreciate against its main currency peers due to an increasing policy divergence between the Bank of Japan and other main central banks. More recently, the gradually unwinding of this ultra-loose policy has given some support to the Yen.
Over the last decade, the BoJ’s stance of sticking to ultra-loose monetary policy has led to a widening policy divergence with other central banks, particularly with the US Federal Reserve. This supported a widening of the differential between the 10-year US and Japanese bonds, which favored the US Dollar against the Japanese Yen. The BoJ decision in 2024 to gradually abandon the ultra-loose policy, coupled with interest-rate cuts in other major central banks, is narrowing this differential.
The Japanese Yen is often seen as a safe-haven investment. This means that in times of market stress, investors are more likely to put their money in the Japanese currency due to its supposed reliability and stability. Turbulent times are likely to strengthen the Yen’s value against other currencies seen as more risky to invest in.
The GBPJPY pair succeeded to activate the bullish track, taking advantage of the stability of the major support at 187.00 to form many bullish waves by reaching the previously targeted barrier at 189.50.
Also, resuming the bullish attack this morning and recording additional gains by reaching 191.25 confirm its regain to the bullish bias, to expect getting positive momentum by stochastic to reach 192.30 level soon, followed by attempting to test the MA55 at 193.55.
The expected trading range for today is between 189.70 and 192.30
Hedera’s currency price (HBARUSDT) rose in the intraday levels, while trying to recoup some recent losses, as it also vented off oversold saturation in the RSI with positive signals coming out of it, amid the dominance of the downward correctional wave in the short term, with negative pressure due to trading below the 50-day SMA.
Therefore we expect the price to return lower, targeting the support of $6.928, provided it settles firmly below the resistance of $9.818.
Hedera’s currency price (HBARUSDT) rose in the intraday levels, while trying to recoup some recent losses, as it also vented off oversold saturation in the RSI with positive signals coming out of it, amid the dominance of the downward correctional wave in the short term, with negative pressure due to trading below the 50-day SMA.
Therefore we expect the price to return lower, targeting the support of $6.928, provided it settles firmly below the resistance of $9.818.
Important DisclaimersThe content provided on the website includes general news and publications, our personal analysis and opinions, and contents provided by third parties, which are intended for educational and research purposes only. It does not constitute, and should not be read as, any recommendation or advice to take any action whatsoever, including to make any investment or buy any product. When making any financial decision, you should perform your own due diligence checks, apply your own discretion and consult your competent advisors. The content of the website is not personally directed to you, and we does not take into account your financial situation or needs.The information contained in this website is not necessarily provided in real-time nor is it necessarily accurate. Prices provided herein may be provided by market makers and not by exchanges.Any trading or other financial decision you make shall be at your full responsibility, and you must not rely on any information provided through the website. FX Empire does not provide any warranty regarding any of the information contained in the website, and shall bear no responsibility for any trading losses you might incur as a result of using any information contained in the website.The website may include advertisements and other promotional contents, and FX Empire may receive compensation from third parties in connection with the content. FX Empire does not endorse any third party or recommends using any third party’s services, and does not assume responsibility for your use of any such third party’s website or services.FX Empire and its employees, officers, subsidiaries and associates, are not liable nor shall they be held liable for any loss or damage resulting from your use of the website or reliance on the information provided on this website.Risk DisclaimersThis website includes information about cryptocurrencies, contracts for difference (CFDs) and other financial instruments, and about brokers, exchanges and other entities trading in such instruments. Both cryptocurrencies and CFDs are complex instruments and come with a high risk of losing money. You should carefully consider whether you understand how these instruments work and whether you can afford to take the high risk of losing your money.FX Empire encourages you to perform your own research before making any investment decision, and to avoid investing in any financial instrument which you do not fully understand how it works and what are the risks involved.