The main tag of Forex News Today Articles.
You can use the search box below to find what you need.
[wd_asp id=1]
15
12, 2024
EUR/USD Attempts to Halt Five-Day Selloff
US Dollar Outlook: EUR/USD
EUR/USD attempts to halt a five-day selloff as it recovers from a fresh monthly low (1.0453), but the exchange rate may struggle to retain the rebound from the yearly low (1.0333) as it continues to carve a series of lower highs and lows.
US Dollar Forecast: EUR/USD Attempts to Halt Five-Day Selloff
EUR/USD may track the negative slope in the 50-Day SMA (1.0697) as it no longer trades within the opening range for December, and the weakness following the US election may persist as the exchange rate holds below the moving average.
Join David Song for the Weekly Fundamental Market Outlook webinar.
David provides a market overview and takes questions in real-time. Register Here
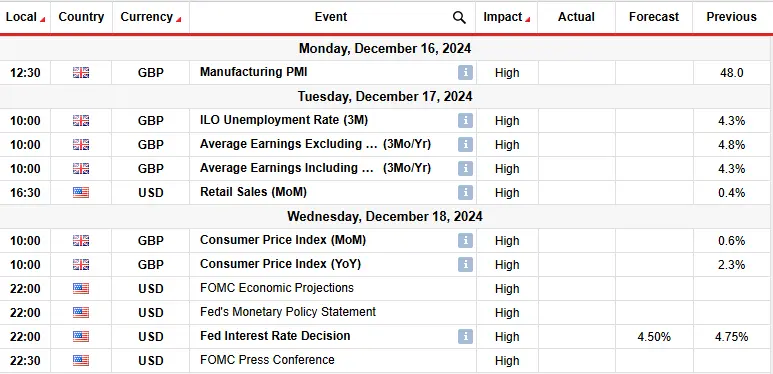
US Economic Calendar
Nevertheless, the Federal Reserve rate decision may sway EUR/USD as the central bank is expected to cut US interest rates by another 25bp at its last meeting for 2024, and more of the same from the Federal Open Market Committee (FOMC) may drag on the US Dollar as Chairman Jerome Powell and Co. pursue a netural stance.
With that said, EUR/USD may trade within the November range should the FOMC stay on track to further unwind its restricitve policy in 2025, but the Fed’s Summary of Economic Projections (SEP) may generate a bullish reaction in the Greenback if the update reveals an upward revision in the interest rate dot-plot.
EUR/USD Chart – Daily

Chart Prepared by David Song, Strategist; EUR/USD on TradingView
- EUR/USD fails to hold within the opening range for December as it carves a series of lower highs and lows, with a break/close below the 1.0448 (2023 low) to 1.0480 (100% Fibonacci extension) zone raising the scope for a move towards 1.0370 (38.2% Fibonacci extension).
- A breach below the yearly low (1.0333) opens up 1.0200 (23.6% Fibonacci retracement), but lack of momentum to break/close below the 1.0448 (2023 low) to 1.0480 (100% Fibonacci extension) zone may keep EUR/USD within the November range.
- Need a close above the 1.0580 (78.6% Fibonacci extension) to 1.0610 (38.2% Fibonacci retracement) region to bring 1.0660 (61.8% Fibonacci extension) back on the radar, with the next area of interest coming in around 1.0710 (50% Fibonacci extension).
Additional Market Outlooks
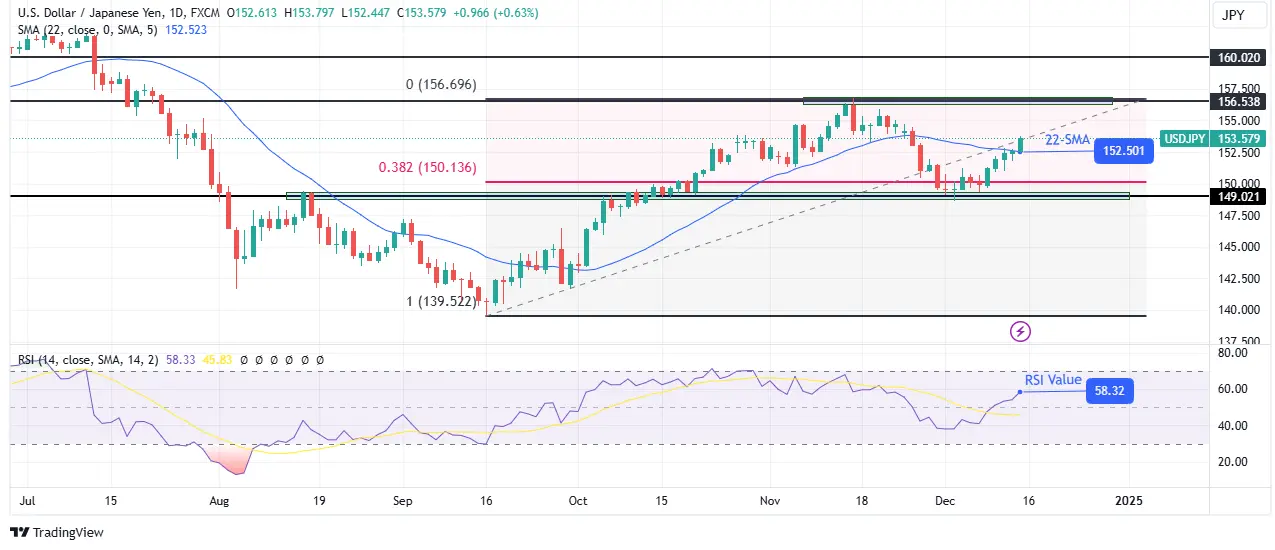
USD/JPY Stages Five-Day Rally for First Time Since June
Gold Price Forecast: Bullion Remains Below Pre-US Election Prices
Canadian Dollar Forecast: USD/CAD Climbs to Fresh Yearly High
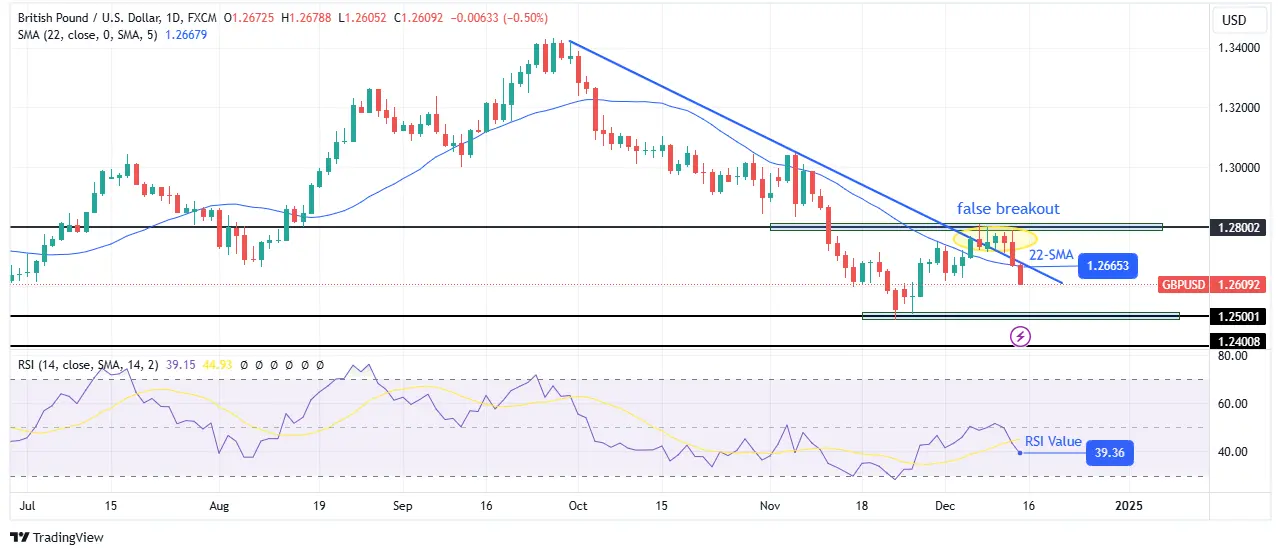
GBP/USD Outlook Hinges on Break of December Opening Range
— Written by David Song, Senior Strategist
Follow on Twitter at @DavidJSong


")


")