The main tag of Forex News Today Articles.
You can use the search box below to find what you need.
[wd_asp id=1]

16 01, 2025

Japanese Yen Technical Analysis: USD/JPY, GBP/JPY, EUR/JPY

By |2025-01-16T02:09:07+02:00January 16, 2025|Forex News, News|0 Comments

Japanese Yen Talking Points:

  • Japanese Yen strength showed against the U.S. Dollar in the aftermath of this morning’s U.S. CPI report.
  • While questions remain around the Fed’s ability to cut rates this year, both Europe and the U.K. could drive bearish fundamental backdrops, making the prospect of carry unwind in GBP/JPY and EUR/JPY as more attractive concepts.
  • I look into these pairs each week in the Tuesday webinar, and you’re welcome to join: Click here for registration information.

USD/JPY Support Break


The U.S. Dollar showed a move of weakness around the U.S. CPI print this morning, and while DXY has bounced back and the EUR/USD sell-off has caught another shot-in-the-arm, USD/JPY is holding relatively close to the morning’s lows.

There’s also the breach of a support zone that had showed as prior resistance, taken from the 76.4 and 78.6% Fibonacci retracements of the July-September sell-off. This zone had previously helped to hold resistance in November, but more recently it had helped to hold support over the past two weeks, until this morning’s breach down to a lower-low.


USD/JPY Daily Price Chart

Chart prepared by James Stanley, USD/JPY on Tradingview

Get our exclusive guide to USD/JPY trading in 2025

USD/JPY Four-Hour


On a shorter-term basis we can see where this morning’s sell-off brought upon a fresh 2025 low in the pair; but the bounce from that has, so far, held resistance at the bottom of the support zone noted above.

For overhead resistance, there’s a prior swing-low at 156.91 and the top of the Fibonacci zone at 157.17. And for next support below the 156.00 handle, it’s the 155.00 psychological level that looms large.


USD/JPY Four-Hour Chart

usdjpy four hour 11525Chart prepared by James Stanley, USD/JPY on Tradingview


GBP/JPY


It’s been a slippery start to the year for the British Pound and I had looked at GBP/JPY in the weekly forecast, highlighting a bearish backdrop as prices had started to push below a long-term zone. Monday saw another spill in GBP/JPY and the pair made a fast push down to the 190.00 handle before catching a sizable bounce. Resistance held overnight at 193.00 and sellers have went back for another run, but chasing this at this point could be a challenge.

From the weekly chart below, we can see a longer-term trend that’s come more and more into question, as shown by lower-highs over the past six months. But if the pair gives up the 190.00 level, the door could soon open to breakdown scenarios.


GBP/JPY Weekly Chart

gbpjpy weekly 11525Chart prepared by James Stanley, GBP/JPY on Tradingview


GBP/JPY Four-Hour


Given how quickly the pair has moved off of that 193.00 level, chasing could be challenging. But, there’s also context for a lower-high around the 192.40 level; and if that doesn’t come into the picture, the 190.81 Fibonacci level could potential be used to work with breakdown scenarios into the 190.00 psychological level.


GBP/JPY Four-Hour Price Chart

gbpjpy four hour 11525Chart prepared by James Stanley, GBP/JPY on Tradingview


EUR/JPY


EUR/JPY is currently within a symmetrical triangle formation and earlier this week, it was around the 160.00 level that had held the lows after bears attempted to continue the sell-off that started after resistance at the 165.00 level around the end of 2024.

Similar to GBP/JPY above, that can be a tough move to chase. But the weekly chart shows the bigger-picture where, if we do see a notable sell-off and a breach of recent congestion, a longer-term move could come into play.


EUR/JPY Weekly Chart

eurjpy weekly 11525Chart prepared by James Stanley, EUR/JPY on Tradingview


EUR/JPY Four-Hour


From the four-hour chart of EUR/JPY, we can see another Fibonacci level coming into play at 160.90 to help hold the lows so far today. This is quite near the earlier week swing low and this could, again, be a challenging place to chase price-lower. But – it does highlight lower-high resistance potential at 161.44 or 162.04, both of which could keep the door open for a 160.00 test.

Or – if no pullback shows, a breach of 160.00 opens the door to bigger picture breakdown potential, with the next notable level-lower the Fibonacci level at 158.66.


EUR/JPY Four-Hour Chart

eurjpy four hour 11525Chart prepared by James Stanley, EUR/JPY on Tradingview


— written by James Stanley, Senior Strategist


Japanese Yen Talking Points:

  • Japanese Yen strength showed against the U.S. Dollar in the aftermath of this morning’s U.S. CPI report.
  • While questions remain around the Fed’s ability to cut rates this year, both Europe and the U.K. could drive bearish fundamental backdrops, making the prospect of carry unwind in GBP/JPY and EUR/JPY as more attractive concepts.
  • I look into these pairs each week in the Tuesday webinar, and you’re welcome to join: Click here for registration information.

USD/JPY Support Break


The U.S. Dollar showed a move of weakness around the U.S. CPI print this morning, and while DXY has bounced back and the EUR/USD sell-off has caught another shot-in-the-arm, USD/JPY is holding relatively close to the morning’s lows.

There’s also the breach of a support zone that had showed as prior resistance, taken from the 76.4 and 78.6% Fibonacci retracements of the July-September sell-off. This zone had previously helped to hold resistance in November, but more recently it had helped to hold support over the past two weeks, until this morning’s breach down to a lower-low.


USD/JPY Daily Price Chart

usdjpy daily 11525Chart prepared by James Stanley, USD/JPY on Tradingview


USDJPY AD


USD/JPY Four-Hour


On a shorter-term basis we can see where this morning’s sell-off brought upon a fresh 2025 low in the pair; but the bounce from that has, so far, held resistance at the bottom of the support zone noted above.

For overhead resistance, there’s a prior swing-low at 156.91 and the top of the Fibonacci zone at 157.17. And for next support below the 156.00 handle, it’s the 155.00 psychological level that looms large.


USD/JPY Four-Hour Chart

usdjpy four hour 11525Chart prepared by James Stanley, USD/JPY on Tradingview


GBP/JPY


It’s been a slippery start to the year for the British Pound and I had looked at GBP/JPY in the weekly forecast, highlighting a bearish backdrop as prices had started to push below a long-term zone. Monday saw another spill in GBP/JPY and the pair made a fast push down to the 190.00 handle before catching a sizable bounce. Resistance held overnight at 193.00 and sellers have went back for another run, but chasing this at this point could be a challenge.

From the weekly chart below, we can see a longer-term trend that’s come more and more into question, as shown by lower-highs over the past six months. But if the pair gives up the 190.00 level, the door could soon open to breakdown scenarios.


GBP/JPY Weekly Chart

gbpjpy weekly 11525Chart prepared by James Stanley, GBP/JPY on Tradingview
 

GBP/JPY Four-Hour


Given how quickly the pair has moved off of that 193.00 level, chasing could be challenging. But, there’s also context for a lower-high around the 192.40 level; and if that doesn’t come into the picture, the 190.81 Fibonacci level could potential be used to work with breakdown scenarios into the 190.00 psychological level.


GBP/JPY Four-Hour Price Chart

gbpjpy four hour 11525Chart prepared by James Stanley, GBP/JPY on Tradingview


EUR/JPY


EUR/JPY is currently within a symmetrical triangle formation and earlier this week, it was around the 160.00 level that had held the lows after bears attempted to continue the sell-off that started after resistance at the 165.00 level around the end of 2024.

Similar to GBP/JPY above, that can be a tough move to chase. But the weekly chart shows the bigger-picture where, if we do see a notable sell-off and a breach of recent congestion, a longer-term move could come into play.


EUR/JPY Weekly Chart

eurjpy weekly 11525Chart prepared by James Stanley, EUR/JPY on Tradingview


EUR/JPY Four-Hour


From the four-hour chart of EUR/JPY, we can see another Fibonacci level coming into play at 160.90 to help hold the lows so far today. This is quite near the earlier week swing low and this could, again, be a challenging place to chase price-lower. But – it does highlight lower-high resistance potential at 161.44 or 162.04, both of which could keep the door open for a 160.00 test.

Or – if no pullback shows, a breach of 160.00 opens the door to bigger picture breakdown potential, with the next notable level-lower the Fibonacci level at 158.66.


EUR/JPY Four-Hour Chart

eurjpy four hour 11525Chart prepared by James Stanley, EUR/JPY on Tradingview


— written by James Stanley, Senior Strategist

Source link

16 01, 2025

GBP/USD Bulls Emerge at Support

By |2025-01-16T00:08:10+02:00January 16, 2025|Forex News, News|0 Comments

British Pound Technical Forecast: GBP/USD Weekly Trade Levels

  • British Pound poised to mark fourth-monthly decline- bulls responding to key technical support
  • GBP/USD risk for near-term price inflection- Retail sales, U.S. Presidential Inauguration on tap
  • Resistance 1.2367/97, 1.2494 (key), 1.26- Support 1.2084-1.2114 (key), 1.1841/89, 1.1632

The British Pound has plunged more than 3.3% since the start of month / year with GBP/USD responding to key support this week. The four-month decline may be vulnerable while above his key inflection zone and the immediate focus on this recovery in the days ahead. Battle lines drawn on the GBP/USD weekly technical chart.

Review my latest Weekly Strategy Webinar for an in-depth breakdown of this Sterling setup and more. Join live on Monday’s at 8:30am EST.

British Pound Price Chart – GBP/USD Weekly


Chart Prepared by Michael Boutros, Sr. Technical Strategist; GBP/USD on TradingView

Technical Outlook: In last month’s British Pound Weekly Forecast we noted that the GBP/USD was trading into resistance at a major pivot zone with, “the immediate focus is on a breakout of the monthly range with the broader outlook still weighted to the downside while below 1.2850.” Support broke two-weeks later with Sterling plunging more than 5.2% off the December highs.

The decline responded to key support on Monday at the 2023 yearly open / 2023 low-week close (LWC) at 1.2084-1.2114. Looking for a reaction off this mark with the immediate short-bias vulnerable while above.

Initial weekly resistance is eyed at 1.2367/97– a region defined by the April low-close, the 2023 January high-week close (HWC) and the May low-week close (LWC). Note that basic channel resistance converges on this threshold over the next few weeks and further highlight the technical significance of this threshold. Ultimately, a breach / close above the 2024 LWC at 1.2494 would be needed to suggest a more significant low was registered this week / a larger trend reversal is underway (bearish invalidation).

A break / weekly close below this key pivot zone would threaten another bout of accelerated losses with subsequent support objectives seen at the January 2024 swing low / 50% retracement of the 2022 advance at 1.1841/89 and the 2020 LWC at 1.1632– both areas of interest for possible exhaustion / price inflection IF reached.

Get our exclusive guide to GBP/USD trading in 2025

Bottom line: A four-month sell-off takes GBP/USD into pivotal support – risk for possible inflection off this zone. From a trading standpoint, a good region to reduce short-positioning / lower protective stops- rallies should be limited to 1.2397 IF price is heading lower on this stretch with a close below 1.2084 needed to mark downtrend resumption.

Keep in mind we get the release of US & UK retail sales data the close of the week with key UK employment data and the inauguration of President Trump on tap early next week. Stay nimble into the release and watch the weekly closes here for guidance. Review my latest British Pound Short-term Outlook for a closer look at the near-term GBP/USD technical trade levels.

GBP/USD Economic Data Releases

 UK US Economic Calendar-GBPUSD Data Releases- GBP USD Weekly Event Risk-1-15-2025

Economic Calendar – latest economic developments and upcoming event risk.

Active Weekly Technical Charts

— Written by Michael Boutros, Sr Technical Strategist with FOREX.com

Follow Michael on X @MBForex


Source link

15 01, 2025

GBP/USD, USD/JPY Forecast: Two trades to watch

By |2025-01-15T22:07:11+02:00January 15, 2025|Forex News, News|0 Comments

GBP/USD rises after UK inflation cools

  • UK CPI falls to 2.5% YoY from 2.6%
  • Service sector inflation falls to 4.4% from 5%
  • Rate cut expectations rise 12 basis points
  • GBP/USD inches higher

GBP/USD is edging higher after cooler-than-expected inflation helped pull gilt yields lower

UK CPI unexpectedly fell to 2.5% YoY in December, down from 2.6% and below forecasts of 2.7%. Meanwhile, service sector inflation, which the Bank of England is watching closely, cooled by more than expected to 4.4%, well below the 4.8% predicted and down from 5% in November. Sticky service sector inflation has hindered the BoE from cutting interest rates further.

 Following the data the market has ramped up BoE rate cut expectations, adding 12 basis points to bets for 2025 cuts, which are now seen at 49 basis points across the year. This is still short of the central bank’s forecast for 4 rate cuts this year.

Usually, with rising rate cut expectations, the pound would fall. However, today’s data has also pulled guilty yields sharply lower, dropping by around 9 basis points on the 2-year bond, the most sensitive to Bank of England policy, which is helping to support the pound.

The data is a step in the right direction but it doesn’t mean that the UK is out of the woods just yet, particularly given that a recent survey by the British Retail Consortium shows that 2/3 of retailers will raise prices in response to higher employer Social Security costs from the budget which bodes poorly for progress in disinflation outlook. Meanwhile, the same survey of chief financial officers and finance directors at 52 major retailers found that around half plan to reduce staff hours and headcount.

There are also growing worries about UK growth, which has been on a downward trajectory since labour came to power in July. This, combined with the prospect of sticky inflation, means a stagflationary outlook is a very real problem. UK GDP data is due tomorrow and will provide further clues about the health of the UK economy.

Attention also turns to the US CPI, which is due later today and is expected to rise to 2.9% from 2.7%. What inflation could further dampen rate cut expectations, boosting the USD and pulling GBP USD lower?

GBP/USD forecast – technical analysis

GBP/USD trended lower from 1.34 to a low of 1.21 at the start of the week. The price recovered from 1.21 and trades back above the 1.22 level, bringing the RSI out of oversold territory. The long-term downtrend remains intact, but the hammer candlestick and the long lower wicks on candles this week suggest that the bottom could be in, and a bullish reversal could be in the cards.

Buyers will look to extend gains above 1.23, the April low, before focusing on 1.25, the December low into focus.

Sellers will need to take out the 1.21 low to extend losses to 1.2050, the 2023 low, and 1.20, the psychological level.

gbp/usd forecast chart


USD/JPY falls ahead of US CPI

  • Yen rises after hawkish BoJ comments
  • US CPI is expected to rise to 2.9% from 2.7%
  • USD/JPY tests 157.1 support

USD/JPY is falling amid a stronger yen following hawkish BoJ’s Ueda remarks. However, those gains could be short-lived ahead of US inflation data.

Governor Ueda reiterated the central bank’s commitment to raising borrowing costs if the economy continues to improve. His comments followed days of the OJ deputy governor him me know on Tuesday. The end raise as markets priced in the possibility of a rate hike at next weeks meeting.

Comments from Finance Minister Kato, who revived concerns about potential government intervention in the FX markets, also supported the yen.

Attention is now turning to US inflation data, which is expected to show that CPI increased 2.9% from 2.7% in November, marking its fifth straight monthly increase and moving further from the Fed’s 2% target.

Worries about hot inflation are already rampant in the market, with treasury yields elevated. I mean, the resilient U.S. economy and ahead of Trump’s administration. Trump is expected to implement inflationary policies.

Hotter-than-expected inflation could see the market further resist Fed rate cut bets. Currently, the market sees just one rate shot right at the end of this year. This could see USD/JPY recover higher above 158.

USD/JPY forecast – technical analysis

After a strong run-up from the 148.65 low, USD/JPY has been consolidating just below 158. The price is testing support at the 78.6% fib retracement at 157.10, as the MACD shows a bearish cross-over.

Should sellers meaningfully break below 157.10 and 156.75 the November high, a deeper selloff towards 155 round number and 152.40 the 61.8% fib level could be on the cards.

Should the 157.10-156.75 support zone hold, buyers will look to extend gains above 168.80, the 2025 high, towards 160 and 162, the 2024 high.

usd/jpy forecast chart


Source link

15 01, 2025

GBP/USD, USD/JPY Forecast: Two trades to watch

By |2025-01-15T20:06:08+02:00January 15, 2025|Forex News, News|0 Comments

GBP/USD rises after UK inflation cools

  • UK CPI falls to 2.5% YoY from 2.6%
  • Service sector inflation falls to 4.4% from 5%
  • Rate cut expectations rise 12 basis points
  • GBP/USD inches higher

GBP/USD is edging higher after cooler-than-expected inflation helped pull gilt yields lower

UK CPI unexpectedly fell to 2.5% YoY in December, down from 2.6% and below forecasts of 2.7%. Meanwhile, service sector inflation, which the Bank of England is watching closely, cooled by more than expected to 4.4%, well below the 4.8% predicted and down from 5% in November. Sticky service sector inflation has hindered the BoE from cutting interest rates further.

 Following the data the market has ramped up BoE rate cut expectations, adding 12 basis points to bets for 2025 cuts, which are now seen at 49 basis points across the year. This is still short of the central bank’s forecast for 4 rate cuts this year.

Usually, with rising rate cut expectations, the pound would fall. However, today’s data has also pulled guilty yields sharply lower, dropping by around 9 basis points on the 2-year bond, the most sensitive to Bank of England policy, which is helping to support the pound.

The data is a step in the right direction but it doesn’t mean that the UK is out of the woods just yet, particularly given that a recent survey by the British Retail Consortium shows that 2/3 of retailers will raise prices in response to higher employer Social Security costs from the budget which bodes poorly for progress in disinflation outlook. Meanwhile, the same survey of chief financial officers and finance directors at 52 major retailers found that around half plan to reduce staff hours and headcount.

There are also growing worries about UK growth, which has been on a downward trajectory since labour came to power in July. This, combined with the prospect of sticky inflation, means a stagflationary outlook is a very real problem. UK GDP data is due tomorrow and will provide further clues about the health of the UK economy.

Attention also turns to the US CPI, which is due later today and is expected to rise to 2.9% from 2.7%. What inflation could further dampen rate cut expectations, boosting the USD and pulling GBP USD lower?

GBP/USD forecast – technical analysis

GBP/USD trended lower from 1.34 to a low of 1.21 at the start of the week. The price recovered from 1.21 and trades back above the 1.22 level, bringing the RSI out of oversold territory. The long-term downtrend remains intact, but the hammer candlestick and the long lower wicks on candles this week suggest that the bottom could be in, and a bullish reversal could be in the cards.

Buyers will look to extend gains above 1.23, the April low, before focusing on 1.25, the December low into focus.

Sellers will need to take out the 1.21 low to extend losses to 1.2050, the 2023 low, and 1.20, the psychological level.

gbp/usd forecast chart


USD/JPY falls ahead of US CPI

  • Yen rises after hawkish BoJ comments
  • US CPI is expected to rise to 2.9% from 2.7%
  • USD/JPY tests 157.1 support

USD/JPY is falling amid a stronger yen following hawkish BoJ’s Ueda remarks. However, those gains could be short-lived ahead of US inflation data.

Governor Ueda reiterated the central bank’s commitment to raising borrowing costs if the economy continues to improve. His comments followed days of the OJ deputy governor him me know on Tuesday. The end raise as markets priced in the possibility of a rate hike at next weeks meeting.

Comments from Finance Minister Kato, who revived concerns about potential government intervention in the FX markets, also supported the yen.

Attention is now turning to US inflation data, which is expected to show that CPI increased 2.9% from 2.7% in November, marking its fifth straight monthly increase and moving further from the Fed’s 2% target.

Worries about hot inflation are already rampant in the market, with treasury yields elevated. I mean, the resilient U.S. economy and ahead of Trump’s administration. Trump is expected to implement inflationary policies.

Hotter-than-expected inflation could see the market further resist Fed rate cut bets. Currently, the market sees just one rate shot right at the end of this year. This could see USD/JPY recover higher above 158.

USD/JPY forecast – technical analysis

After a strong run-up from the 148.65 low, USD/JPY has been consolidating just below 158. The price is testing support at the 78.6% fib retracement at 157.10, as the MACD shows a bearish cross-over.

Should sellers meaningfully break below 157.10 and 156.75 the November high, a deeper selloff towards 155 round number and 152.40 the 61.8% fib level could be on the cards.

Should the 157.10-156.75 support zone hold, buyers will look to extend gains above 168.80, the 2025 high, towards 160 and 162, the 2024 high.

usd/jpy forecast chart


Source link

15 01, 2025

GBP/USD Forecast: Sterling Rises Despite Weaker UK CPI

By |2025-01-15T18:05:03+02:00January 15, 2025|Forex News, News|0 Comments

  • UK consumer inflation increased by a smaller-than-expected 2.5% annually.
  • Market participants increased the likelihood of a Feb BoE rate cut from 60% to 80%.
  • Economists expect US consumer inflation to increase by 2.6% annually.

The GBP/USD forecast shows a bright day for the pound despite downbeat UK inflation figures. A decline in UK yields has relieved the currency after its recent plunge. On the other hand, the dollar halted its rally after soft wholesale inflation data. Moreover, traders eagerly await the CPI report for more clues on future Fed moves. 

-Are you looking for tips for forex trading? Check out the details-

Data on Wednesday revealed that UK consumer inflation increased by 2.5% annually. This was a smaller number than the forecast of 2.6%. As a result, market participants increased the likelihood of a Feb BoE rate cut from 60% to 80%.

The pound dropped in response, but only for a while. The increase in rate-cut bets also led to a drop in UK yields, which have rallied in recent weeks. The rally had caused uncertainty about UK finances and the economy, hurting the pound. Therefore, Wednesday’s pullback came as a welcome surprise, boosting sterling.

The pound also got support from a weak dollar. The greenback eased on Tuesday after cooler-than-expected wholesale inflation data. However, all focus is on the upcoming US consumer inflation report. Economists expect inflation to increase by 2.6% annually, holding from the previous month. A surprising number will cause volatility by shifting the outlook for Fed rate cuts.

GBP/USD key events today

  • US core CPI m/m
  • US CPI m/m
  • US CPI y/y

GBP/USD technical forecast: Pullback pauses as 30-SMA poses a challenge

GBP/USD Forecast: Sterling Rises Despite Weaker UK CPI
GBP/USD 4-hour chart

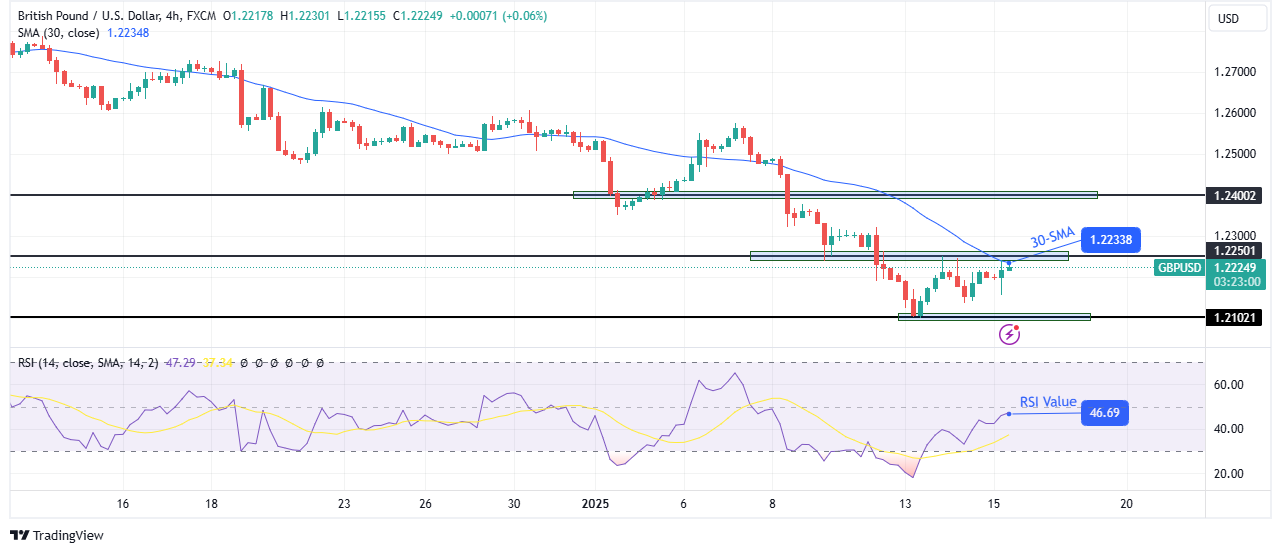
On the technical side, the GBP/USD price has rebounded to retest the 30-SMA resistance after making a new low at the 1.2102 support level. At the same time, the price has revisited the 1.2250 resistance level. However, the downtrend remains intact as the price trades below the 30-SMA with the RSI in bearish territory. 

-Are you looking for crypto exchanges? Check our detailed guide-

The rebound has been a corrective move, with both bears and bulls showing some strength. However, the price must make an impulsive leg for the price to start trending. Therefore, if bears are ready to resume the downtrend, the price will make a new swing low below the 1.2102 support level. 

On the other hand, an impulsive leg to break above the 30-SMA would signal a shift in sentiment that would likely lead to a bullish reversal.

Looking to trade forex now? Invest at eToro!

67% of retail investor accounts lose money when trading CFDs with this provider. You should consider whether you can afford to take the high risk of losing your money.

Source link

15 01, 2025

GBP/USD, USD/JPY Forecast: Two trades to watch

By |2025-01-15T16:04:05+02:00January 15, 2025|Forex News, News|0 Comments

GBP/USD rises after UK inflation cools

  • UK CPI falls to 2.5% YoY from 2.6%
  • Service sector inflation falls to 4.4% from 5%
  • Rate cut expectations rise 12 basis points
  • GBP/USD inches higher

GBP/USD is edging higher after cooler-than-expected inflation helped pull gilt yields lower

UK CPI unexpectedly fell to 2.5% YoY in December, down from 2.6% and below forecasts of 2.7%. Meanwhile, service sector inflation, which the Bank of England is watching closely, cooled by more than expected to 4.4%, well below the 4.8% predicted and down from 5% in November. Sticky service sector inflation has hindered the BoE from cutting interest rates further.

 Following the data the market has ramped up BoE rate cut expectations, adding 12 basis points to bets for 2025 cuts, which are now seen at 49 basis points across the year. This is still short of the central bank’s forecast for 4 rate cuts this year.

Usually, with rising rate cut expectations, the pound would fall. However, today’s data has also pulled guilty yields sharply lower, dropping by around 9 basis points on the 2-year bond, the most sensitive to Bank of England policy, which is helping to support the pound.

The data is a step in the right direction but it doesn’t mean that the UK is out of the woods just yet, particularly given that a recent survey by the British Retail Consortium shows that 2/3 of retailers will raise prices in response to higher employer Social Security costs from the budget which bodes poorly for progress in disinflation outlook. Meanwhile, the same survey of chief financial officers and finance directors at 52 major retailers found that around half plan to reduce staff hours and headcount.

There are also growing worries about UK growth, which has been on a downward trajectory since labour came to power in July. This, combined with the prospect of sticky inflation, means a stagflationary outlook is a very real problem. UK GDP data is due tomorrow and will provide further clues about the health of the UK economy.

Attention also turns to the US CPI, which is due later today and is expected to rise to 2.9% from 2.7%. What inflation could further dampen rate cut expectations, boosting the USD and pulling GBP USD lower?

GBP/USD forecast – technical analysis

GBP/USD trended lower from 1.34 to a low of 1.21 at the start of the week. The price recovered from 1.21 and trades back above the 1.22 level, bringing the RSI out of oversold territory. The long-term downtrend remains intact, but the hammer candlestick and the long lower wicks on candles this week suggest that the bottom could be in, and a bullish reversal could be in the cards.

Buyers will look to extend gains above 1.23, the April low, before focusing on 1.25, the December low into focus.

Sellers will need to take out the 1.21 low to extend losses to 1.2050, the 2023 low, and 1.20, the psychological level.

gbp/usd forecast chart


USD/JPY falls ahead of US CPI

  • Yen rises after hawkish BoJ comments
  • US CPI is expected to rise to 2.9% from 2.7%
  • USD/JPY tests 157.1 support

USD/JPY is falling amid a stronger yen following hawkish BoJ’s Ueda remarks. However, those gains could be short-lived ahead of US inflation data.

Governor Ueda reiterated the central bank’s commitment to raising borrowing costs if the economy continues to improve. His comments followed days of the OJ deputy governor him me know on Tuesday. The end raise as markets priced in the possibility of a rate hike at next weeks meeting.

Comments from Finance Minister Kato, who revived concerns about potential government intervention in the FX markets, also supported the yen.

Attention is now turning to US inflation data, which is expected to show that CPI increased 2.9% from 2.7% in November, marking its fifth straight monthly increase and moving further from the Fed’s 2% target.

Worries about hot inflation are already rampant in the market, with treasury yields elevated. I mean, the resilient U.S. economy and ahead of Trump’s administration. Trump is expected to implement inflationary policies.

Hotter-than-expected inflation could see the market further resist Fed rate cut bets. Currently, the market sees just one rate shot right at the end of this year. This could see USD/JPY recover higher above 158.

USD/JPY forecast – technical analysis

After a strong run-up from the 148.65 low, USD/JPY has been consolidating just below 158. The price is testing support at the 78.6% fib retracement at 157.10, as the MACD shows a bearish cross-over.

Should sellers meaningfully break below 157.10 and 156.75 the November high, a deeper selloff towards 155 round number and 152.40 the 61.8% fib level could be on the cards.

Should the 157.10-156.75 support zone hold, buyers will look to extend gains above 168.80, the 2025 high, towards 160 and 162, the 2024 high.

usd/jpy forecast chart


Source link

15 01, 2025

EUR/USD Analysis Today 15/01: Temporary Halt (Chart)

By |2025-01-15T14:03:22+02:00January 15, 2025|Forex News, News|0 Comments

  • For the second consecutive trading day, the EUR/USD currency pair has attempted to halt its recent sharp decline, which extended to a low of 1.0177, the lowest level for the currency pair in over two years.
  • Stability is cautious until the announcement of US inflation figures, which will strongly affect expectations for the future policies of the US Federal Reserve under Trump.

Central Bank Policies Impact Exchange Rates

According to recent trades, investors in the $13 trillion high-grade corporate bond market are focusing on an unprecedented divergence between expected US and European monetary policy paths. US Treasury yields are likely to outperform their European counterparts as the European Central Bank is still expected to deliver several interest rates cuts this year, while the Federal Reserve is seen keeping US interest rates higher for longer, according to some fund managers.

This divergence has not been seen early in the year for as long as Bloomberg has tracked interest rate expectations for the US Federal Reserve, the European Central Bank, and the Bank of England. The only notable divergence at the beginning of the year was recorded in 2023, when traders were pricing in rising interest rates – a backdrop typically associated with falling bond prices – rather than cuts.

Also, the divergence between the policies of the European Central Bank and the Federal Reserve weighs heavily on the euro-dollar exchange rate.

Interest Rate Expectations for 2025

Investors and markets expect the European Central Bank to cut interest rates by 25 basis points more than three times by the end of 2025, even after they lowered their expectations in recent days. In contrast, they expect only one cut from the US Federal Reserve after US jobs data showed that the US labor market remains strong. According to officials, the European Central Bank should continue to cut interest rates, regardless of what the US Federal Reserve does.

In general, market expectations for central bank cuts can certainly change quickly with the release of new economic data. At the beginning of December 2024, traders were pricing in more than three cuts by the Federal Reserve in 2025.

Trading Tips:

Dear follower of the TradersUp website, the euro-dollar is still on its way to parity. So, be careful, do not take risks, and always monitor the factors affecting the performance of the currency pair.

EUR/USD Technical Analysis Today:

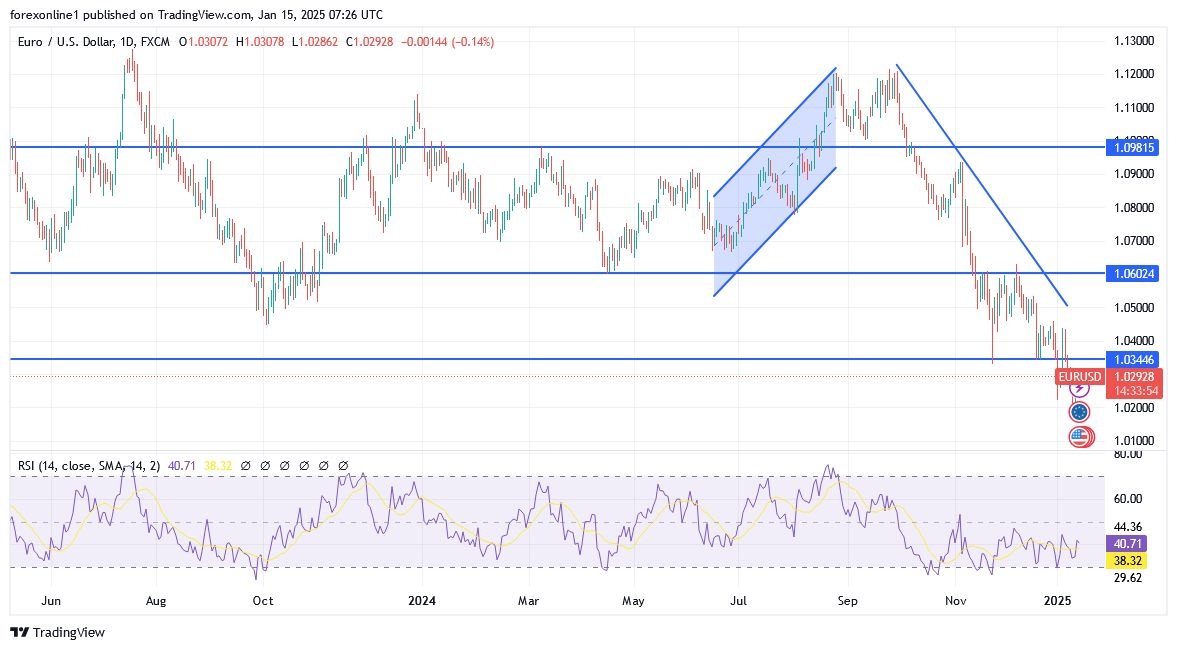
Dear reader, there is no change in my technical outlook for the EUR/USD pair. The overall trend remains bearish, and the recent rebound is temporary. Investors are awaiting important US economic events. Currently, the closest support levels for the euro dollar are 1.0220, 1.0170, and 1.0080. technically, these levels are sufficient to push technical indicators towards oversold levels. The Relative Strength Index and the MACD are in the bearish zone. Furthermore, we still recommend selling the euro dollar at every opportunity.

Ready to trade our daily Forex forecast? Here’s a list of some of the top forex brokers in Europe to check out.

Source link

15 01, 2025

The EURJPY keeps the negative track – Forecast today – 15-1-2025

By |2025-01-15T12:02:11+02:00January 15, 2025|Forex News, News|0 Comments

Platinum price lost the positive momentum yesterday to force it to form temporary negative rebound and notice its stability near the additional support 935.00$, to settle above it and reinforce the chances of renewing the bullish attempts again.


Also, 920.00 level continues to form major support against the current trades, allowing us to wait to gather the positive momentum again to manage to surpass the MA55 at 955.00$ followed by extending trades towards the next main target at 983.00$.


The expected trading range for today is between 930.00$ and 955.00$


Trend forecast: Bullish


Source link

15 01, 2025

The GBPUSD price within negative pattern – Forecast today

By |2025-01-15T10:00:45+02:00January 15, 2025|Forex News, News|0 Comments

The EURUSD price provided additional positive trades yesterday to test the EMA50, noticing that stochastic continues to lose the positive momentum, which supports the chances of bouncing bearishly to resume the main bearish trend, waiting to break 1.0220$ level to confirm rallying towards 1.0100$ as a next main target.


Holding below 1.0325$ is important to the continuation of the expected decline, as breaching it will lead the price to achieve more gains that reach 1.0455$ as a next positive station.


The expected trading range for today is between 1.0210$ support and 1.0360$ resistance


Trend forecast: Bearish


Source link

15 01, 2025

The USDJPY price attempts positively – Forecast today

By |2025-01-15T07:59:02+02:00January 15, 2025|Forex News, News|0 Comments

The EURUSD price provided additional positive trades yesterday to test the EMA50, noticing that stochastic continues to lose the positive momentum, which supports the chances of bouncing bearishly to resume the main bearish trend, waiting to break 1.0220$ level to confirm rallying towards 1.0100$ as a next main target.


Holding below 1.0325$ is important to the continuation of the expected decline, as breaching it will lead the price to achieve more gains that reach 1.0455$ as a next positive station.


The expected trading range for today is between 1.0210$ support and 1.0360$ resistance


Trend forecast: Bearish


Source link

Go to Top