The main tag of Forex News Today Articles.
You can use the search box below to find what you need.
[wd_asp id=1]
18
10, 2024
Soft UK inflation weighs on Pound Sterling
- The Pound Sterling hit two-month lows against the US Dollar, then rebounded.
- GBP/USD looks to S&P Global PMIs and Bailey’s speeches for fresh trading impetus.
- Technically, any Pound Sterling upswings could be short-lived as long as the daily RSI stays bearish.
The Pound Sterling (GBP) fell for the third consecutive week against the US Dollar (USD), as the GBP/USD pair tested levels below the 1.3000 round level for the first time since mid-August before staging a late recovery.
Pound Sterling pounded on increased BoE rate cut bets
Markets turned more dovish on the Bank of England’s (BoE) monetary policy outlook while sealing in a smaller interest-rate cut by the US Federal Reserve (Fed), thus strengthening the US Dollar’s advance at the expense of the Pound Sterling.
The annual UK Consumer Price Index (CPI) inflation fell sharply to 1.7% in September from 2.2% in August, the lowest reading since April 2021 and driven down by lower airfares and petrol prices, the Office for National Statistics (ONS) said on Wednesday. The data came in below the expected 1.9% figure. On Tuesday, the ONS said that the UK pay growth, as measured by the Average Earnings Excluding Bonus, fell below 5.0% in the three months to August.
Falling inflation and softening labor market conditions made the case for rate reductions by the BoE at a faster pace. Following these data, interest rate futures showed investors were pricing a 90% chance of two BoE quarter-point rate cuts by the end of this year, up from roughly 80% at the start of the week.
Meanwhile, the unabated demand for the US Dollar exerted downward pressure on the pair. The bets for a 25 basis points (bps) Fed rate cut next month remained unfazed despite several dovish speeches from Fed policymakers and strong US Retail Sales data, allowing the buck to build on its recovery rally. US Retail Sales rose 0.4% in September after an unrevised 0.1% gain in August, the US Census Bureau said on Thursday.
The USD’s upsurge has lately been sponsored by the market’s optimism that Republican nominee and former US President Donald Trump is set to win the 2024 US presidential elections. Trump’s fiscal and trade policies are seen as inflationary and positive for the Greenback.
Further, rife Middle East geopolitical tensions also contributed to the bullish momentum in the safe-haven US Dollar. Amongst the latest Mideast developments, the Iran-backed militant group Hezbollah said it will escalate war with Israel after Israel’s Foreign Minister confirmed the killing of Hamas leader Yahya Sinwar on Thursday.
On Friday, the GBP/USD pair staged a rebound from two-month lows of 1.2974, as US Dollar buyers resorted to profit-taking after the solid performance during the week. Stronger-than-expected Britain’s Retail Sales data also aided the Pound Sterling recovery. United Kingdom Retail Sales unexpectedly rose by 0.3% in September, compared to a 0.3% decline expected, according to the latest figures from the ONS.
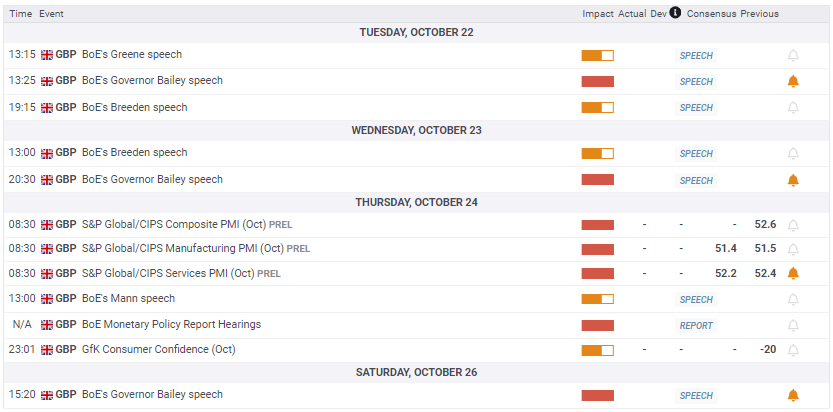
Week ahead: Eyes on PMIs and policymakers
Pound Sterling traders brace for a relatively data-light week, as the first half of the week is devoid of any high-impact data releases from both sides of the Atlantic.
However, the Fed and the BoE policymakers are scheduled to make their appearances, with BoE Governor Andrew Bailey due to speak on Tuesday and late Wednesday.
Thursday will feature the S&P Global preliminary Purchasing Managers Index (PMI) data for October from the US and the UK. The US Jobless Claims data will also be published on the same day. The BoE hawk Monetary Policy Committee member Catherine Mann is due to speak after Cleveland Fed President Beth Hammack’s speech.
The mid-tier US Durable Goods Orders data for September will be released on Friday, making it a quiet calendar heading into Saturday’s speech by BoE Governor Bailey.
Apart from the data releases and the central banks’ commentaries, investors will pay close attention to the market’s pricing of the outcome of the US elections while Mid-East geopolitical developments will also be in focus.
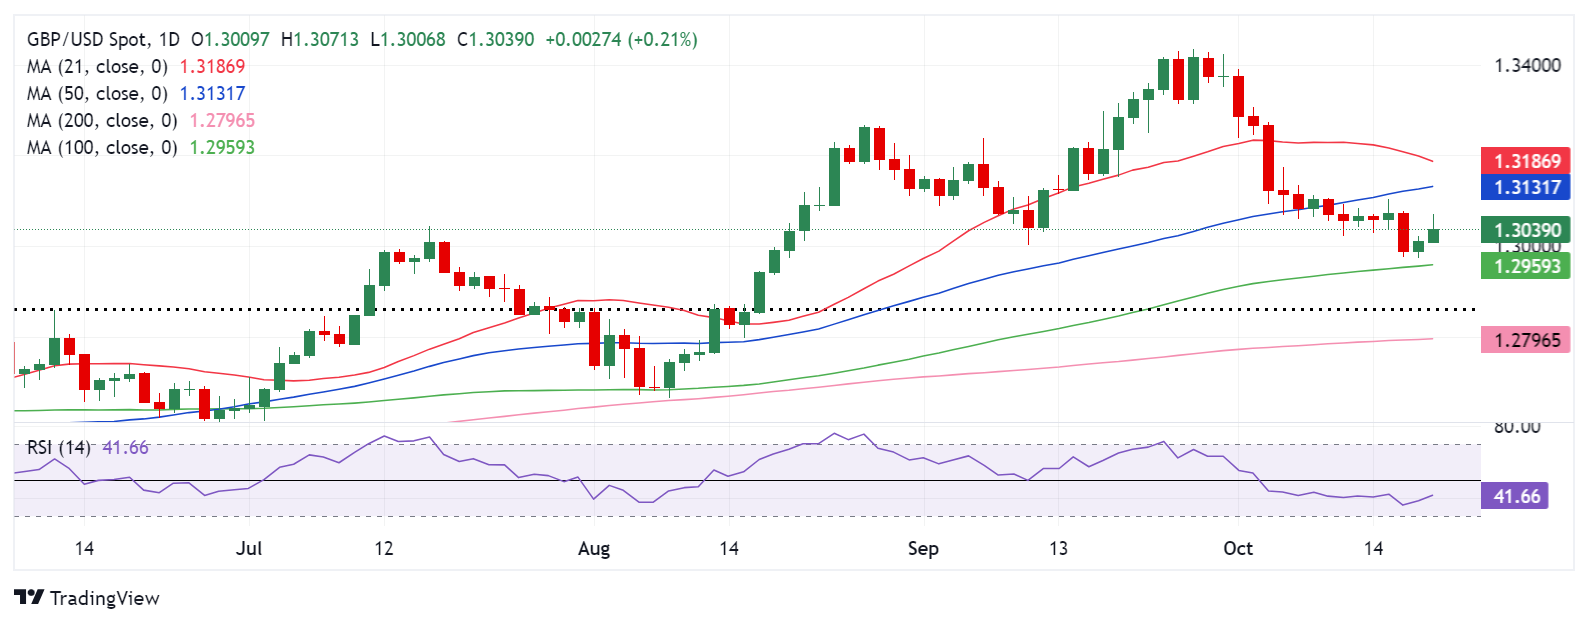
GBP/USD: Technical Outlook
The GBP/USD pair extended the previous week’s downside break of the critical 50-day Simple Moving Average (SMA), then at 1.3101.
The extended decline tested the 100-day SMA support near 1.2960, with more downside likely on the cards, as the 14-day Relative Strength Index (RSI) holds comfortably below the 50 level, currently near 44.
Therefore, any recovery attempt in the pair is likely to be sold off unless the Pound Sterling recaptures the 50-day SMA support-turned-resistance, now at 1.3132.
The next topside barrier is seen at the 21-day SMA at 1.3188. A meaningful uptrend could unfold on a sustained move above that level, opening the door for a test of the 1.3250 psychological barrier.
Pound Sterling will then target the 1.3300 round level should the bullish momentum gain traction.
On the flip side, a daily candlestick closing below the 100-day SMA at 1.2960 could expose the 200-day SMA cap at 1.2796.
Ahead of that, the June 12 high of 1.2861 could offer temporary respite to buyers.
")


")
")
")
")


")